

Market Data

October 31, 2017
U.S. Sees Healthy GDP in Q3
Written by Peter Wright
Growth of U.S. Gross Domestic Product in the third quarter appears to have maintained the strong performance of the second, according to the first estimate of 3Q GDP growth released Friday by the Bureau of Economic Analysis. Growth was reported to be 2.98 percent quarter on quarter and 2.26 percent year on year. (At the end of this piece are some expanded definitions of GDP.)
Economy.com had this to say about Q3 GDP: “The U.S. economy continues to perform well, and economic prospects through 2018 are upbeat. U.S. real GDP growth is on track to come in a little above 2 percent this year and accelerate further above potential next year. Unemployment at just over 4 percent is in line with a full-employment economy, but the tighter labor market has not sparked significant upward pressure on wages or inflation. Hurricanes appear to have had little impact on growth and will likely provide some near-term support as rebuilding and restocking take place in earnest. This was evident in September vehicle sales. It will be a welcome boost, as the composition of GDP growth was somewhat less favorable in the third quarter than the second. Growth in final sales fell with slower consumer spending growth while inventory accumulation made a noteworthy contribution to growth.”
In July, the Congressional Budget Office updated its Budget and Economic Outlook: 2017 to 2027 and summarized as follows: CBO projects that over the next decade, if current laws remained generally unchanged, budget deficits would eventually follow an upward trajectory in relation to the nation’s economic output, and federal debt would rise. Economic growth is projected to remain modest, averaging slightly above 2.0 percent through 2018 and averaging somewhat below that rate for the rest of the period through 2027. The budgetary and economic trends discussed in this report are like those CBO described in January, when the agency issued its previous estimates.”
The preliminary headline report of GDP growth in Q3 came in at 2.98 percent, which was down slightly from 3.06 percent in the third estimate of growth in Q2. GDP is measured and reported in chained 2009 dollars, and on an annualized basis in the third quarter was $17.157 trillion. The growth calculation is misleading because it takes the quarter-over-quarter change and multiplies by four to get an annualized rate. This makes the high quarters higher and the low quarters lower. Figure 1 clearly shows this effect. The blue line is the trailing 12 months growth and the white line is the headline quarterly result. On a trailing 12-month basis, GDP was up by 2.26 percent in Q3, which was close to the 2.21 percent average in 31 quarters since Q1 2010. Therefore, we conclude that the current growth of U.S. GDP is in line with its average for the last seven years.
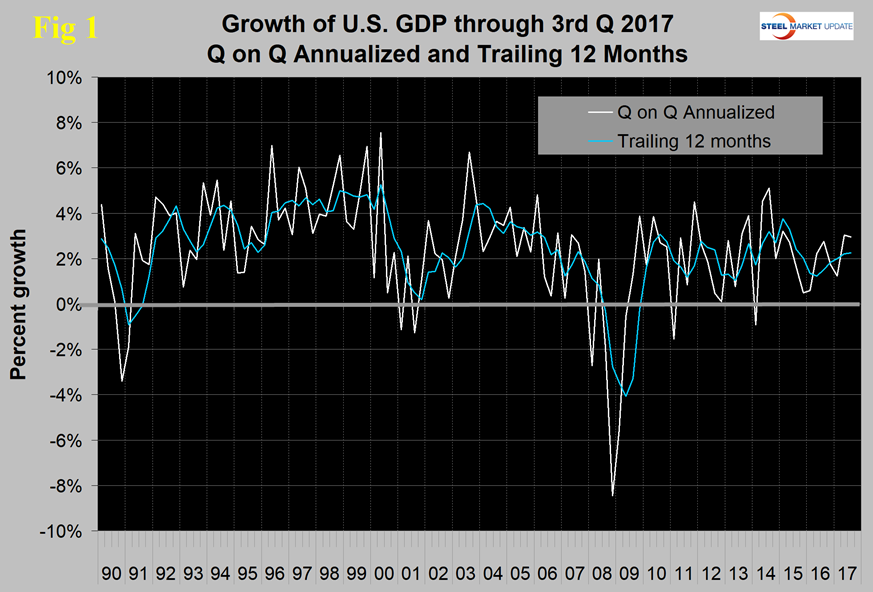
Figure 2 shows the headline quarterly results since 1990 and the July Congressional Budget Office forecast through 2022. The IMF forecasts global and national economic growth each April and October. In its October update, the forecast of U.S. economic growth was revised down for each year through 2022. Growth in 2017 was revised down from 2.31 percent in the April estimate to 2.18 percent, and in 2018 down from 2.52 percent to 2.34 percent.
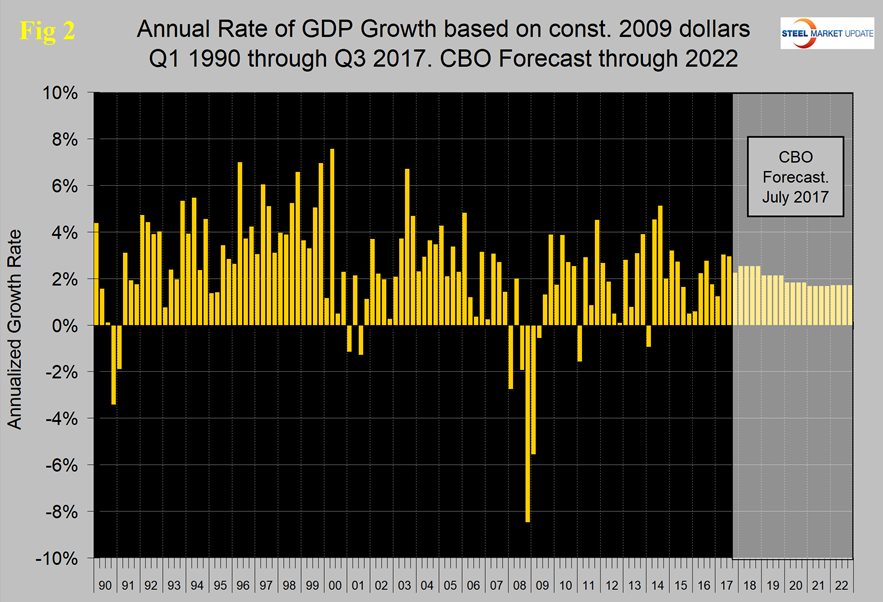
Figure 3 shows the change in the six major subcomponents of GDP in Q3 2017. Normally, personal consumption is the dominant growth driver, and this continued to be the case in the third quarter. Personal consumption includes goods and services, the goods portion of which includes both durable and non-durables.
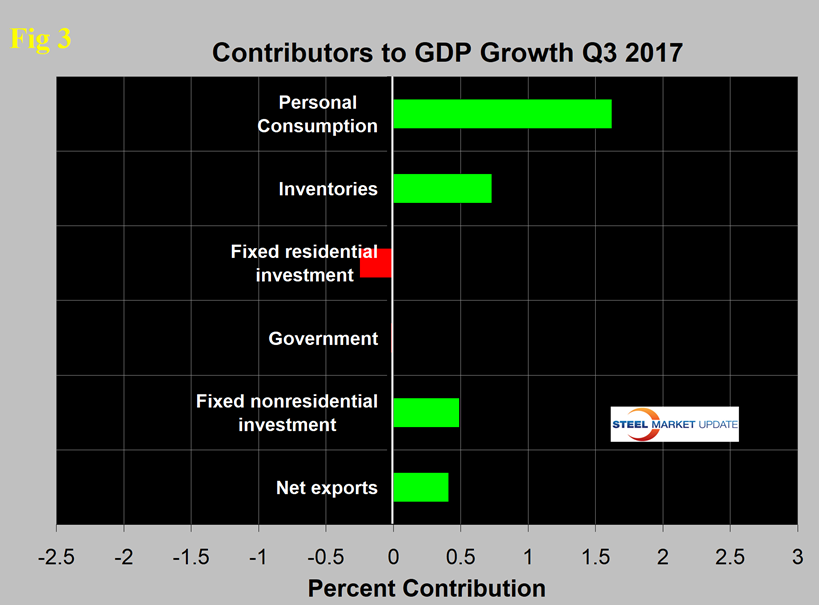
The contribution of inventories increased from 0.12 percent in Q2 to 0.73 percent in Q3. Rising inventories are entered as a positive in the GDP calculation. Note that in the definitions at the end of this piece, inventories are not mentioned. Over the long run, inventory changes are a wash and simply move growth from one period to another. Fixed residential investment was almost unchanged in Q3, but the contribution of nonresidential investment declined from 0.82 to 0.49 percent. Net exports have made a positive contribution in five of the last six quarters, influenced by the decline in the value of the dollar. The contribution of government expenditures has been almost zero in the last two quarters.
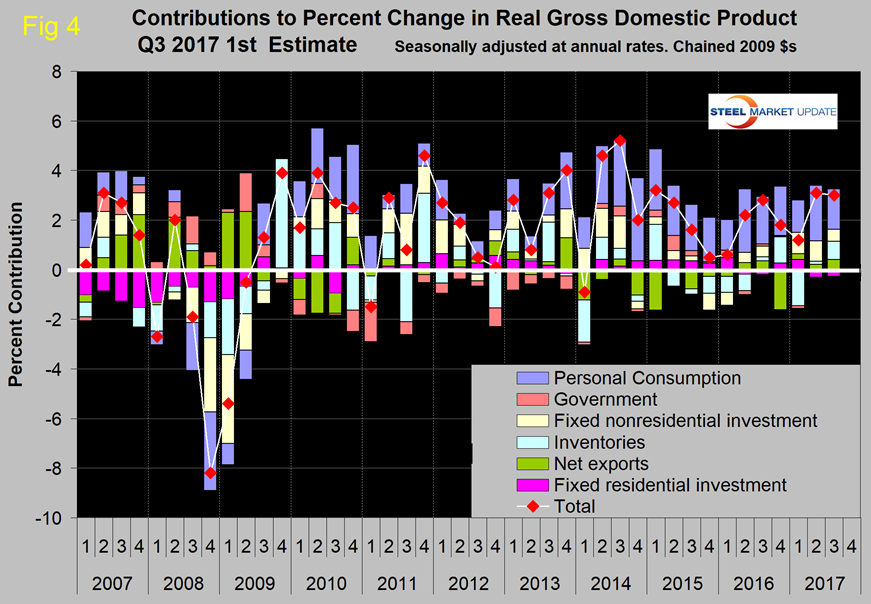
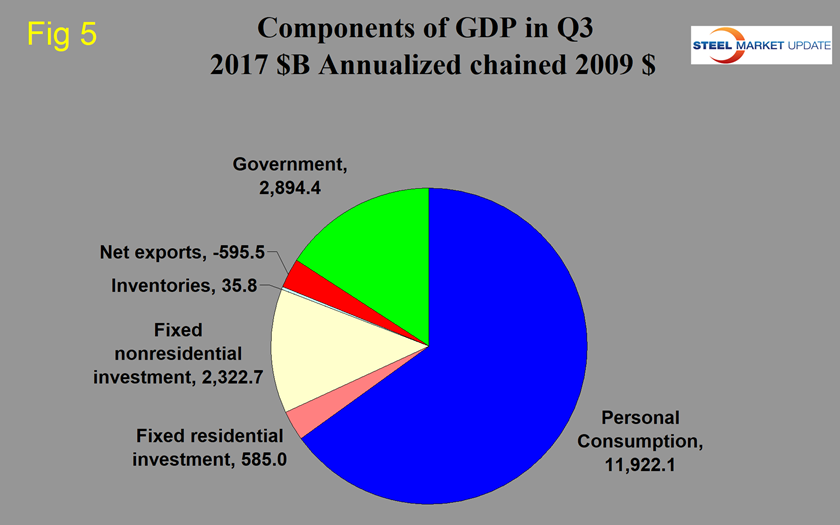
Figure 4 shows the quarterly contributors of the six major subcomponents to GDP since Q1 2007. This chart clearly shows the whipsaw effect of inventory changes. Figure 5 shows the breakdown of the $17 trillion economy.
SMU Comment: The important thing to realize, in our opinion, is that GDP growth on a year-over-year basis has been very consistent in the last eight quarters, during which period it has ranged from 1.23 percent to 2.26 percent. Q3 this year at 2.26 percent was the best result of those eight quarters. Since Q3 2010, there have only been two quarters when the year-over-year growth exceeded 3.0 percent. In July, the Congressional Budget Office forecast much of the same for the next decade. Another definition of GDP that is not included below is that it equals the growth in working population multiplied by their productivity, neither of which currently has much momentum.
Definition of GDP: Gross domestic product (GDP) is the value of the goods and services produced by the nation’s economy less the value of the goods and services used up in production. GDP is defined as Consumption (C) plus Investment (I) plus Government Spending (G) plus [Exports (E) minus Imports (I)] or:
GDP = C + I + G + (E-I). This equation is known as an identity. An identity is an equality that remains true regardless of the values of any variables that appear within it. That means it is not a guess or an approximation. It is simple reality.
National savings is GDP minus consumption and government spending. That means that investment equals savings plus net exports. If there are no net exports, then money must come back into the U.S. from outside the country to finance investments, along with savings. Thus, if there is a government deficit, there must be savings by both consumers and businesses, plus capital flows from outside the country, to offset that deficit for there to be any money left over for investments.


