

Prices

December 12, 2017
Demand for Sheet, Galvalume Improves through October
Written by Peter Wright
Demand for sheet products improved in the three months through October by 3.2 percent year over year, led by hot rolled and other metallic coated. Demand for Galvalume is surging at the expense of galvanized sheet, according to Steel Market Update’s latest analysis of American Iron and Steel Institute (AISI) and U.S. Department of Commerce data.
Apparent supply is a proxy for market demand. This report summarizes total steel supply by product from 2003 through October 2017 and year-on-year changes. It then compares domestic mill shipments with total supply to the market. It quantifies market direction by product and enables a side-by-side comparison of the degree to which imports have absorbed demand.
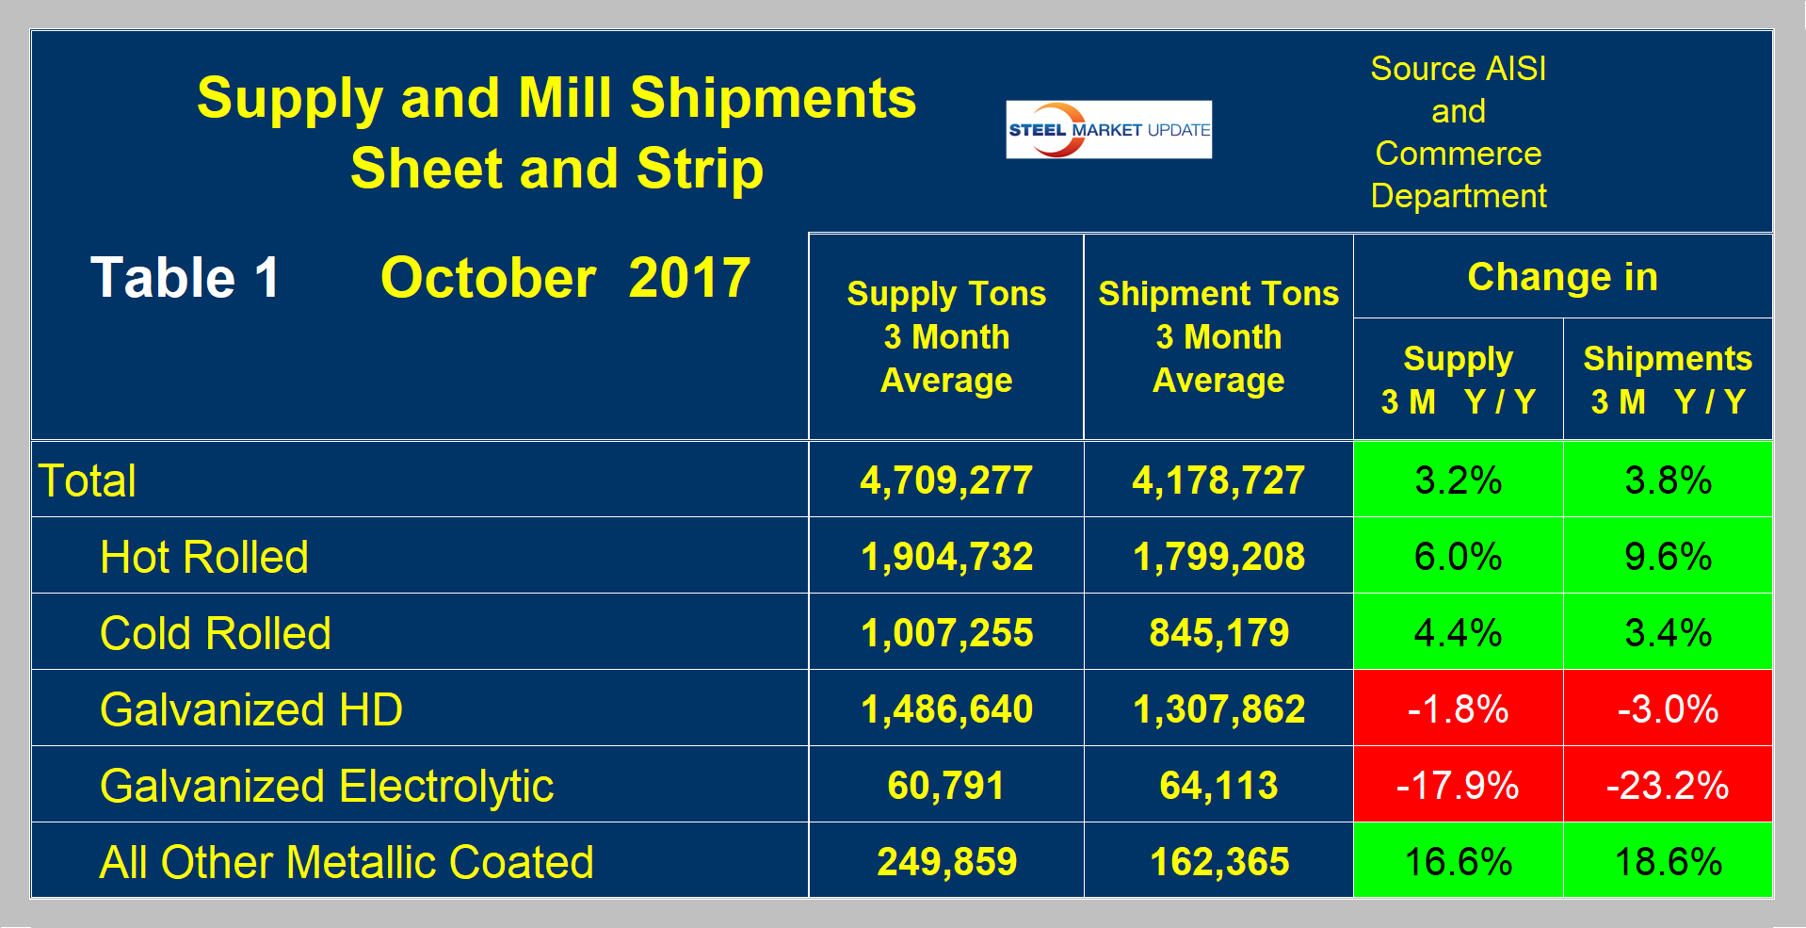
![]() Table 1 describes both apparent supply and mill shipments of sheet products (shipments includes exports) side by side as three-month averages through October with year-over-year growth rates for each. Comparing the year-over-year time periods, total supply to the market increased by 3.2 percent and mill shipments by 3.8 percent. The fact that mill shipments were up by more than supply means that imports were less of a factor in the market compared to the same three months last year. Table 1 breaks down the total into product detail and shows that demand for other metallic coated (mainly Galvalume) is surging as both hot-dipped and electrogalvanized demand is declining. The effect of less import pressure was particularly evident in hot rolled coil.
Table 1 describes both apparent supply and mill shipments of sheet products (shipments includes exports) side by side as three-month averages through October with year-over-year growth rates for each. Comparing the year-over-year time periods, total supply to the market increased by 3.2 percent and mill shipments by 3.8 percent. The fact that mill shipments were up by more than supply means that imports were less of a factor in the market compared to the same three months last year. Table 1 breaks down the total into product detail and shows that demand for other metallic coated (mainly Galvalume) is surging as both hot-dipped and electrogalvanized demand is declining. The effect of less import pressure was particularly evident in hot rolled coil.
Apparent Supply
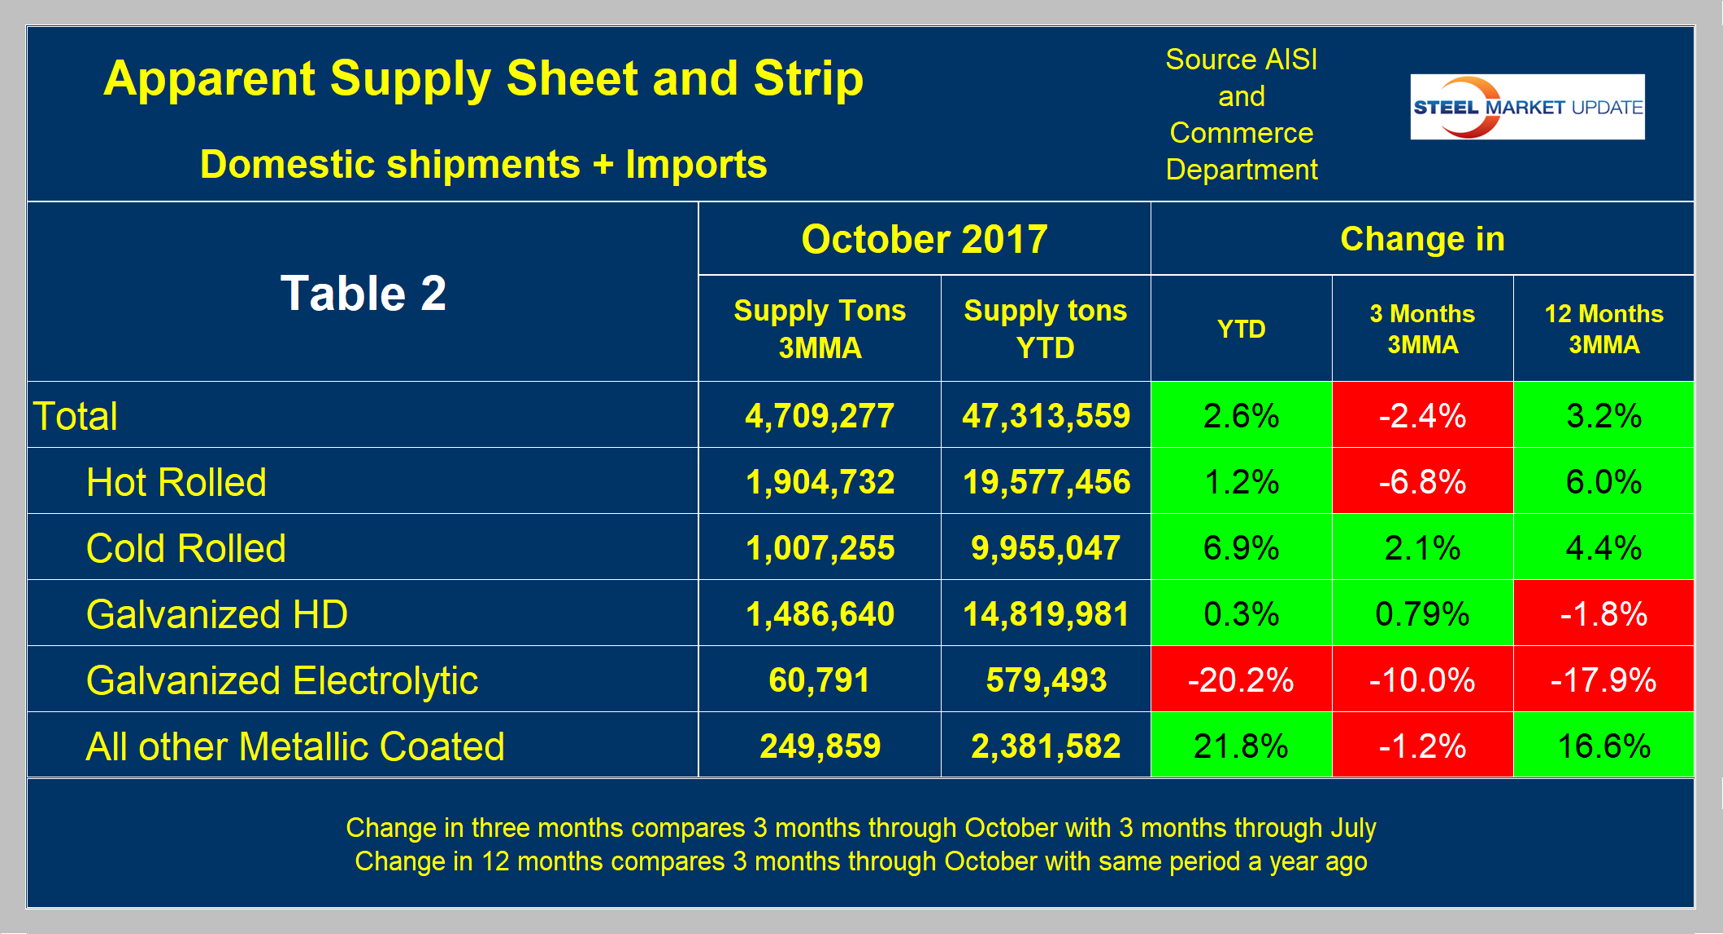
Apparent supply is defined as domestic mill shipments to domestic locations plus imports. In the three months through October 2017, the average monthly supply of sheet and strip was 4.709 million tons, up by 2.6 percent year to date and by 3.2 percent in three months through October year over year. The three months through October were down by 2.4 percent compared to the three months through July. There is no seasonal manipulation of any of these numbers. By definition, year-over-year comparisons have seasonality removed, but 3M/3M comparisons do not. Table 2 shows the change in supply by product on this basis through October.
We think it’s important to get a more accurate measure of the short-term trend, so we have developed Figure 1 this month to clarify the seasonality issue. We have calculated the average 3M/3M change in the eight years since and including 2010. In that time, the three months through October have been down by 0.4 percent; this year that comparison was down by 2.4 percent.
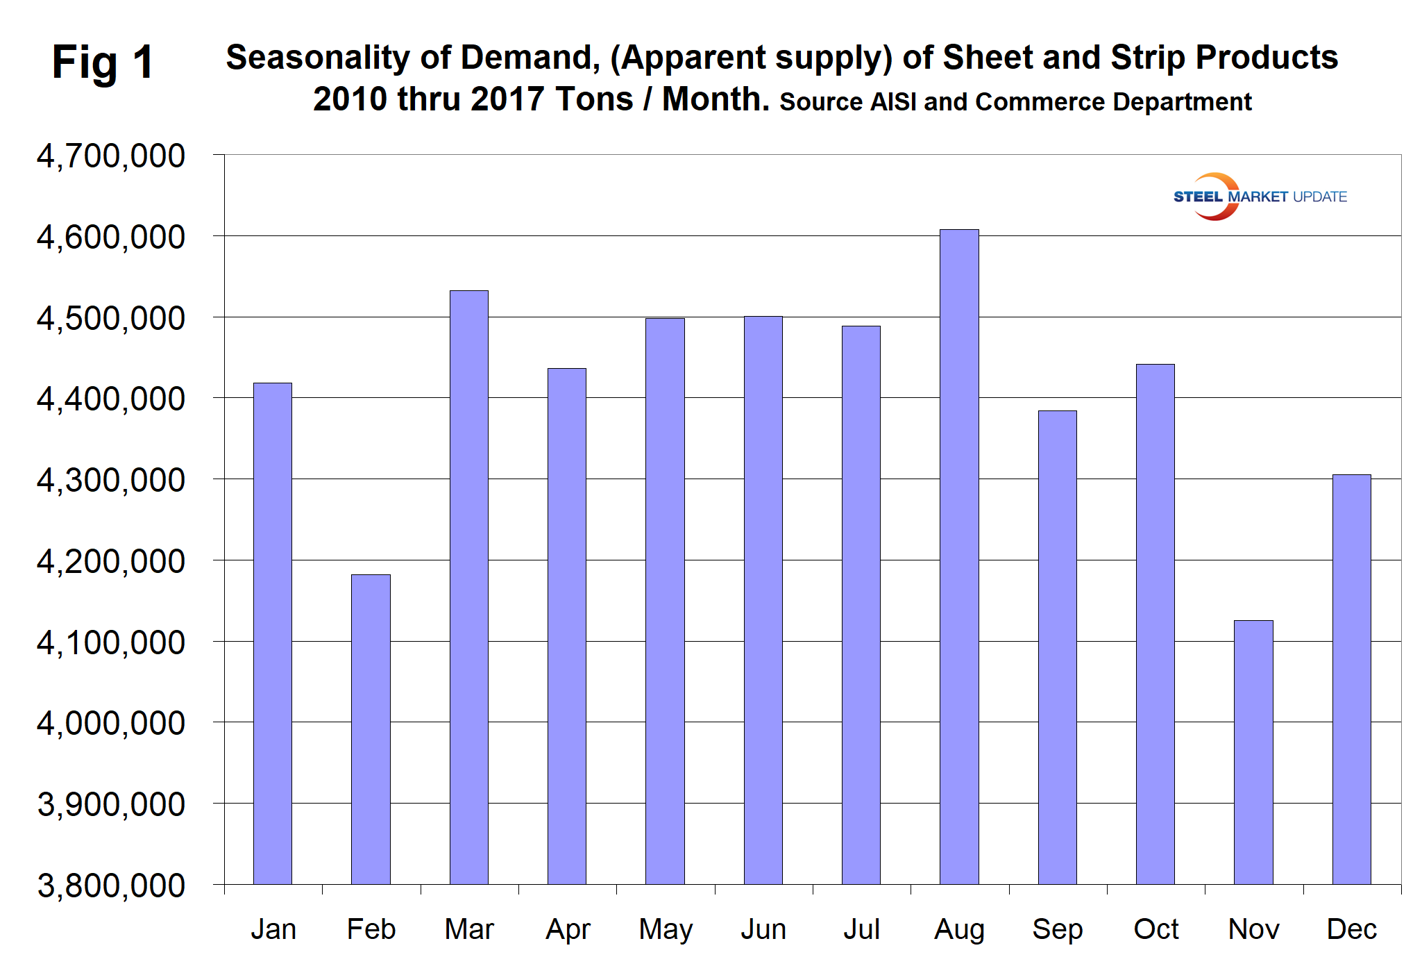
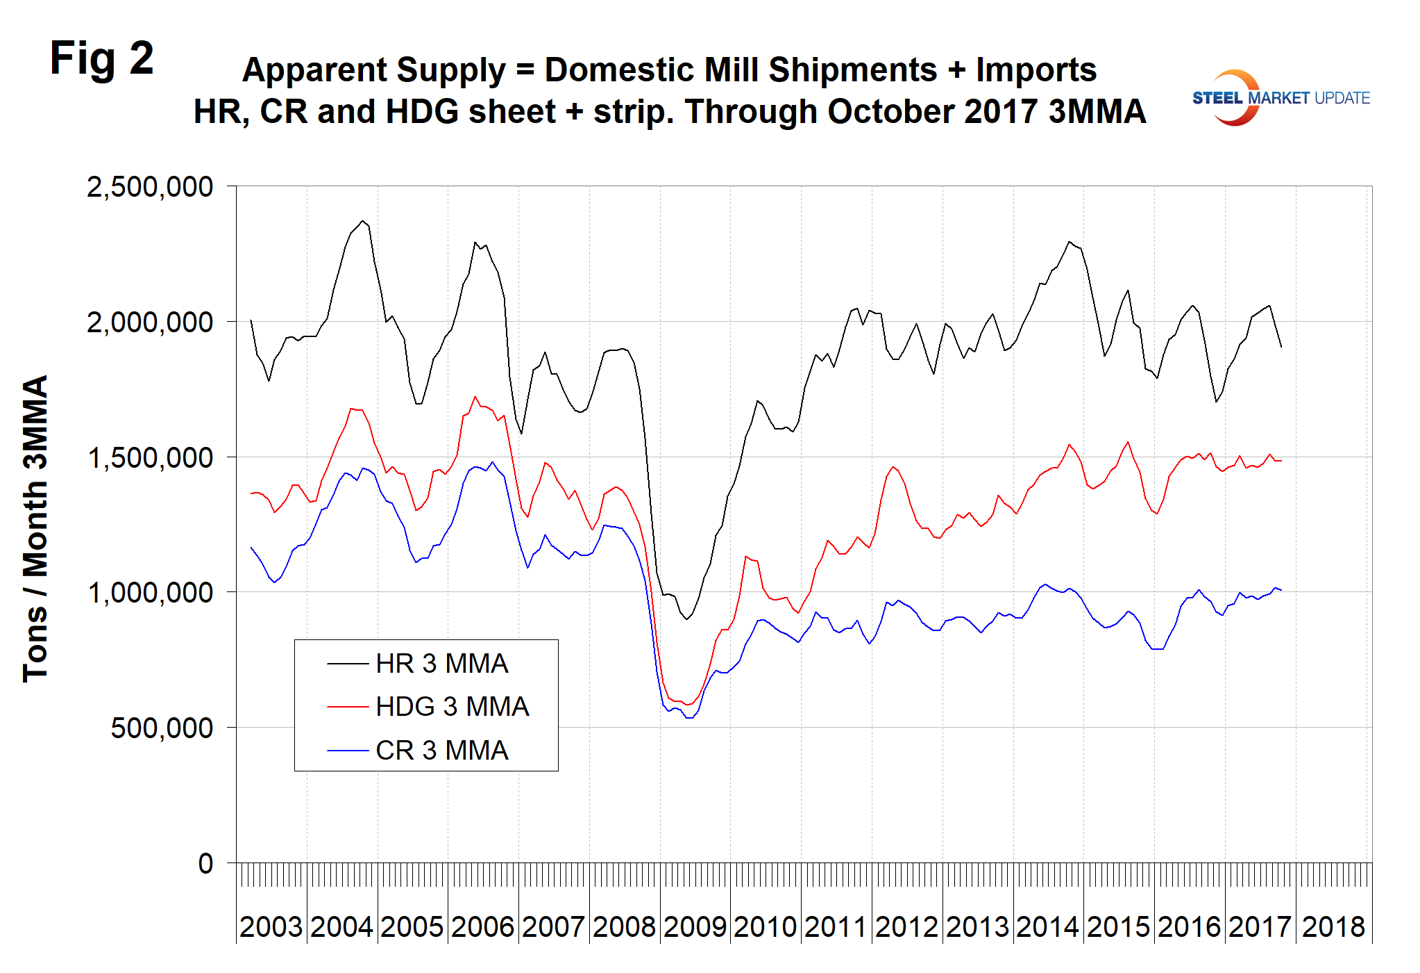
Figure 2 shows the long-term supply picture for the three major sheet and strip products, HRC, CRC and HDG, since January 2003 as three-month moving averages.
Mill Shipments
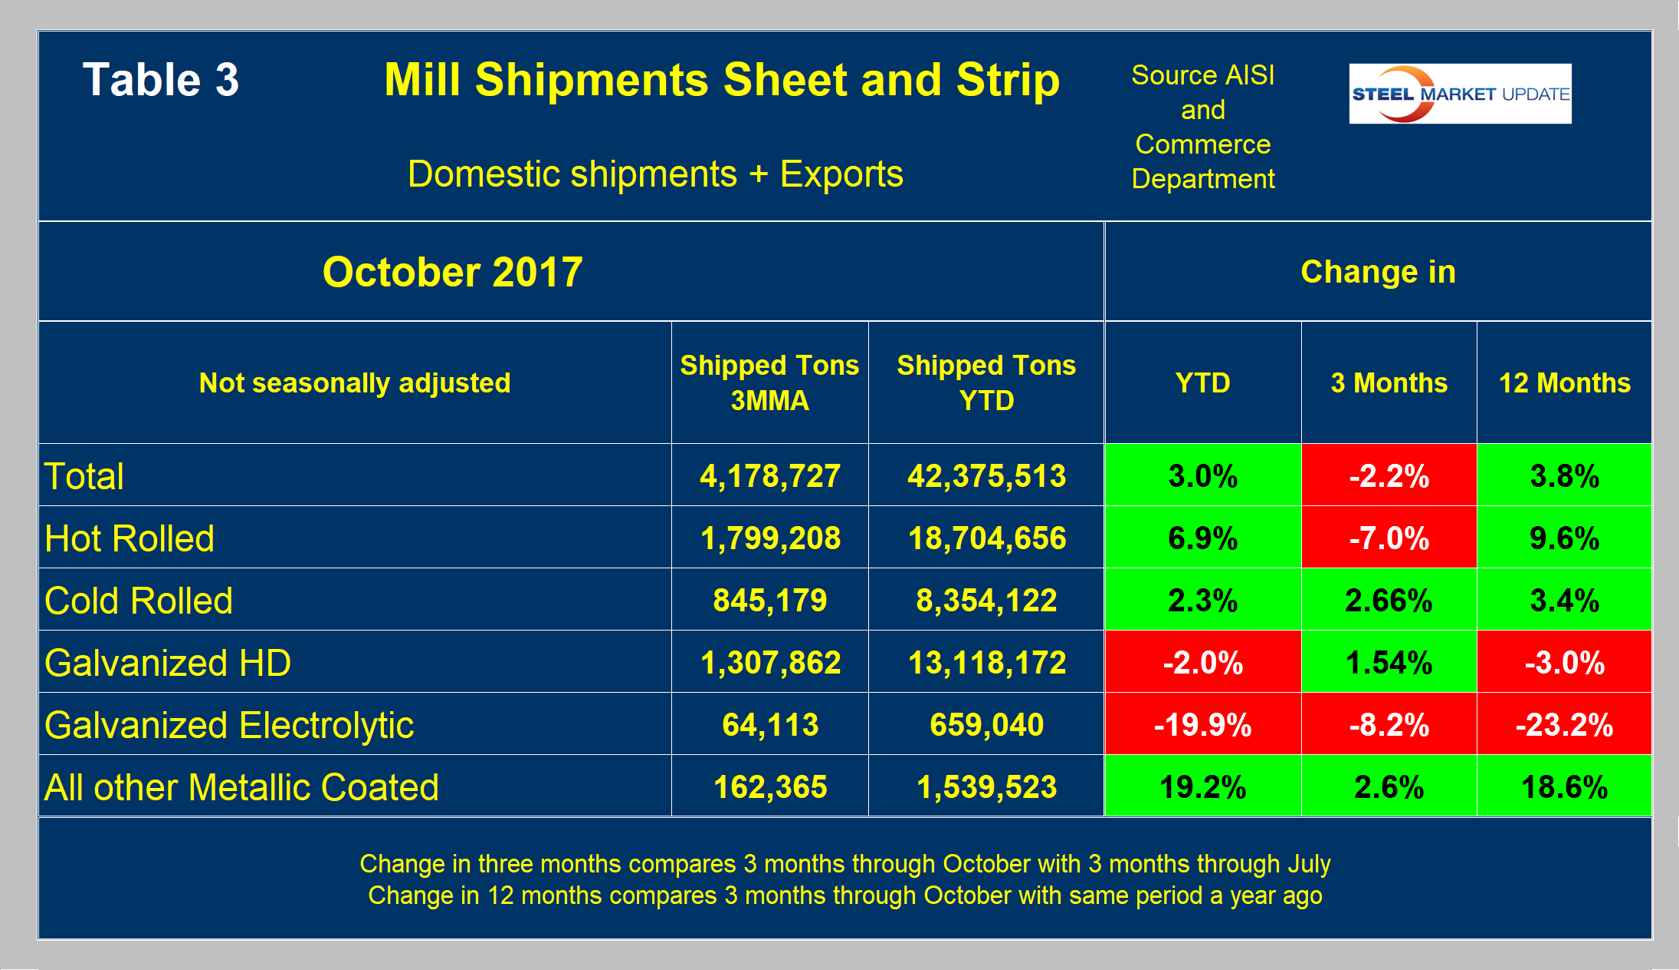
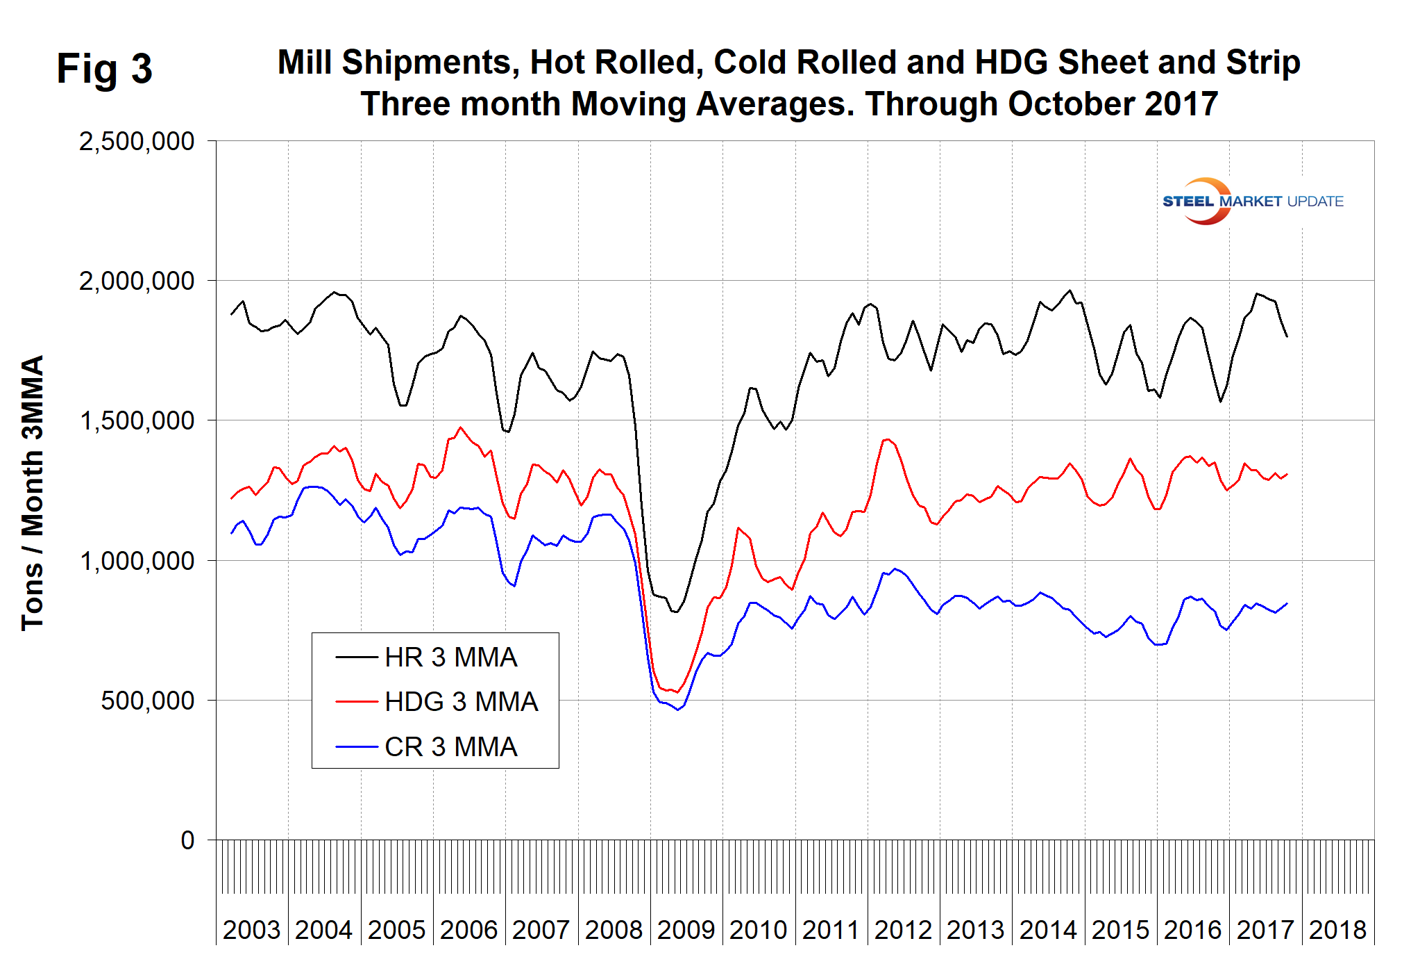
Table 3 shows that total shipments of sheet and strip products including hot rolled, cold rolled and all coated products were up by 3.0 percent year to date, and up by 3.8 percent in the three months through October year over year. The negative growth in three months through October compared to three months through July is partly a seasonal effect as described above. Other metallic coated has had very strong growth year to date. Figure 3 puts the shipment results for the three main products into the long-term context since January 2003.
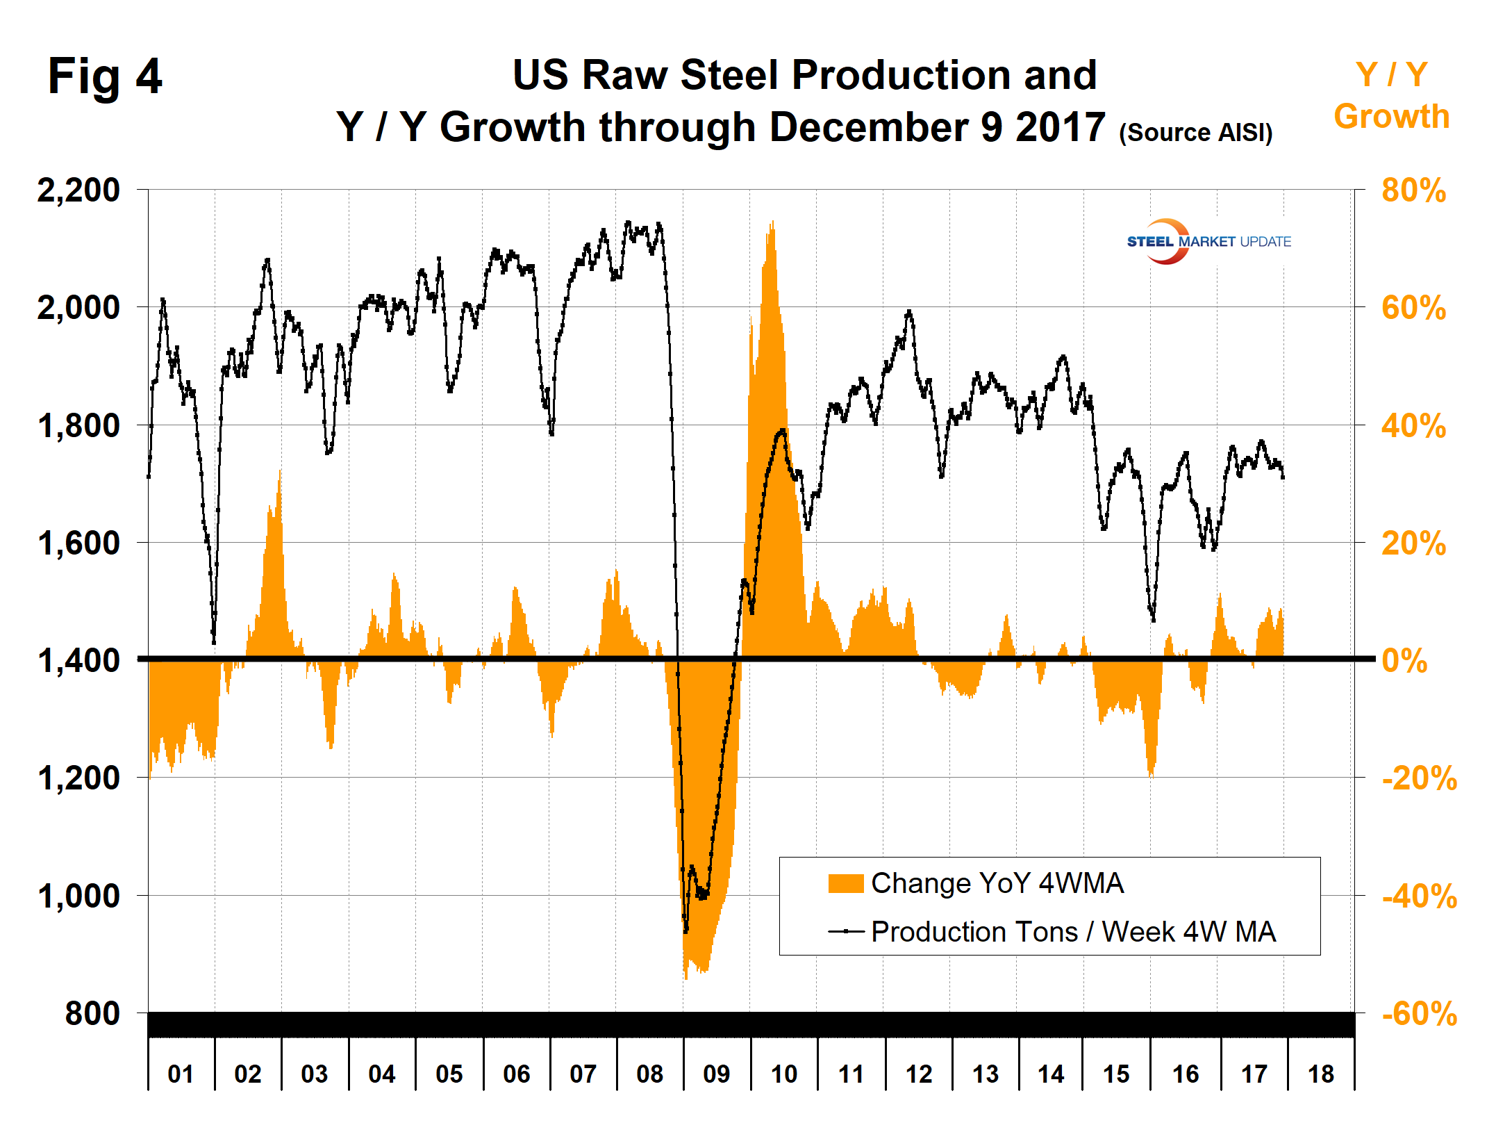
SMU Comment: A problem with this data is that it’s now well into December and the latest information that we have for shipments and supply is for October. AISI puts out weekly data for crude steel production, the latest for which was the week ending Dec. 9. This provides the most current data for steel mill activity. Figure 4 shows the year-over-year change in weekly crude output on a four-week moving average basis. Growth became positive year over year in the week ending Oct. 29, 2016, has been greater than 5.0 percent every week since July 29 and greater than 7.0 percent in the latest five weeks of data. Imports of sheet products surged to over a million tons in July and August, but fell back to 904,000 tons in October.
Licensed volume in November recovered to 922,000 tons. Based on the strength of the economic indicators analysis that SMU performs and our proprietary measure of buyer sentiment, we are expecting demand for sheet products to continue to increase into Q1 2018.


