

Market Data

December 19, 2017
Energy Prices, Rotary Rig Counts for December 2017
Written by Peter Wright
On Nov. 3, the spot price of West Texas Intermediate (WTI) closed above $55 per barrel and hasn’t fallen below that level through the latest data on Dec. 11. The total number of operating rigs exploring for oil and gas increased every week from Nov. 10 through Dec. 8, though at a declining rate, and in the week ending Dec. 15 the rig count declined by one. Some analysts predict the energy market will be undersupplied in 2018, lending further support to oil and gas prices. The prices of oil and natural gas drive the consumption of energy-related steel products including oil country tubular goods, pipe fittings and well head equipment, among others. A significant volume of hot rolled coil is used to make welded tubular goods.
On Dec. 1, HFI Research wrote: “OPEC and non-OPEC members have agreed to extend cuts until the end of 2018 without any special provisions, which is what we had expected. The question for everyone now is, ‘What now?’ For us, the long-term oil bull thesis continues to play out as expected. Non-OPEC supply decreases will become more prevalent in 2018, with the bulk of the declines coming in 2019. Higher U.S. shale oil production, along with higher OPEC production, will be needed to compensate for the declines everywhere else. U.S. crude storage will also start to decline nicely as refinery throughput actually increases toward year-end vs. EIA’s current overestimation of throughput.”
Commodity Hedge Fund, Goehring & Rozencwajg Associates (GRA) wrote the following in their latest quarterly letter: “Most oil analysts at the start of 2017 believed U.S. crude production would grow by approximately one million barrels per day between Jan. 1 and Dec. 31. That level of growth would imply full-year 2017 oil production of 9.3 million barrels per day or 450,000 b/d above 2016 levels. Many analysts felt these estimates would ultimately be revised higher. Even with substantial OPEC production cuts, the energy analytic community has vigorously argued that because of strong U.S. shale oil growth, global oil markets would remain in long-term structural surplus. However, data has now emerged suggesting that U.S. crude production growth is rapidly slowing. Between September 2016 and February 2017, U.S. crude production grew by 100,000 barrels per day per month, but since then U.S. production has ground to a near standstill. Between February and July, U.S. production has only grown by 33,000 barrels per day per month – a slowdown of 67 percent. The slowdown in U.S. onshore production growth is even more puzzling given the huge increase in drilling that took place over that time. The Baker Hughes oil rig count is up 130 percent since bottoming in May of last year. In spite of a surging rig count, onshore production growth is now showing signs of significant deceleration. Although it is still early in the production history of the shales, it now appears the growth in U.S. shale production may not be nearly as robust as originally expected. If our observations and analysis are correct, then the oil market will be even more undersupplied than we expected in Q4 and incredibly undersupplied into 2018. The ramifications are going to be huge.”
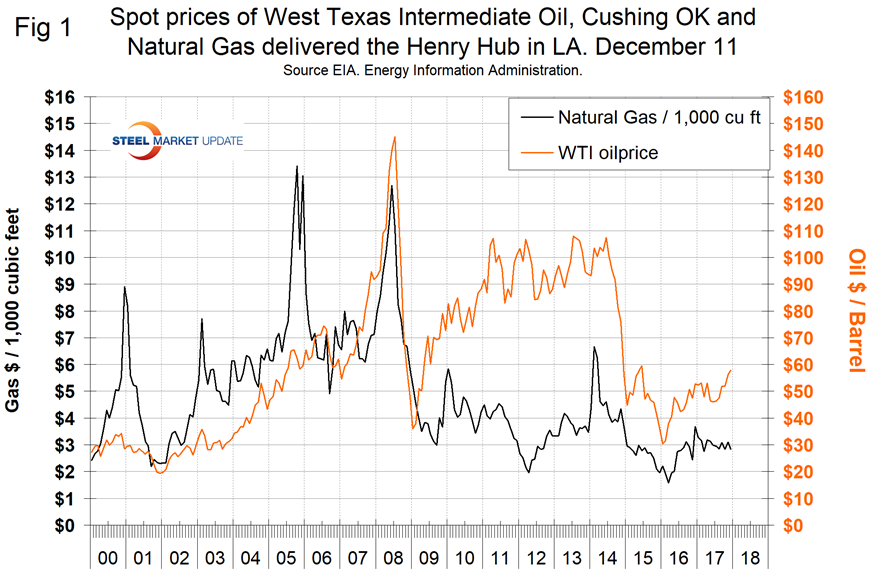
Figure 1 shows historical oil and gas prices since January 2000. The price of WTI at spot $56.84 is now higher than at any time since June 2015.
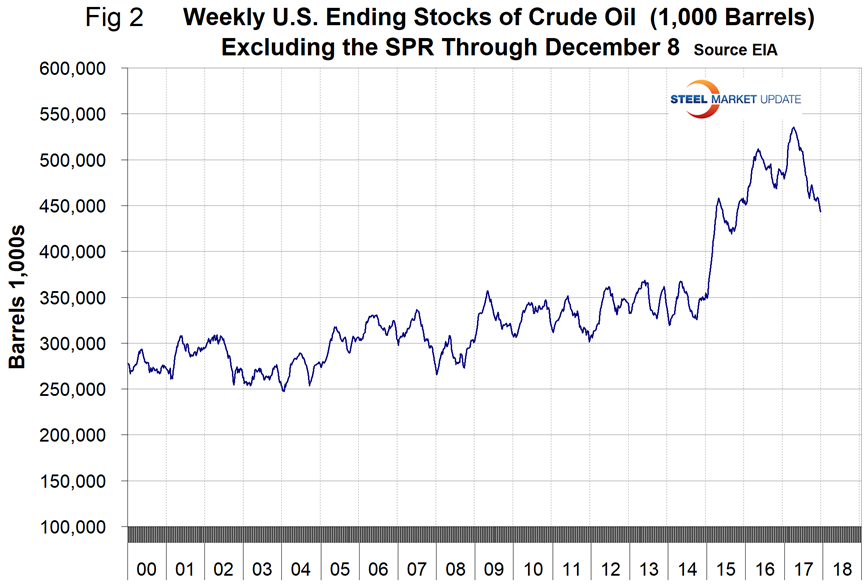
Our price and inventory data comes from the Energy Information Administration (EIA). Since March 24, U.S. stocks of crude oil, excluding the strategic petroleum reserve, declined from 534 million to 443 million barrels, a reduction of 17.0 percent. On a year-over-year basis, stocks have declined for 21 straight weeks, though they are still well above the historical norm (Figure 2).
The price of natural gas on Dec. 8 at the Henry Hub in Louisiana was $2.84/1,000 cu.ft. This was 26 cents lower than in our November update, but the same as in October. EIA expects the share of total U.S. utility-scale electricity generation from natural gas to average about 32 percent in 2017, down from 34 percent in 2016, as a result of higher natural gas fuel costs and increased generation from renewable energy sources. EIA projects the 2017 share of generation from coal will average 30 percent, about the same as last year. The forecast 2018 generation shares for natural gas and coal remain relatively unchanged from 2017, averaging 32 percent and 31 percent, respectively. Generation from renewable energy sources other than hydropower will grow from about 8 percent in 2016 to a forecast share of nearly 10 percent in 2018. Nuclear power’s forecast share of total electricity generation averages about 20 percent in both 2017 and 2018, similar to its 2016 level.
The total number of operating rigs in the U.S. on Dec. 15 was 930, up from 923 in our last update, but still below the recent peak of 958 on July 28. Figure 3 shows the total number of operating rigs and the weekly change.
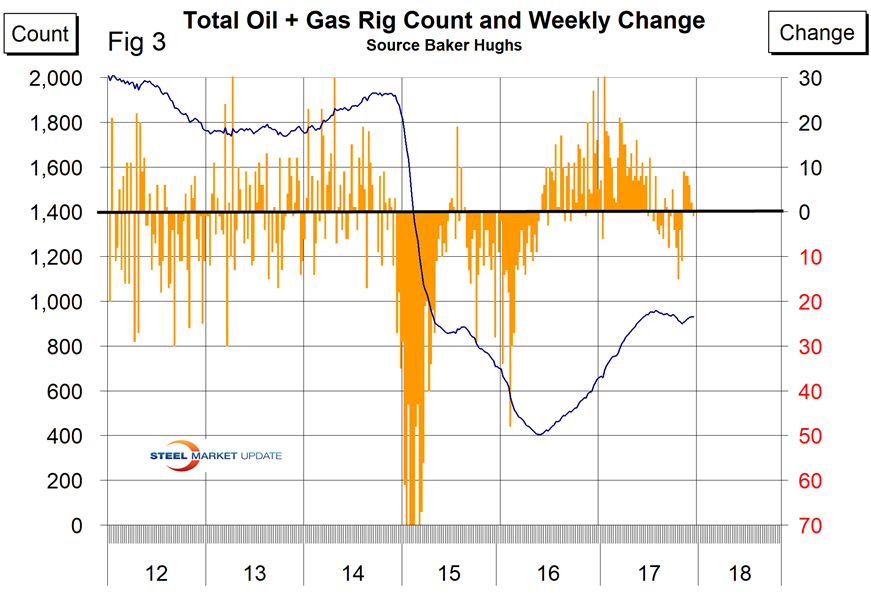
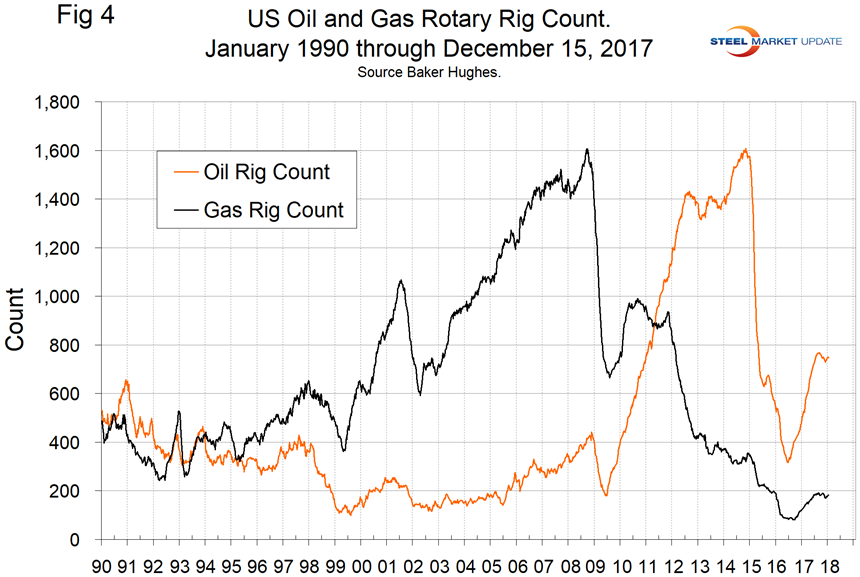
In the week ending Nov. 10, the rig count increased by nine, but slowed for each of the next five weeks, becoming negative in the week ending Dec. 15. The oil rig count had a low point of 316 on June 27, 2016, and stood at 747 on Dec. 15. The U.S. gas rig count rose from its low point of 81 on Aug. 5, 2016, to 183 on Dec. 15. The year-over-year growth rate of U.S. total rigs was 46.0 percent in the latest data. Figure 4 shows the Baker Hughes U.S. Rotary Rig Counts for oil and gas equipment in the U.S. (explanation below).
On a regional basis in the U.S., the big three states for operating rigs are Texas, Oklahoma and North Dakota. Figure 5 shows the land rig count in those states since 2000 and that nonconventional drilling in North Dakota was down by 73 percent from its heyday in late 2014. This is not as bad as it sounds because previously drilled and capped wells are being put back on stream.
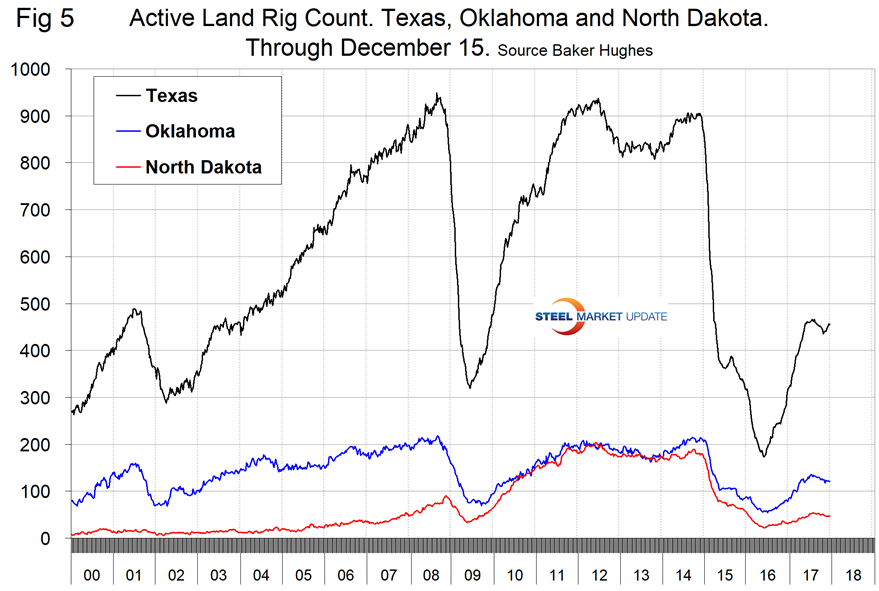
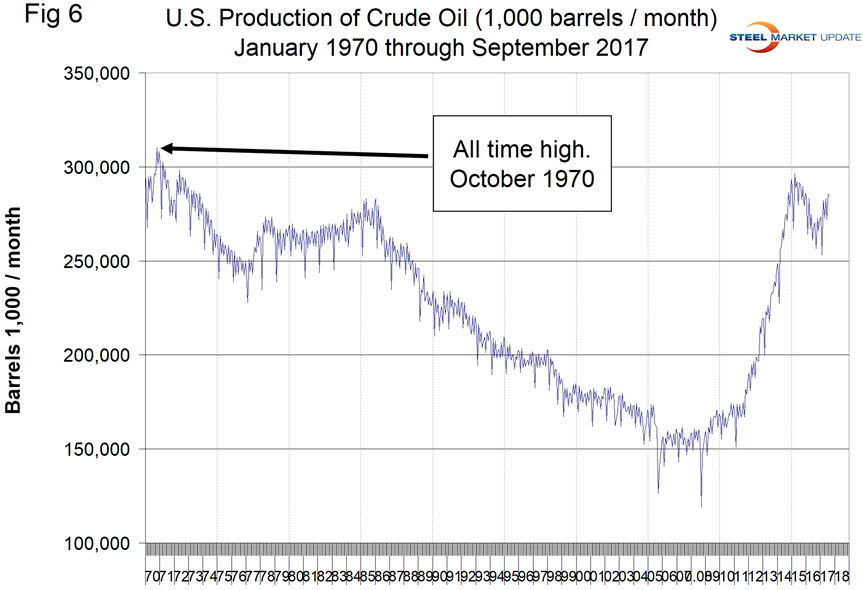
Figure 6 illustrates the monthly U.S. oilfield production of crude from January 2005 through August 2017 with an indication of the all-time high of 310 million barrels that occurred in November 1970.
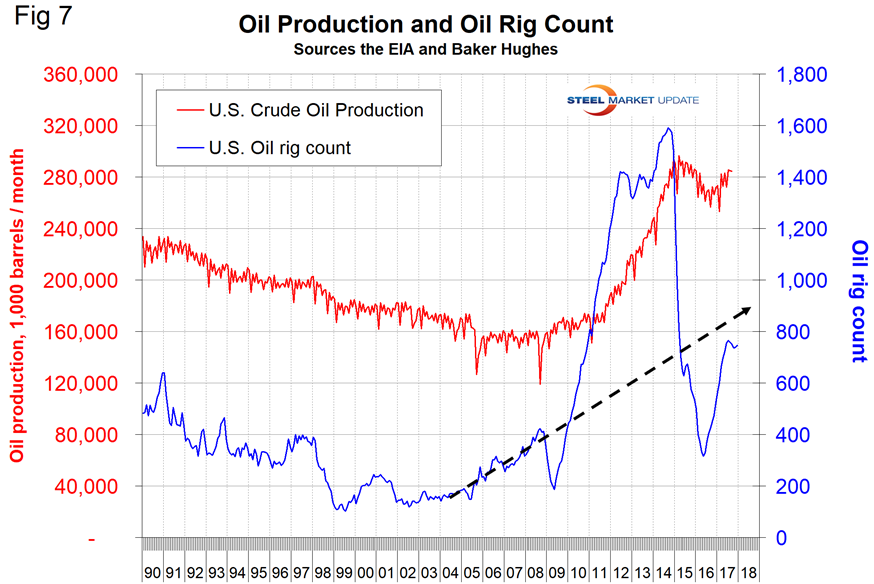
Production in September was 284.4 million barrels, up by 10.9 percent year over year. Figure 7 compares oil production and the oil rig count and shows how the increase in exploratory wells drove production from 2009 through late 2014 when the oil price collapsed. The subsequent decline in production was much less marked and is again increasing. Our take on this is that the huge increase in exploratory oil rigs beginning in 2009 may have been an anomaly and that we won’t see a repeat of the number operating in 2014 for a very long time.
Baker Hughes Rotary Rig Count: This is a weekly census of the number of drilling rigs actively exploring for or developing oil or natural gas in the United States. Rigs are considered active from the time they break ground until the time they reach their target depth and may be establishing a new well or sidetracking an existing one. The Baker Hughes Rotary Rig count includes only those rigs that are significant consumers of oilfield services and supplies.


