Analysis

January 24, 2018
ABI Finishes Strong in 2017
Written by Sandy Williams
Architecture firms saw increases in billings in 10 out of 12 months last year. December was no exception with an Architecture Billings Index score of 52.9, a decrease from November’s score of 55, but still firmly in growth territory.
Firms reported strong backlogs and inquiries into new projects. The new projects inquiry index registered 61.9, up from a reading of 61.1 in November. The new design contracts index decreased slightly from 53.2 to 52.7.
All regions except the Northeast reported billings growth in December. The South achieved the fifth consecutive year in which billings increased in all 12 months.
“Overall, 2017 turned out to be a strong year for architecture firms. All but two months saw ABI scores in positive territory,” said AIA Chief Economist Kermit Baker. “Additionally, the overall strength of the fourth quarter lays a good foundation for healthy growth in construction activity in 2018.”
Profitability was reported as the biggest concern for architectural firms in 2018, followed by finding qualified new staff.
Key December ABI Highlights:
• Regional averages: West 53.0, Midwest 52.9, South 56.3, and Northeast 49.4.
• Sector Breakdown: Commercial/Industrial 54.8, Institutional 51.2, Mixed Practice 50.4, Multifamily 55.4
About the AIA Architecture Billings Index
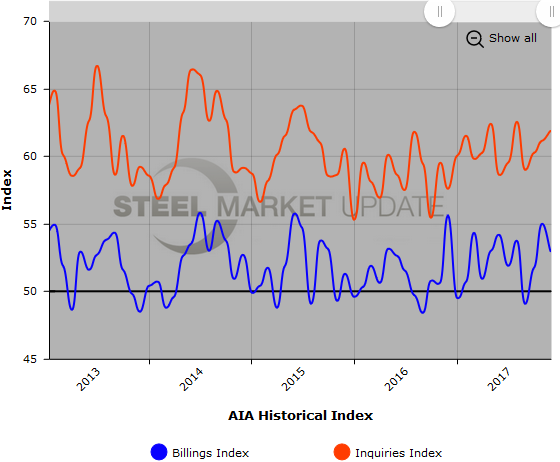
The Architecture Billings Index (ABI), produced by the American Institute of Architects, is considered a leading economic indicator of construction activity, and reflects the approximate nine- to 12-month lead time between architecture billings and construction spending. The survey panel asks participants whether their billings increased, decreased or stayed the same in the month that just ended. The regional and sector categories are calculated as a three-month moving average, whereas the national index, design contracts and inquiries are monthly numbers. The monthly ABI index scores are centered on the neutral mark of 50, with scores above 50 indicating growth in billings and scores below 50 indicating a decline.
Below is a graph showing the history of the Architecture Billings Index and Induiries Index. You will need to view the graph on our website to use its interactive features, you can do so by clicking here. If you need assistance logging into or navigating the website, please contact our office at 800-432-3475 or info@SteelMarketUpdate.com.