

Market Data

January 26, 2018
BEA: Fourth-Quarter GDP a Solid 2.57 Percent
Written by Peter Wright
The growth of U.S. Gross Domestic Product in the fourth quarter of 2017 declined from the strong performance of the second and third quarters, but the overall trend is good.
The Bureau of Economic Analysis released its first estimate of GDP growth in the fourth quarter on Friday. Growth was reported to be 2.57 percent quarter on quarter and 2.50 percent year on year. At the end of this piece are some expanded definitions of GDP.
Economy.com reported: “U.S. GDP growth remained strong in the fourth quarter and its composition improved. Real GDP grew 2.6 percent, modestly below the 3.2 percent in the third quarter, according to the advance estimate from the BEA. Consumer spending and fixed investment growth improved, but inventory accumulation and trade became drags on growth. Government made a positive contribution. Real disposable income improved to a 1.1 percent growth, after rising 0.5 percent in the third quarter. The saving rate fell to 2.6 percent, its lowest level since 2005.”
The first estimate of GDP growth in Q4 came in at 2.57 percent, which was down from 3.16 percent in the third estimate of growth in Q3. GDP is measured and reported in chained 2009 dollars, and on an annualized basis in the third quarter was $17.273 trillion. The growth calculation is misleading because it takes the quarter-over-quarter change and multiplies by 4 to get an annualized rate. This makes the high quarters higher and the low quarters lower. Figure 1 clearly shows this effect. The blue line is the trailing 12-months growth and the white line is the headline quarterly result. On a trailing 12-month basis, GDP was up by 2.50 percent in Q4, which was the best result since Q2 2015 and better than the 2.15 percent average in 32 quarters since Q1 2010. Therefore, we conclude that the current growth of U.S. GDP is better than its average for the last seven years.
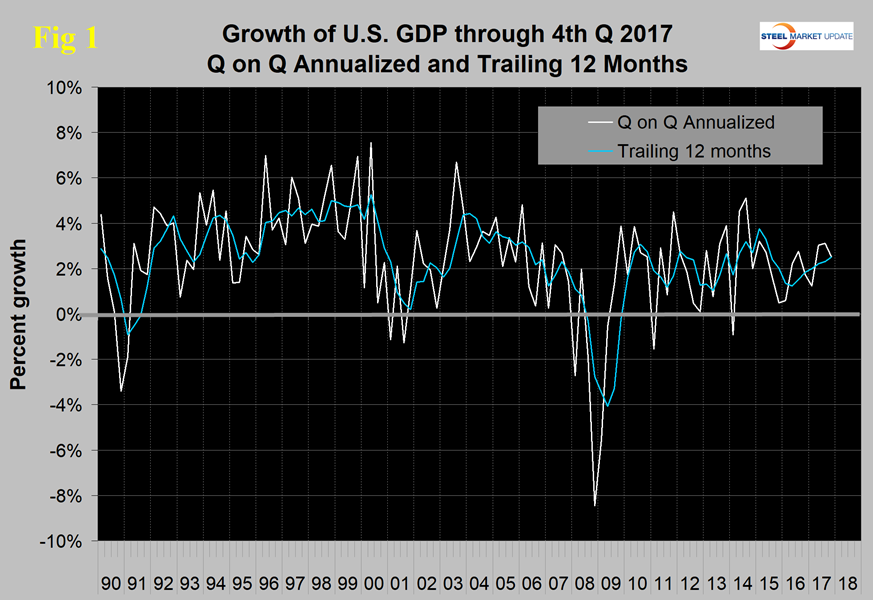
Figure 2 shows the headline quarterly results since 1990 and the July Congressional Budget Office forecast through 2022. Growth in the fourth quarter was exactly in line with the CBO forecast. The IMF forecasts global and national economic growth each April and October. In the October IMF update, the forecast of U.S. economic growth was revised down for each year through 2022. The 2017 growth forecast was revised from 2.31 percent down to 2.18 percent, while the 2018 forecast was adjusted from 2.52 percent down to 2.34 percent. Evidently, the IMF significantly underestimated the 2017 performance.
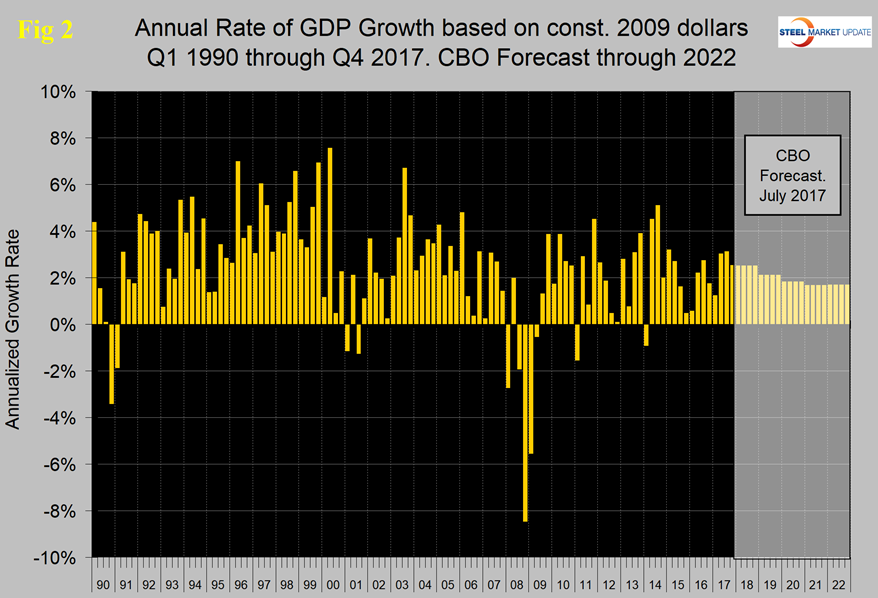
Figure 3 shows the change in the six major subcomponents of GDP in Q4 2017. Normally, personal consumption is the dominant growth driver, and this continued to be the case. Personal consumption includes goods and services, the goods portion of which includes both durable and non-durables. Inventories and the trade balance detracted from the fourth-quarter performance.
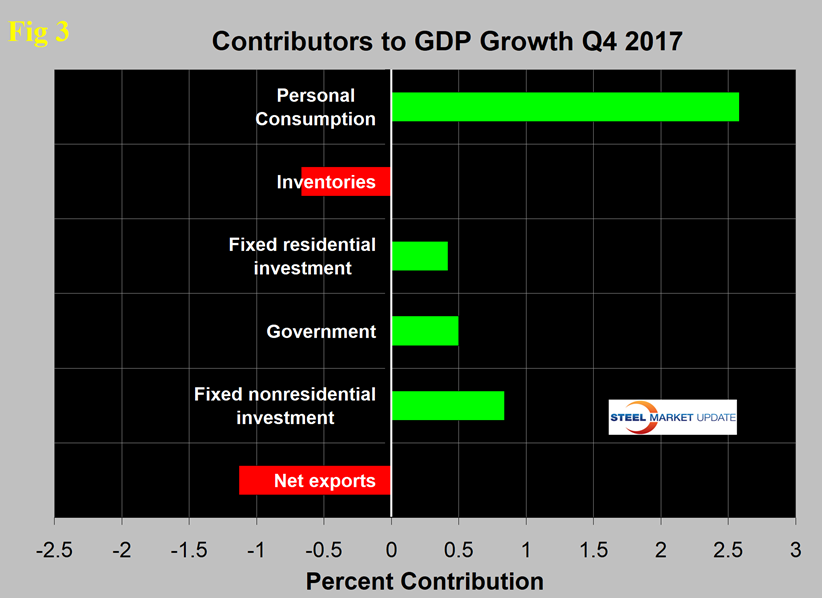
The contribution of inventories decreased from positive 0.79 percent in Q3 to negative 0.67 in Q4. Rising inventories are entered as a positive in the GDP calculation. Note that in the definitions at the end of this piece, inventories are not mentioned. Over the long run, inventory changes are a wash and simply move growth from one period to another. The contribution of personal consumption increased from 1.49 percent in Q3 to 2.58 percent in Q4. This was the best performance of personal consumption since Q3 2014. In the first three quarters of 2017, net exports made a positive contribution, influenced by the decline in the value of the dollar that continued through early September. We can expect this element of GDP growth to return to positive in the current quarter. The contribution of government expenditures was almost zero in the period Q2 2016 through Q3 2017, but made a 0.5 percent contribution in Q4.
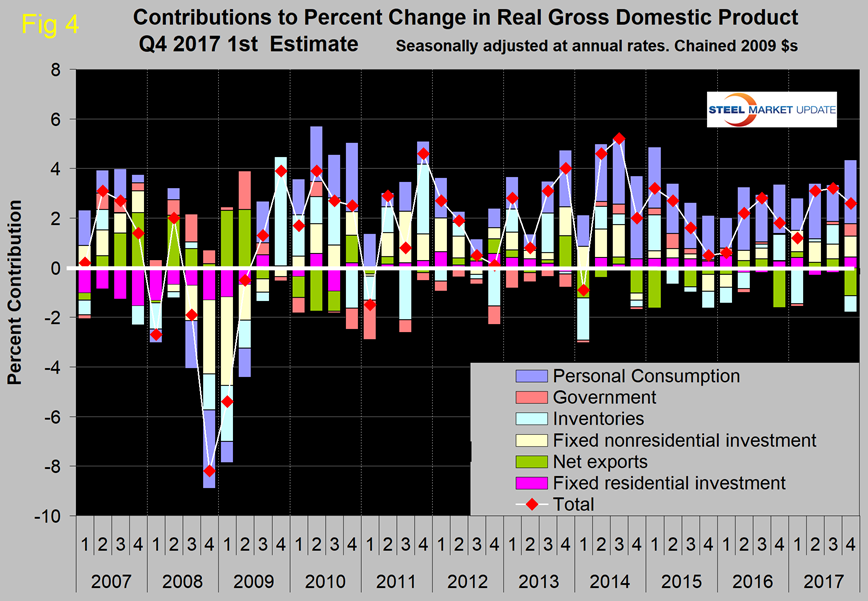
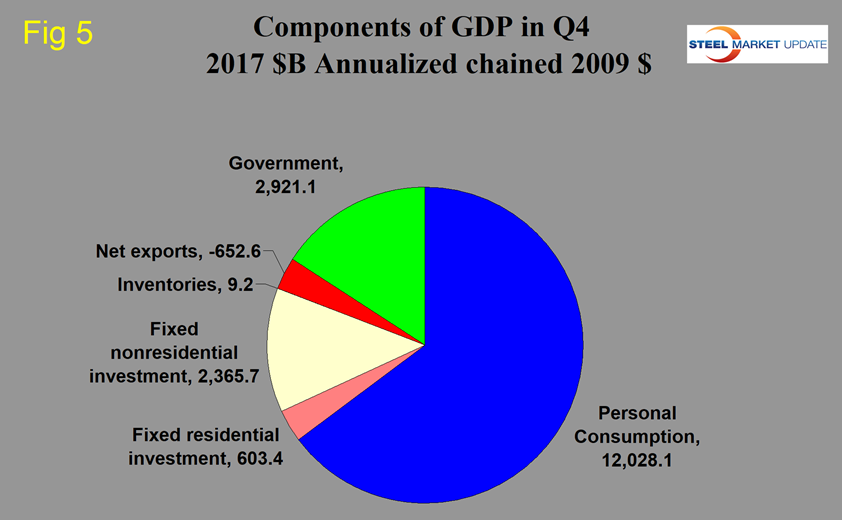
Figure 4 shows the quarterly contributors of the six major subcomponents of GDP since Q1 2007. This chart clearly shows the whipsaw effect of inventory changes. Figure 5 shows the breakdown of the $18 trillion economy.
SMU Comment: Other than inventory contribution and trade, this was a very good quarter, and we can expect the trade contribution to improve in Q1 2018. The trailing 12-month growth rate has improved for each of the last six quarters and in Q4 reached 2.50 percent. The U.S. is outperforming the IMF forecast made in October.
Definition of GDP: Gross domestic product (GDP) is the value of the goods and services produced by the nation’s economy less the value of the goods and services used up in production.
GDP is defined as Consumption (C) plus Investment (I) plus Government Spending (G) plus [Exports (E) minus Imports (I)] or: GDP = C + I + G + (E-I)
This equation is known as an identity. An identity is an equality that remains true regardless of the values of any variables that appear within it. That means it is not a guess or an approximation. It is simple reality.
National savings is GDP minus (consumption plus government spending). That means that investment equals savings plus net exports. If there are no net exports, then money must come back into the U.S. from outside the country to finance investments, along with savings.
Thus, if there is a government deficit, there must be savings by both consumers and businesses, plus capital flows from outside the country, to offset that deficit in order for there to be any money left over for investments.
Another definition of GDP states that it equals the growth in working population multiplied by their productivity.


