

Prices

February 11, 2018
SIMA Data Shows Rolled Steel Imports on the Decline
Written by Peter Wright
Total rolled steel imports declined by 15 percent in the three months through January compared to the previous three-month period, August through October. Sheet product imports declined by 17.3 percent on the same basis, according to Steel Market Update’s analysis of U.S. Department of Commerce data released Feb. 6.
The data is reported within the Steel Import Monitoring and Analysis system (SIMA), which is explained at the end of this article. All volumes in this analysis are reported in short tons. This report focuses on a three-month analysis because of the extreme variability that can occur monthly in individual products. Three-month moving averages (3MMA) offer a more accurate picture of the trends.
The 3MMA of total rolled product import volume in July 2017 was 2,722,567 short tons, the highest since May 2015. Since July, imports have declined every month, reaching 2,020,601 tons in January.
Figure 1 shows the 3MMA of semi-finished, flat and long product imports through January licenses since January 2004. Imports of semi-finished in January had a 3MMA of 544,204 tons, which was down by 0.8 percent year over year and down by 22.8 percent compared to the three months through October. “Flat” includes all hot and cold rolled sheet and strip, plus all coated sheet products, plus both discrete and coiled plate. The 3MMA of flat rolled imports was 944,321 tons in January, which was down by 15.3 percent year over year and by 15.9 percent compared to three months through October. Long product imports were range bound between 519,000 tons and 772,000 tons for 34 months between January 2014 and August 2017 with no trend evident. In September 2017, long product imports broke out of the range to the downside and stayed down through January when the volume was 419,615 tons. Year over year, longs were down by 22.4 percent.
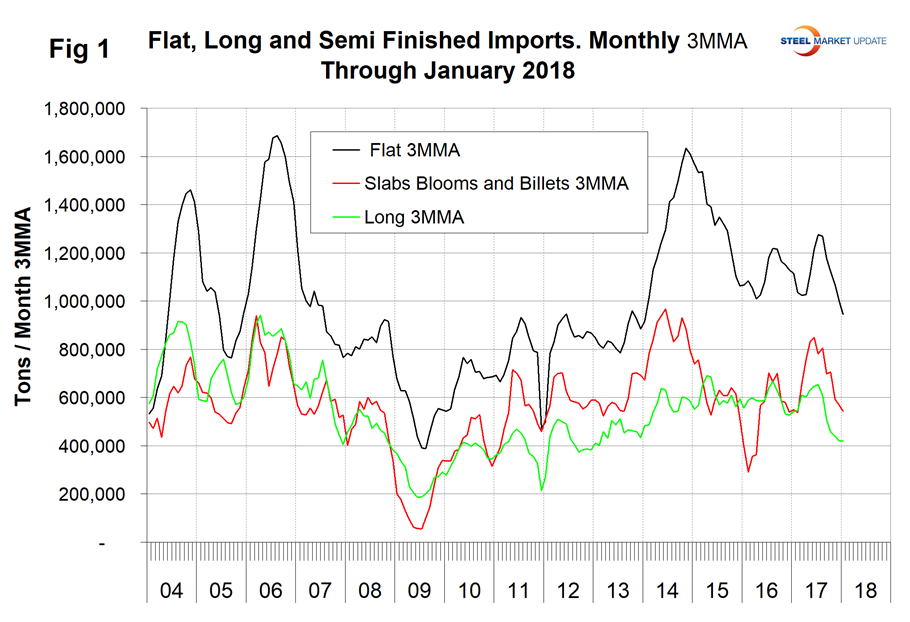
Figure 2 shows the trend of sheet and strip product imports since January 2004. The total of these products declined by 17.3 percent in three months through January compared to three months through October and down by 17.0 percent year over year. All six of the sheet categories that we examine except hot rolled coil were down year over year led by other metallic coated, (mainly Galvalume) down 34.1 percent. On this basis, HRC was up by 3.8 percent. On a three-month comparison, all six were down in January compared to October.
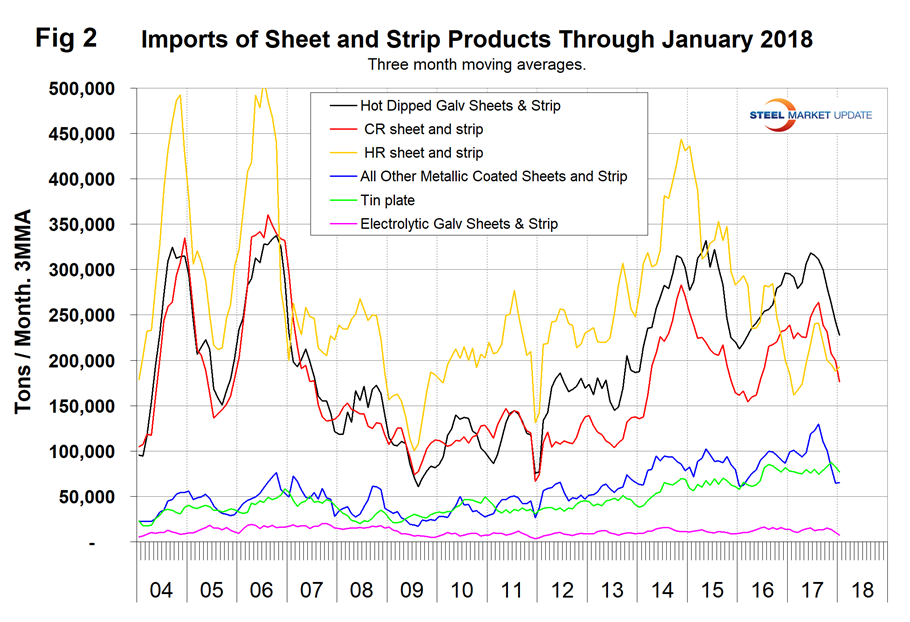
Table 1 provides an analysis of major product groups and of sheet products in detail. It compares the average monthly tonnage in the three months through January 2018 with both three months through October (3M/3M) and the three months through January 2017 (Y/Y). Of note is that tubular products were up by 46.0 percent year over year.
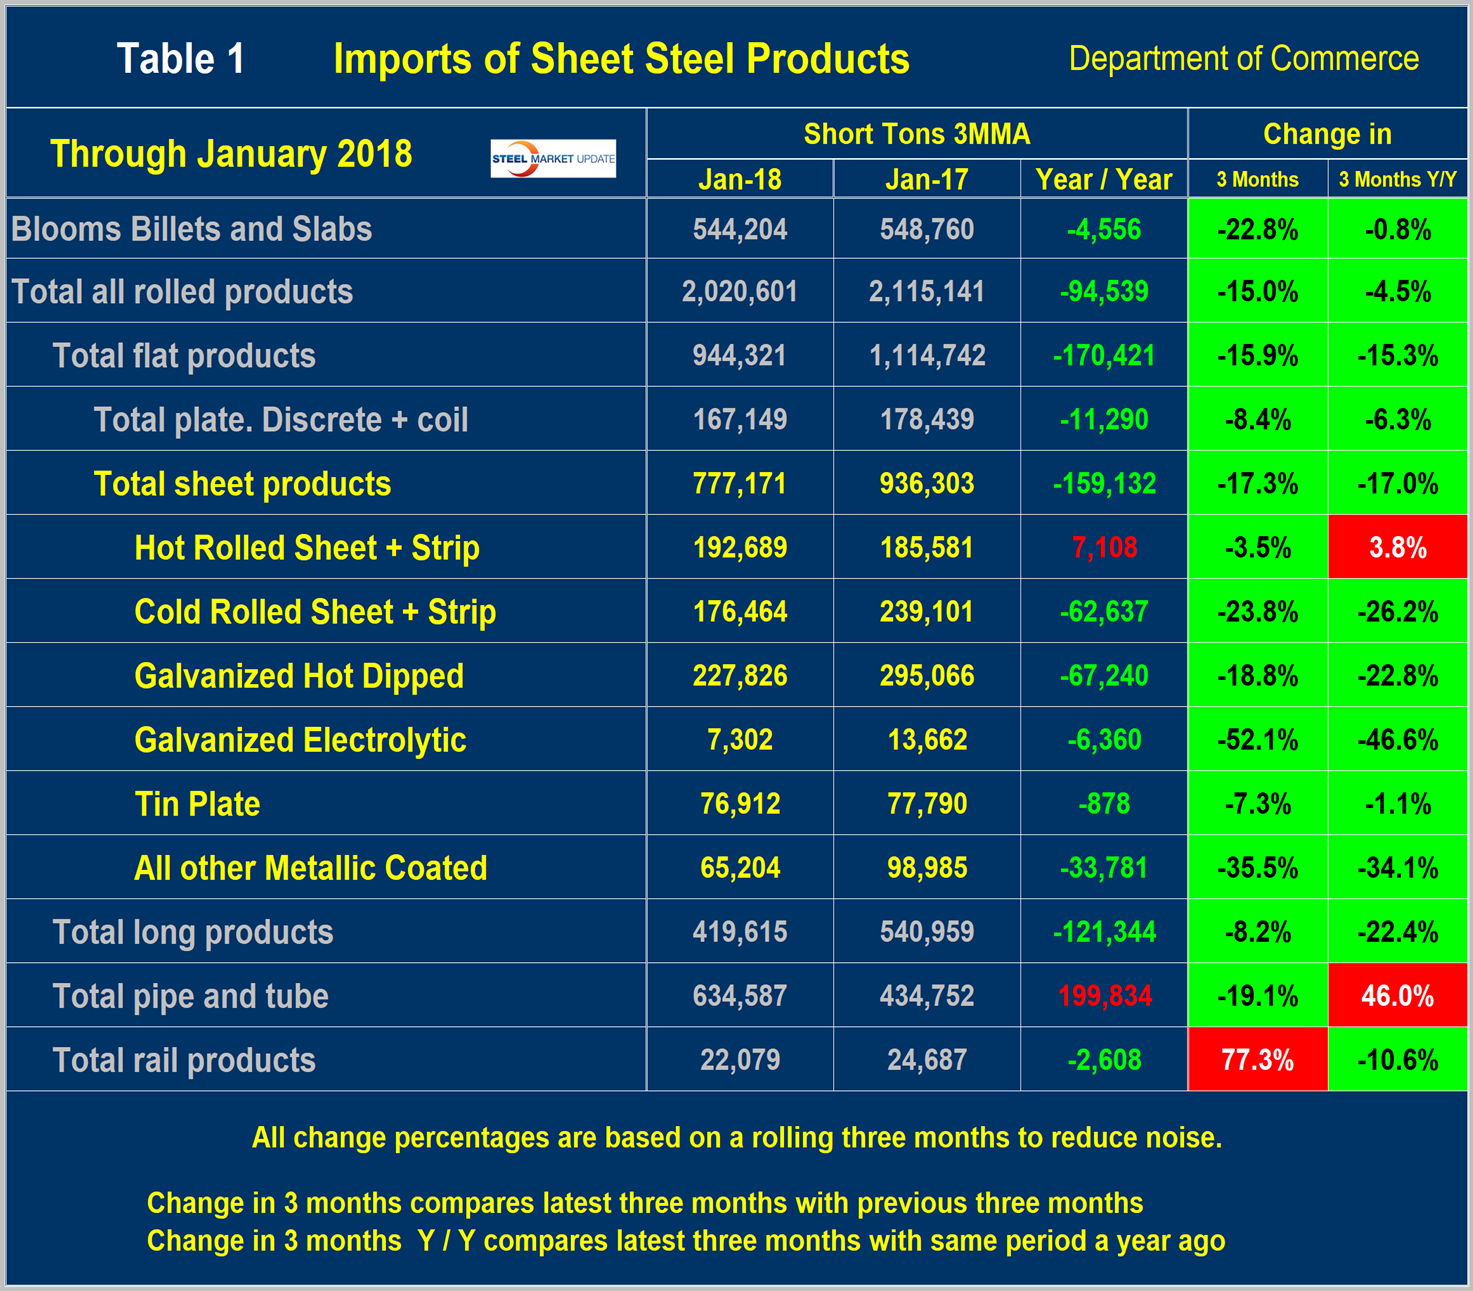
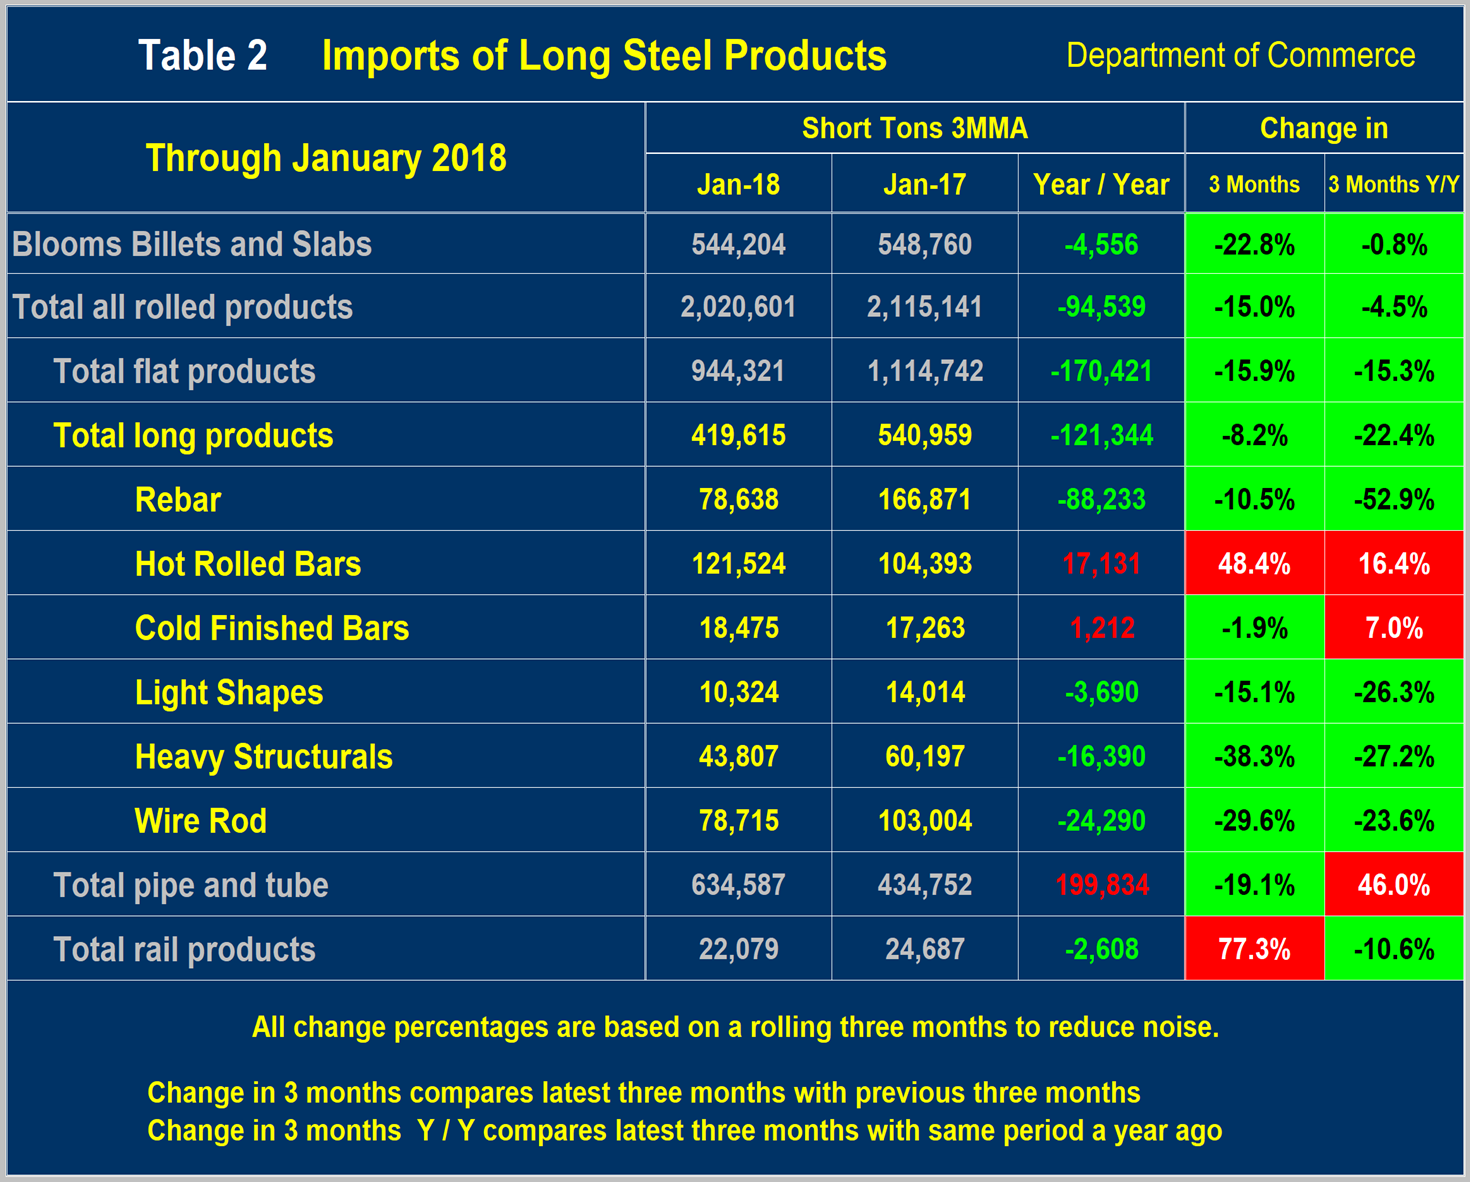
Table 2 shows the same analysis for long products. The total tonnage of long products was down by 121,344 tons per month year over year, mainly driven by a decline in rebar volume. On a 3M/3M basis, the total volume of long products declined by 8.2 percent.
Explanation: Steel Market Update publishes several import reports ranging from this very early look using license data to the very detailed analysis of final volumes by product, by district of entry and by source nation, which is available on the premium member section of our website. The early look, the latest of which you are reading now, has been based on three-month moving averages using the latest license data, either the preliminary or final data for the previous month and final data for earlier months. We recognize that the license data is subject to revisions but believe that by combining it with earlier months in this way gives a reasonably accurate assessment of volume trends by product as early as possible. We are more interested in direction than we are in absolute volumes at this stage. The main issue with the license data is that the month in which the tonnage arrives is not always the same month in which the license was recorded. In 2014, we conducted a 12-month analysis to evaluate the accuracy of the license data compared to final receipts. This analysis showed that the licensed tonnage of all carbon and low alloy products was 2.3 percent less than actual receipts, close enough we believe to confidently include license data in this current update. The discrepancy declined continuously during the 12-month evaluation as a longer period was considered.
Statement from the Department of Commerce: The Steel Import Monitoring and Analysis (SIMA) system of the Department of Commerce collects and publishes data of steel mill product imports. By design, this information gives stakeholders valuable information on steel trade with the United States. This is achieved through two tools: the steel licensing program and the steel import monitor. All steel mill imports into the United States require a license issued by the SIMA office. The SIMA Licensing System is an online automatic system for users to register, apply for and receive licenses in a quick and timely manner. This online system allows importers to process imports with minimal effort and added efficiency. In addition to managing the licensing system, SIMA publishes near-real-time aggregate data on steel mill imports into the United States. These data incorporate information collected from steel license applications and publicly released Census data. The data are displayed in tables and graphs for users to analyze various levels and changes in steel trade involving the United States. Additionally, SIMA provides data on U.S. steel mill exports, as well as imports and exports of select downstream steel products.


