

Market Data

February 28, 2018
Key Market Indicators Even More Positive in February
Written by Peter Wright
Key market indicators, and the trends they reveal, are the best they have ever been in Steel Market Update’s analysis. Data released in February shows that 18 of the 36 indicators are historically positive with only six negative. The balance is within the band of historically normal. Trends improved with 32 of the indicators heading in a positive direction, up from 22 in October and from 30 in January. Trends lead the present situation by about four months.
See the end of this piece for an explanation of the Key Indicators concept. This will explain the difference between our view of the present situation, which is subjective, and our analysis of trends, which is based on the latest facts available.
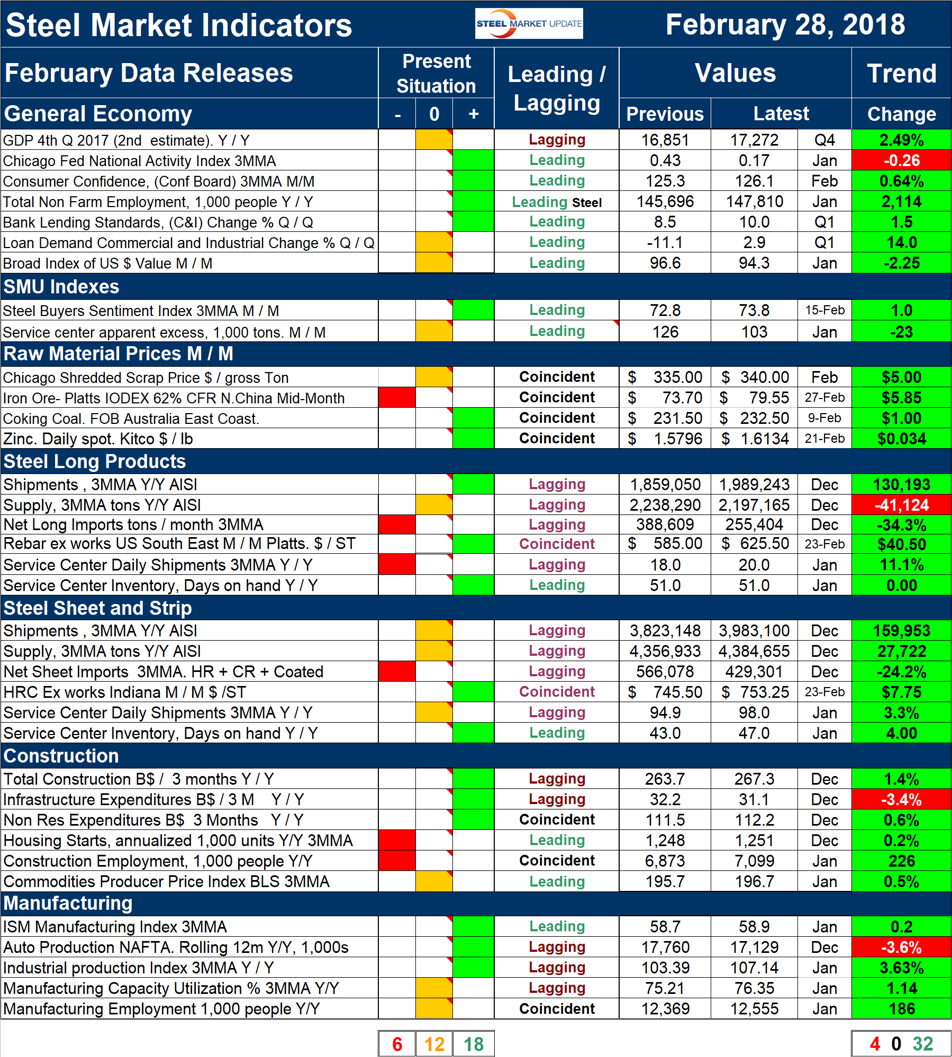
Please refer to the table below for our view of the present situation and the quantitative measure of trends. Readers should regard the color codes in the present situation column as a visual summary of the current market condition. The “Trend” columns of Table 1 are also color coded to give a quick visual appreciation of the direction the market is headed. All data included in this table was released in February. The month or specific date to which the data refers is shown in the second column from the far right. All results are the latest available as of Feb. 28, 2018.
Present Situation
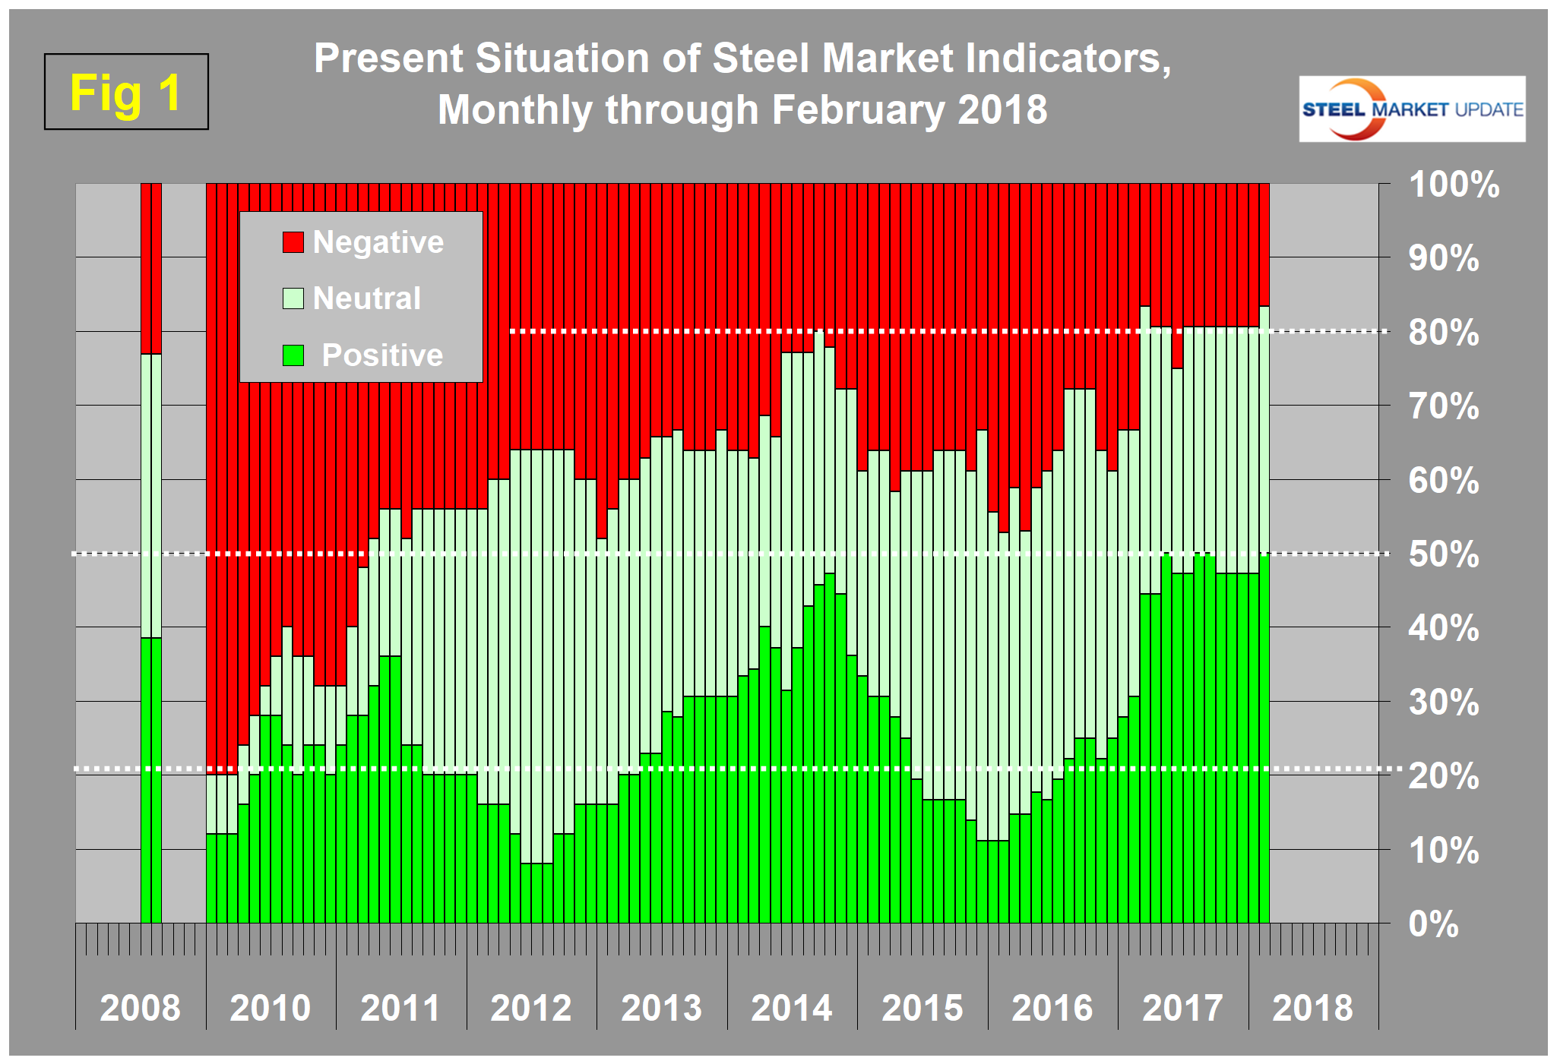
There was a net increase of one positive and a decrease of one negative in our perception of the balance of indicators in February. We currently view 18 of the 36 indicators as positive, 12 as neutral and six as negative. Our intent in using the word neutral is to say that this indicator is in the mid-range of historical data. Figure 1 shows our monthly assessment of the present situation since February 2010 on a percentage basis. There has only been one other occasion when the number of negative indicators was as low, March 2017.
In February, there were several changes to the individual indicators. Demand for commercial and industrial loans was reclassified from negative to neutral based on the Federal Reserve Senior Loan Officer survey and banks’ easing of lending standards. There were no changes to either the SMU proprietary indices or to our view of raw materials prices. In the steel long products section, apparent supply, which is a proxy for demand, was reclassified from positive to neutral. There were no changes to our perception of the sheet market or to the construction and manufacturing sectors.
Trends
Most values in the trends columns are three-month moving averages (3MMA) to smooth out what can be very erratic monthly data. Trend changes in the individual sectors since the end of January data are described below together with some general comments. (Please note in most cases this is not February data but data that was released in February for previous months.)
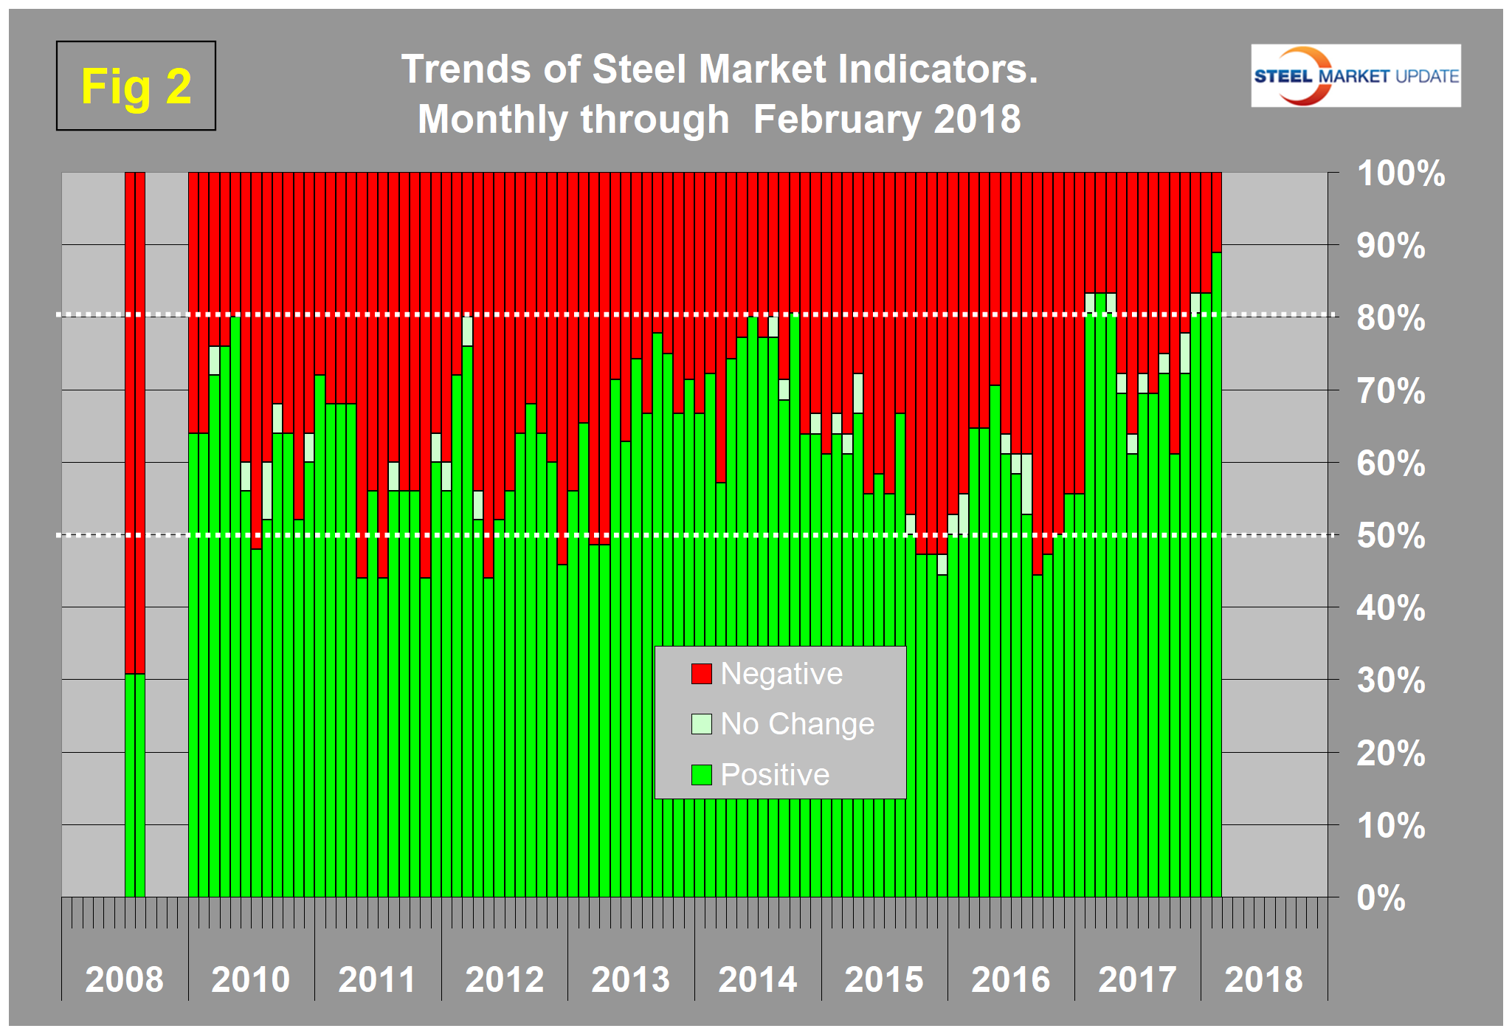
Figure 2 shows the trend of the trends and the pre-recession situation at the far left of the chart. The proportion of trends that are improving is now 88.9 percent of the 36 indicators. This is the highest since this analysis was first performed in January 2010.
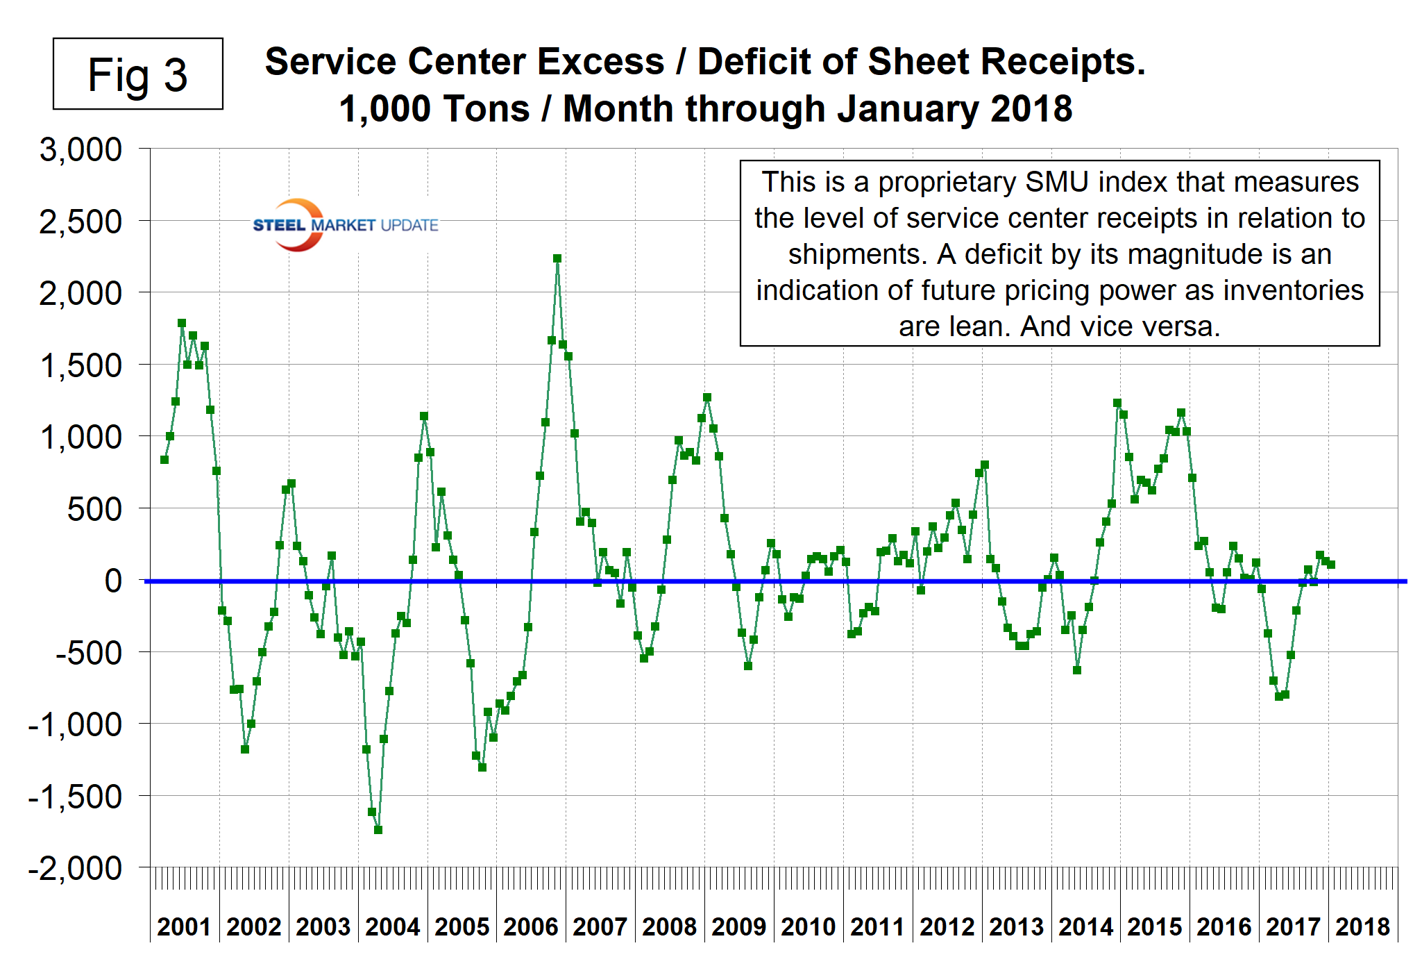
Our observations about trends in the February data are as follows: The second estimate of the growth of GDP was released Feb. 28 and at positive 2.49 percent was almost unchanged from the first estimate. In the General Economy section of Table 1, there was one trend reversal when data from The Conference Board released yesterday showed a positive surge in the February data. There were no trend reversals in the SMU proprietary indexes section. Service center excess of sheet products declined slightly in the January data. We regard an inventory deficit to be positive in terms of pricing power. In January, the surplus declined from 126,000 tons to 103,000 tons (Figure 3). Historically, this is very close to zero, therefore we are presently in a situation of negotiation neutrality.
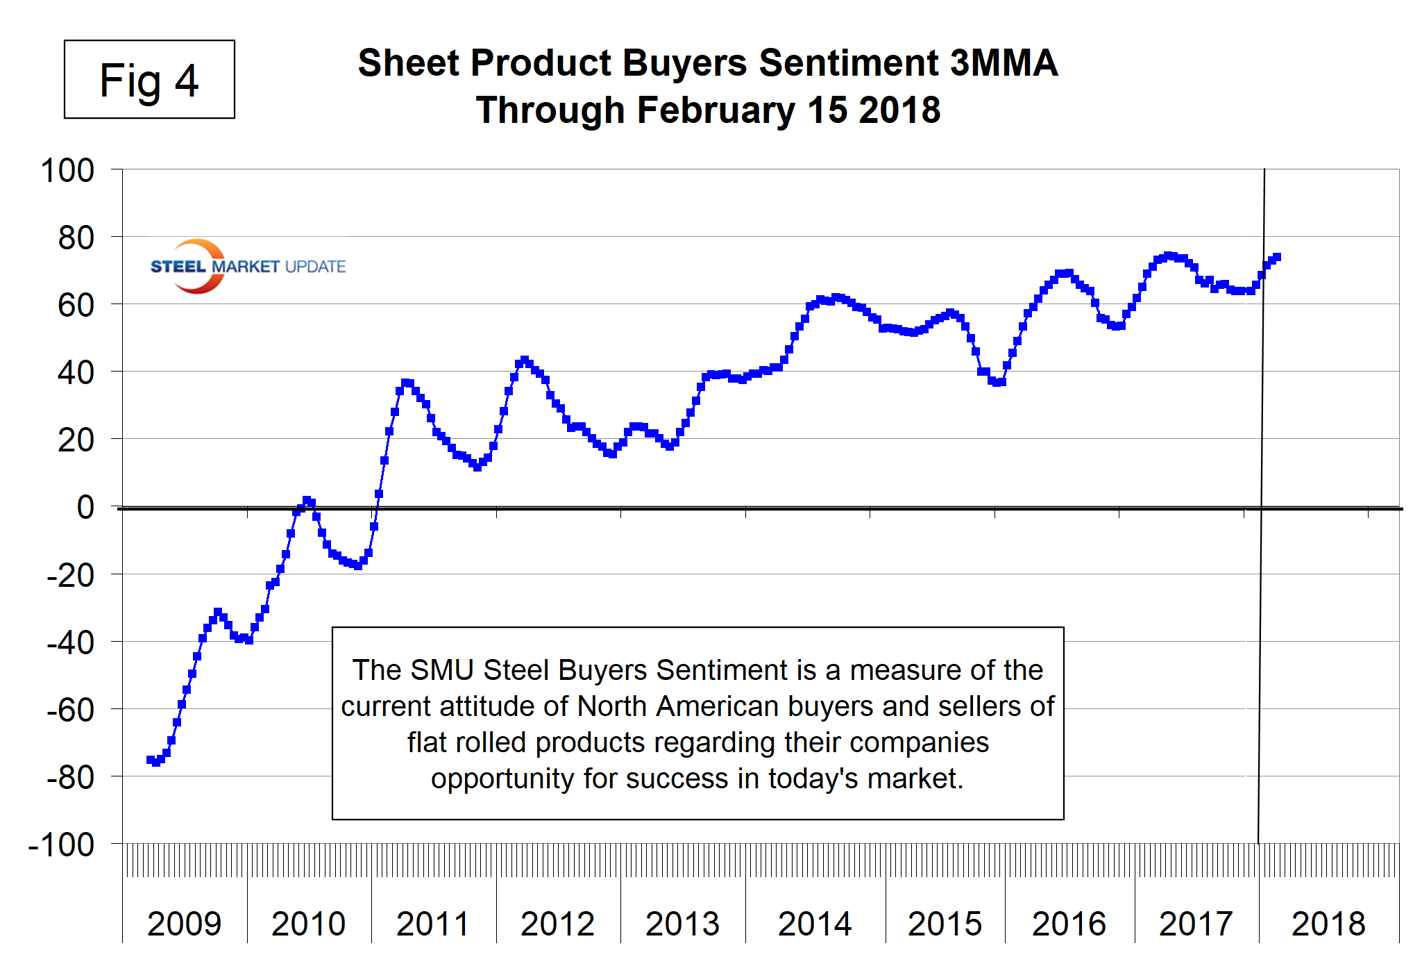
Steel buyers’ sentiment continued to strengthen through mid-February after reversing direction in December. The sentiment index was 73.83 on Feb. 15, close to its all-time high of 74.17 at the end of March last year (Figure 4).
There was one trend reversal in raw materials prices in February. The price of iron ore was up by $4.15 per dmt after declining by 25 cents in January. All raw materials prices are now trending positive. We regard rising raw materials prices as positive and indicative of a strengthening market.
In the long steel products sector, apparent supply reversed direction and trended negative year over year driven by the performance of both heavy and light structural products. The price of rebar was unchanged in December, but continued its upward trajectory in January and February. In the sheet sector, all indicators are trending positive, which was a continuation of the December and January situation. In the construction sector, there were no trend reversals. Five of the six indicators are trending positive. The only negative continues to be infrastructure expenditures, which have trended negative every month since February 2017. In the manufacturing sector, the ISM index reversed direction and trended positive. Four of the five manufacturing indicators are trending positive, the only exception being auto production in NAFTA
We believe a continued examination of both the present situation and direction is a valuable tool for corporate business planning.
Explanation: The point of this analysis is to give both a quick visual appreciation of the market situation and a detailed description for those who want to dig deeper. It describes where we are now and the direction the market is headed and is designed to describe the situation on a specific date. The chart is stacked vertically to separate the primary indicators of the general economy, of proprietary Steel Market Update indices, of raw material prices, of both sheet and long product market indicators, and of construction and manufacturing indicators. The indicators are classified as leading, coincident or lagging as shown in the third column.
Columns in the chart are designed to differentiate between where the market is today and the direction it is pointing. Our evaluation of the present situation is subjectively based on our opinion of the historical value of each indicator. There is nothing subjective about the trends section, which provides the latest facts available on the date of publication. It is quite possible for the present situation to be predominantly red and trends to be predominantly green or vice versa depending on the overall situation and direction of the market. The present situation is subdivided into, below the historical norm (-), (OK), and above the historical norm (+). The “Values” section of the chart is a quantitative definition of the market’s direction. In most cases, values are three-month moving averages to eliminate noise. In cases where seasonality is an issue, the evaluation of market direction is made on a year-over-year comparison to eliminate this effect. Where seasonality is not an issue, concurrent periods are compared. The date of the latest data is identified in the third values column. Values will always be current as of the date of publication. Finally, the far-right column quantifies the trend as a percentage or numerical change with color code classification to indicate positive or negative direction.


