

Product

March 1, 2018
January Construction Spending Up 2.9 Percent
Written by Peter Wright
The growth of total construction on a rolling 12-month basis year over year has slowed every month from January 2017 through January 2018. On a rolling three-month year-over-year basis, the situation is better, with growth improving every month from September through January. Hopefully, this trend will continue. Construction expenditures data is developed by the Department of Commerce and is referred to as CPIP (construction put in place). Since construction is extremely seasonal, the growth or contraction we report in this analysis has had seasonality removed by providing only year-over-year comparisons.
![]() At SMU, we analyze the CPIP data with the intent to provide a clear description of activity we believe accounts for about 45 percent of total U.S. steel consumption. See the end of this report for more detail on how we perform this analysis and structure the data. In particular, note that we present non-seasonally adjusted numbers. Much of what you will see in the press may differ from our presentation because others base their comments on adjusted values. Our rationale is that construction is highly seasonal and our businesses function in a seasonal world. Also, we don’t understand how the adjustments are made, nor do we trust them.
At SMU, we analyze the CPIP data with the intent to provide a clear description of activity we believe accounts for about 45 percent of total U.S. steel consumption. See the end of this report for more detail on how we perform this analysis and structure the data. In particular, note that we present non-seasonally adjusted numbers. Much of what you will see in the press may differ from our presentation because others base their comments on adjusted values. Our rationale is that construction is highly seasonal and our businesses function in a seasonal world. Also, we don’t understand how the adjustments are made, nor do we trust them.
Total Construction
Total construction expanded by 2.9 percent in three months through January year over year, which was up from 2.0 percent in three months through December. Growth on a rolling three-month basis slowed from 7.5 percent in January 2017 to 0.5 percent in August 2017, which was the month with lowest growth since November 2011. On a rolling 12-month basis year over year, growth in January was 2.0 percent. Since the three-month growth rate is higher than the 12-month rate, we conclude that the rate of growth is improving. We describe this as positive momentum. January construction expenditures totaled $76.2 billion, which breaks down to $57.2 billion of private work, $16.8 billion of state and locally funded (S&L) work, and $2.2 billion of federally funded work (Table 1). Growth trend columns in all four tables in this report show momentum.
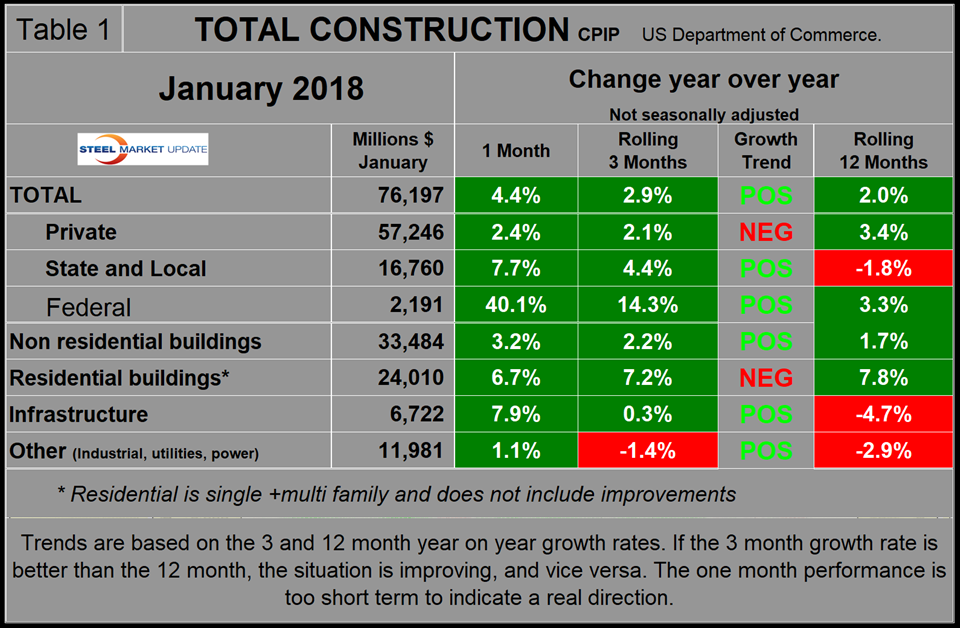
Figure 1 shows total construction expenditures on a rolling 12-month basis as the blue line and the rolling three-month year-over-year growth rate as the brown bars.
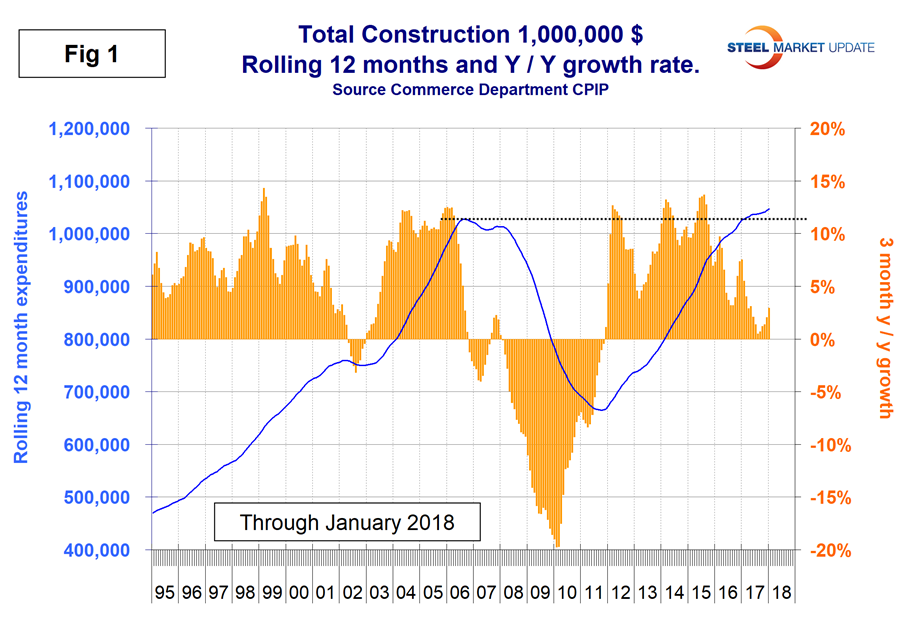
Figures 1 through 4 in this analysis have the same format, the result of which is to smooth out variation and eliminate seasonality. We consider four sectors within total construction. These are nonresidential, residential, infrastructure and other. The latter is a catchall and includes industrial, utilities and power. Of these four sectors, only residential buildings had negative momentum in the January data.
The pre-recession peak of total construction on a rolling 12-month basis was $1.028 trillion through November 2006. The low point was $665.1 billion in the 12 months through April 2011. In 12 months through January 2018, construction expenditures totaled $1.047 trillion. (This number excludes residential improvements, see explanation below.)
Private Construction
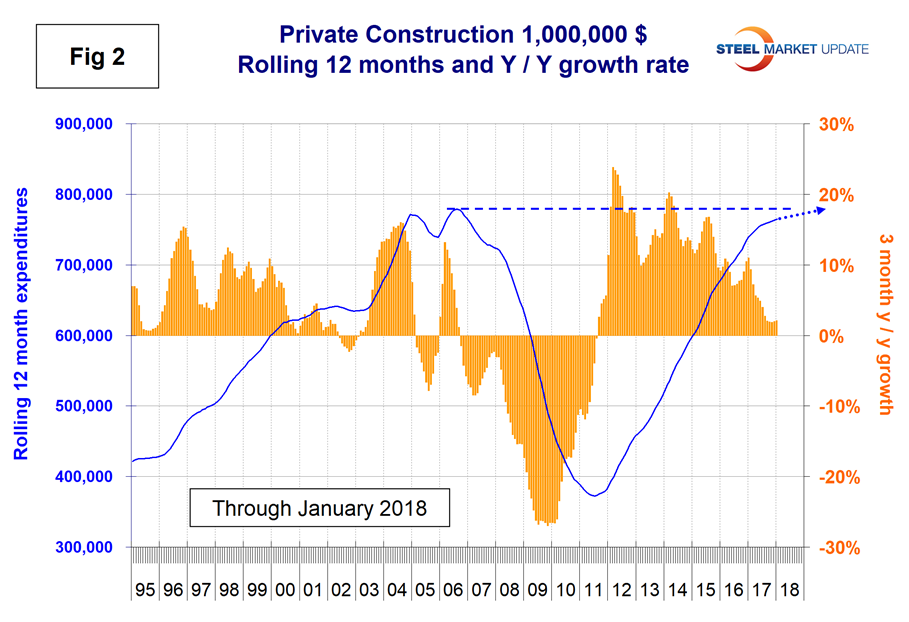
Table 2 shows the breakdown of private expenditures into residential and nonresidential and subsectors of both. The growth rate of private construction in three months through January 2018 was 2.1 percent, up slightly from 2.0 percent in the three months through December 2017 as shown by the brown bars in Figure 2. At the present rate, private construction will reach the pre-recession rate of expenditures by about the end of this year.
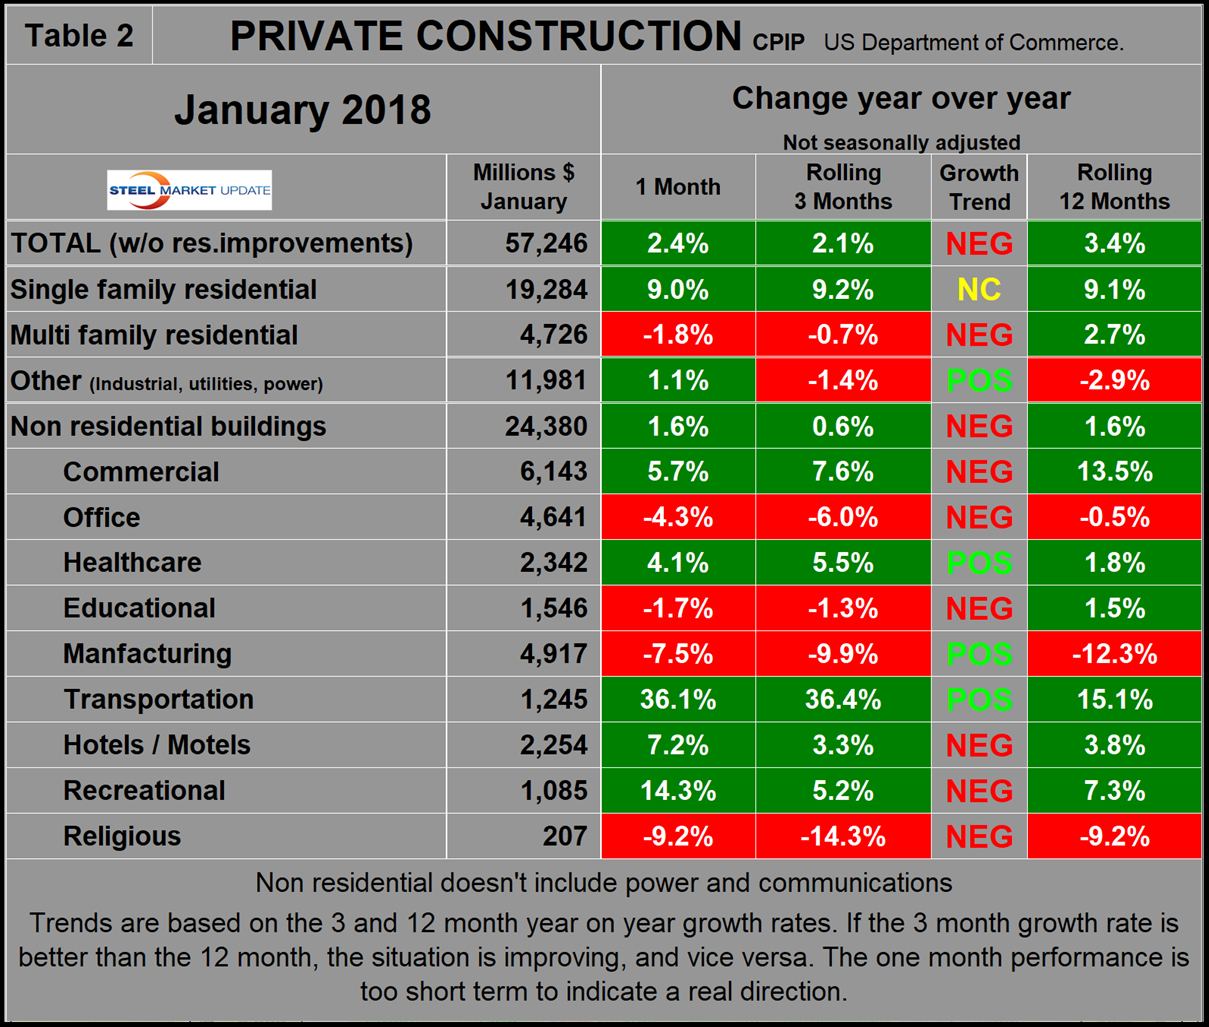
Excluding property improvements, our report shows that single-family residential grew by 9.2 percent in three months through January with positive momentum and multifamily residential contracted by 0.7 percent with negative momentum. Homebuilder sentiment is high meaning that companies are expecting a strong 2018. The NAHB housing market index had the highest three-month moving average in January than at any time since our data stream began in January 2009. In our view, the 2018 tax legislation and rising interest rates puts single-family home construction in jeopardy. The Census Bureau reports on construction starts in their housing analysis. In the starts data, the whole project is entered into the database when ground is broken. Construction put in place is based on spending work as it occurs; the value of a project is spread out from the project’s start to its completion. Single-family starts grew at 7.8 percent in the three months through January, which was close to the growth rate of CPIP suggesting that housing will be flat in the near future. Multifamily starts expanded by 6.9 percent in January, which was much better than the small contraction of CPIP suggesting that multi-family will have resurgence in the coming months.
Within private nonresidential buildings, healthcare, manufacturing and transportation terminals had positive momentum, but all the other sectors are slowing. The first quarter Federal Reserve Senior Loan Officer Survey indicated there is currently a net decrease in demand for construction and land development loans and that loan terms are tightening. The Fed survey reviews changes in the terms of, and demand for, bank loans to businesses on a quarterly basis based on the responses from 73 domestic banks and 24 U.S. branches and agencies of foreign banks.
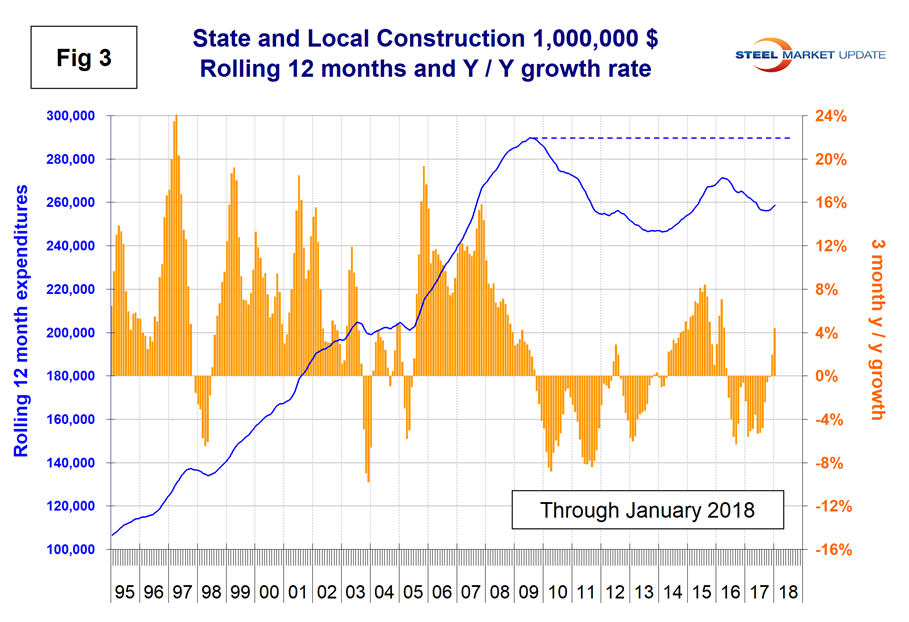
State and Local Construction
S&L work expanded by 4.4 percent in the rolling three months through January year over year with positive momentum. However, December and January were the first months with positive growth since May 2016 (Table 3). The improvement was driven by nonresidential buildings. The overall S&L figure includes both nonresidential buildings and infrastructure. Figure 3 shows growth as the brown bars and the rolling 12-month expenditures as the blue line. Nonresidential buildings expanded by 6.8 percent in three months through January, which was the best result since September 2015. Total S&L nonresidential buildings slumped in the period May 2016 through September 2017, therefore our year-over-year comparisons will probably look good for the next few months. Educational buildings are by far the largest subsector of S&L nonresidential at $5.0 billion in January and experienced a 6.9 percent positive growth on a rolling three months basis with positive momentum.
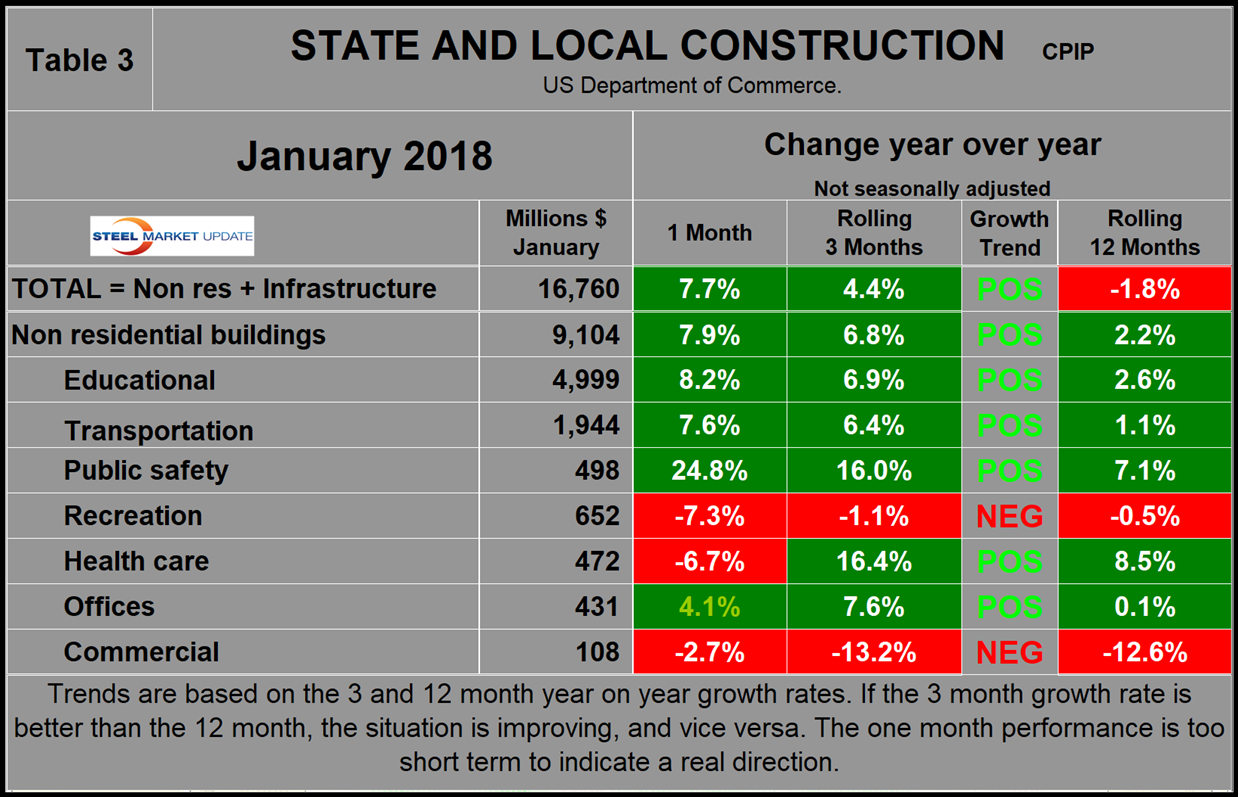
Comparing Figures 2 and 3, S&L construction did not have as severe a decline as private work during the recession and private work bounced back faster. The downturn in S&L (including infrastructure) means that a full recovery to the pre-recession level of expenditures won’t be achieved until well into the next decade.
Drilling down into the private and S&L sectors as presented in Tables 2 and 3 shows which project types should be targeted for steel sales and which should be avoided. There are also regional differences to be considered, data for which is not available from the Commerce Department.
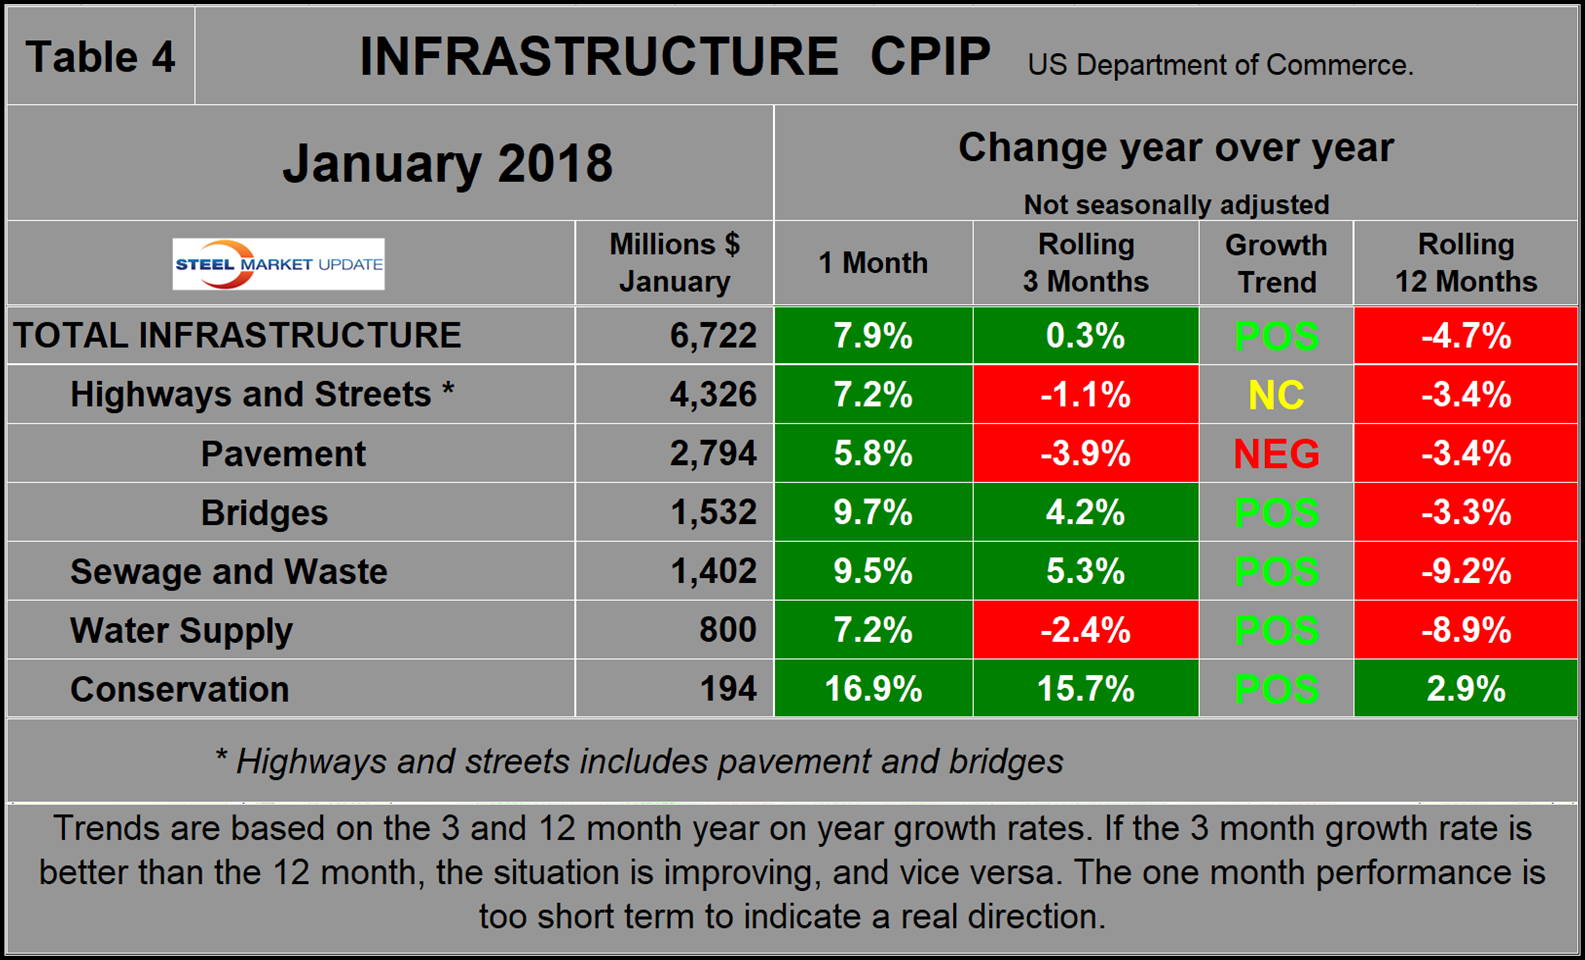
Infrastructure
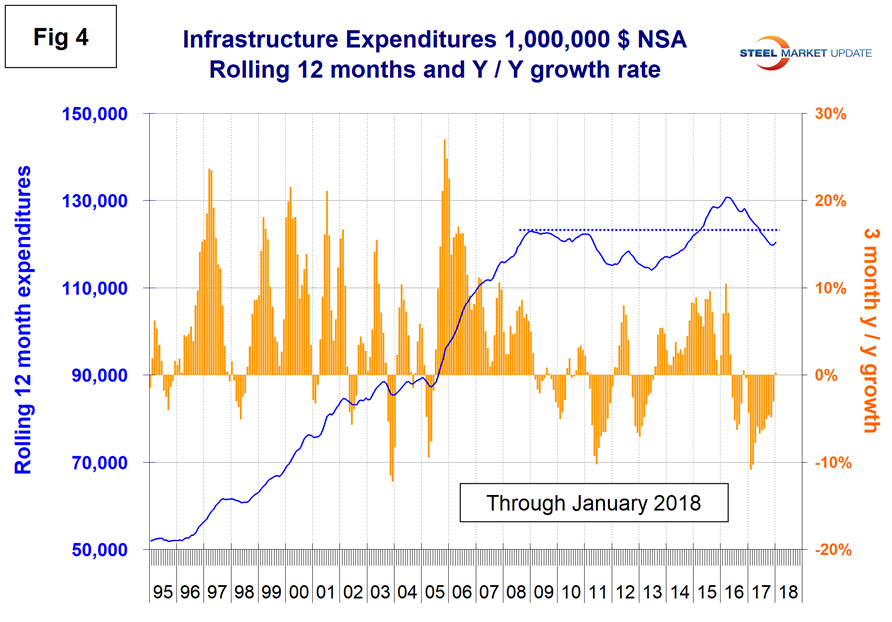
Infrastructure expenditures had positive growth in the first eight months of 2016, then declined every month through December 2017. January 2018 had a small 0.3 percent positive growth. Highways and streets including pavement and bridges account for about two-thirds of total infrastructure expenditures. Highway pavement is the main subcomponent of highways and streets and had a 3.9 percent contraction in three months through January. Bridge work expanded by 4.2 percent breaking a 21-month string of contractions (Table 4).
Infrastructure expenditures peaked in the rolling 12 months through April 2016 and have since declined to a level lower than the previous peak in January 2009 (Figure 4).
On Feb. 14, Moody’s Analytics wrote that they do not expect the infrastructure plan to pass in Congress. Fiscal hawks in the GOP have had to stomach higher deficits under the new tax law and the two-year budget deal. As a result, they will balk at a further increase in the deficit to fund infrastructure. Additionally, Democrats have criticized the plan for what they see as an overdependence on state and local government and private sector spending. They will likely bristle at the proposed changes to the environmental review process, as well. The political cost to Trump from not getting an infrastructure bill done is much less than the long-term cost to the economy from policymakers sticking to the status quo on funding infrastructure. The reality is that the cost of expanding and maintaining the nation’s infrastructure is increasing faster than the revenue streams devoted to them. Moreover, state and local governments are struggling to set aside increased discretionary spending on infrastructure because of rising mandatory pressures from Medicaid and pensions. As a result, government investment in structures as a share of GDP is at record lows.
Total Building Construction Including Residential
Figure 5 compares year-to-date expenditures for building construction for 2017 and 2018. Single-family residential is dominant and in the 12 months of 2017 totaled $264.5 billion, up from $242.5 billion in 2016. It seems likely that the 2018 tax bill, by its reduction in the deductibility of mortgage interest and local taxes, will negatively affect single-family home construction.
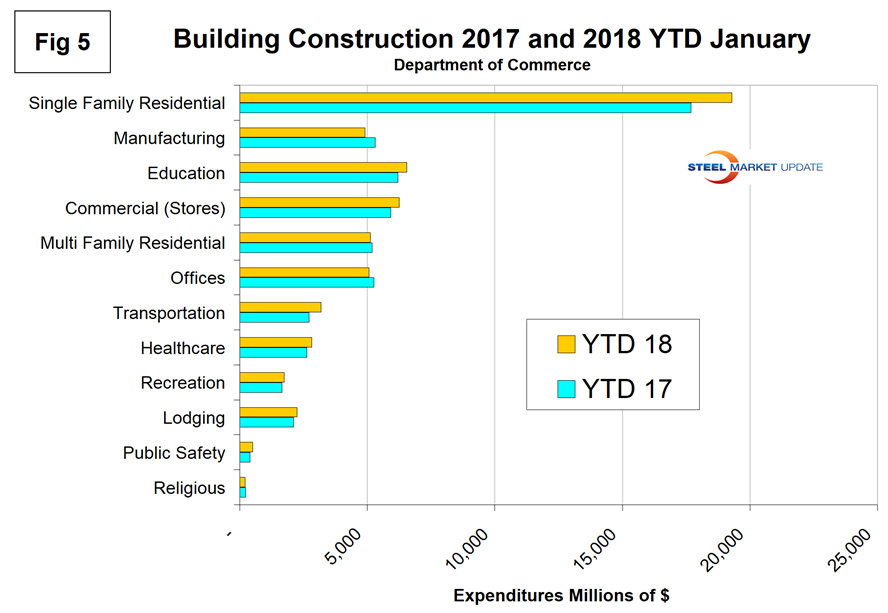
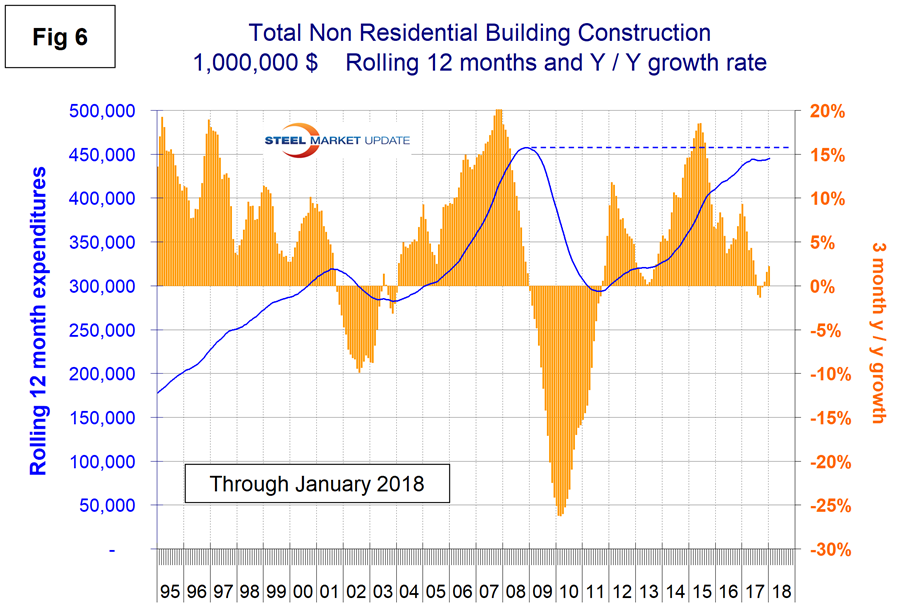
Figure 6 shows total expenditures and growth of nonresidential building construction. Growth slowed in January through July last year, went negative in August through October, then became increasingly positive in November through January 2018.
Explanation: Each month, the Commerce Department issues its construction put in place (CPIP) data, usually on the first working day covering activity one month and one day earlier. Construction put in place is based on spending work as it occurs, estimated for a given month from a sample of projects. In effect, the value of a project is spread out from the project’s start to its completion. This is different from the starts data published by the Census Bureau for residential construction, by Dodge Data & Analytics and Reed Construction for nonresidential, and Industrial Information Resources for industrial construction. In the case of starts data, the whole project is entered to the data base when ground is broken. The result is that the starts data can be very spiky, which is not the case with CPIP.
The official CPIP press release gives no appreciation of trends on a historical basis and merely compares the current month with the previous one on a seasonally adjusted basis. The background data is provided as both seasonally adjusted and non-adjusted. The detail is hidden in the published tables, which SMU tracks and dissects to provide a long-term perspective. Our intent is to provide a route map for those subscribers who are dependent on this industry to “follow the money.” This is a very broad and complex subject, therefore to make this monthly write-up more comprehensible, we are keeping the information format as consistent as possible. In our opinion, the absolute value of the dollar expenditures presented are of little interest. What we are after is the magnitude of growth or contraction of the various sectors. In the SMU analysis, we consider only the non-seasonally adjusted data. We eliminate seasonal effects by comparing rolling three-month expenditures year over year. CPIP data also includes the category of residential improvements, which we have removed from our analysis because such expenditures are minor consumers of steel.
In the four tables included in this analysis, we present the non-seasonally adjusted expenditures for the most recent data release. Growth rates presented are all year over year and are the rate for the single month’s result, the rolling three months and the rolling 12 months. We ignore the single-month year-over-year result in our write-ups because these numbers are preliminary and can contain too much noise. The growth trend columns indicate momentum. If the rolling three-month growth rate is stronger than the rolling 12 months, we define that as positive momentum, or vice versa. In the text, when we refer to growth rate, we are describing the rolling three-month year-over-year rate. In Figures 1 through 4 and 6, the blue lines represent the rolling 12-month expenditures and the brown bars represent the rolling three-month year-over-year growth rates.


