

Market Data

March 22, 2018
SMU Currency Analysis: Dollar Showing Some Strength
Written by Peter Wright
The value of the U.S. dollar has strengthened in the last six weeks, though it remains down for the year. So far in 2018, the dollar has weakened by 8.1 percent, after a turnaround of 2.9 percent from Feb. 2 to March 16.
Please see the end of this report for an explanation of data sources. The analysis of currency trends is a highly technical undertaking. Therefore, in this monthly SMU update, we sometimes incorporate the opinions of other analysts to add color to our own data analysis.
The Washington Post reported on Wednesday: “The Federal Reserve lifted its key interest rate from 1.5 percent to 1.75 percent today, the highest level since 2008. The move, the central bank’s first major decision under new Chairman Jerome H. Powell, was widely expected as the U.S. economy continues to strengthen, and stock markets remain near record highs. The Fed also significantly boosted its forecast for U.S. growth this year and next. The U.S. economy is on track to expand 2.7 percent this year and 2.4 percent in 2019, Fed officials now say, a jump from the prior projection done before the Republican tax cuts were finalized.”
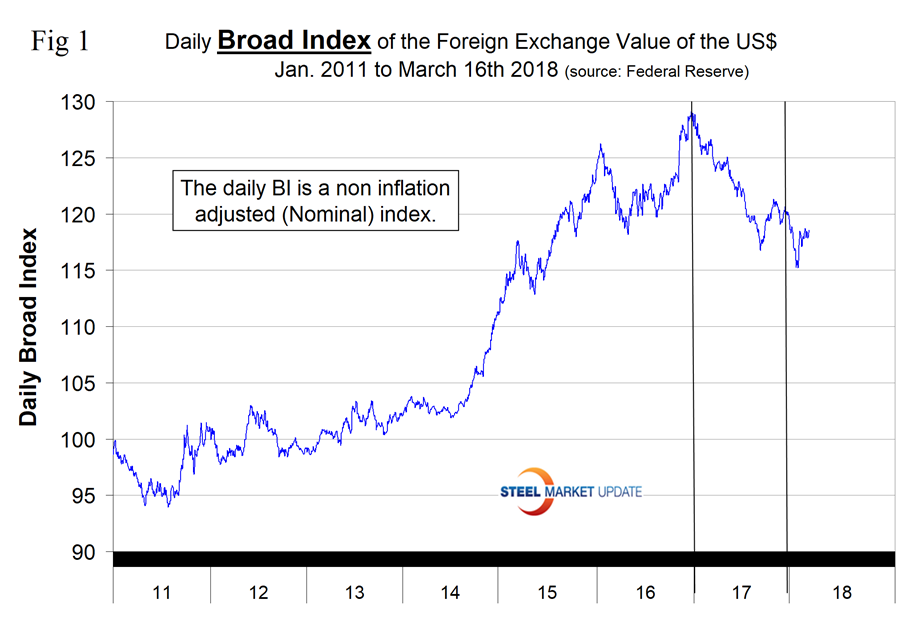
The Broad Index value of the U.S. dollar is reported several days in arrears by the Federal Reserve; the latest value published was for March 16. Figure 1 shows the index value since January 2011. The dollar had a recent peak of 128.96 on Jan. 3, 2017, which was the highest value in almost 15 years. The recent low point was Feb. 1, 2018, at 115.21. Since then, the dollar has recovered by 2.9 percent to 118.57 on March 16. The dollar has declined by 8.1 percent since Jan. 3, 2018.
Each month, SMU publishes an update of Table 1, which shows the value of the U.S. dollar against the currencies of 16 major global steel and iron ore trading nations. The table shows the change in value in one year, three months, one month and seven days through March 20.
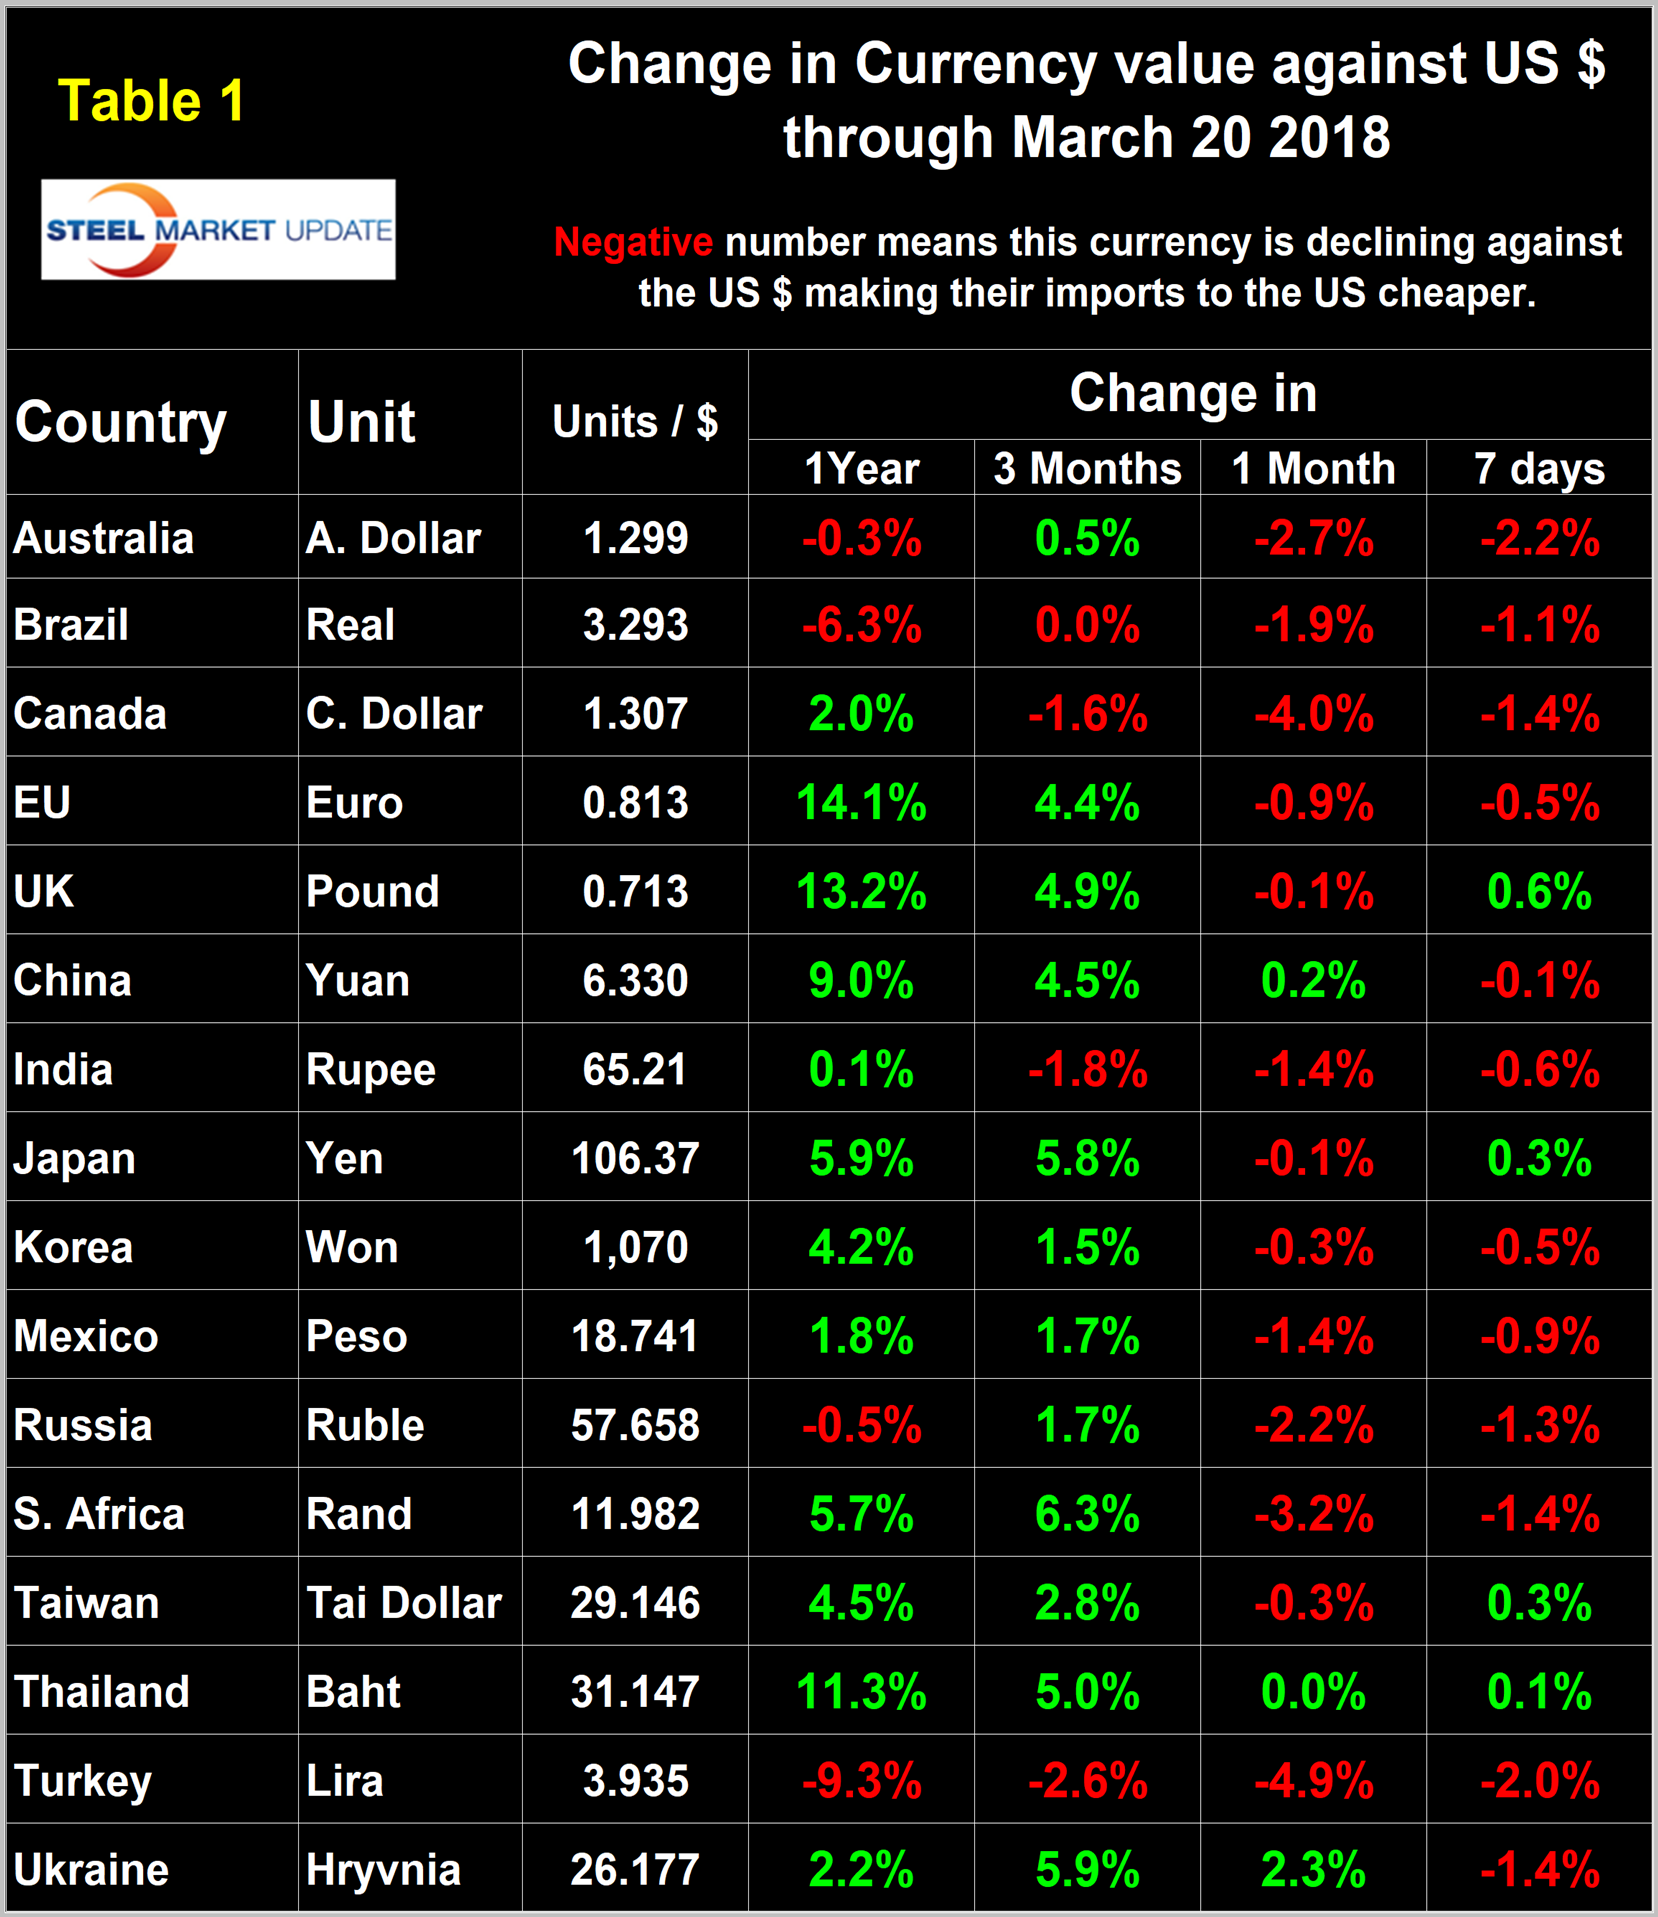
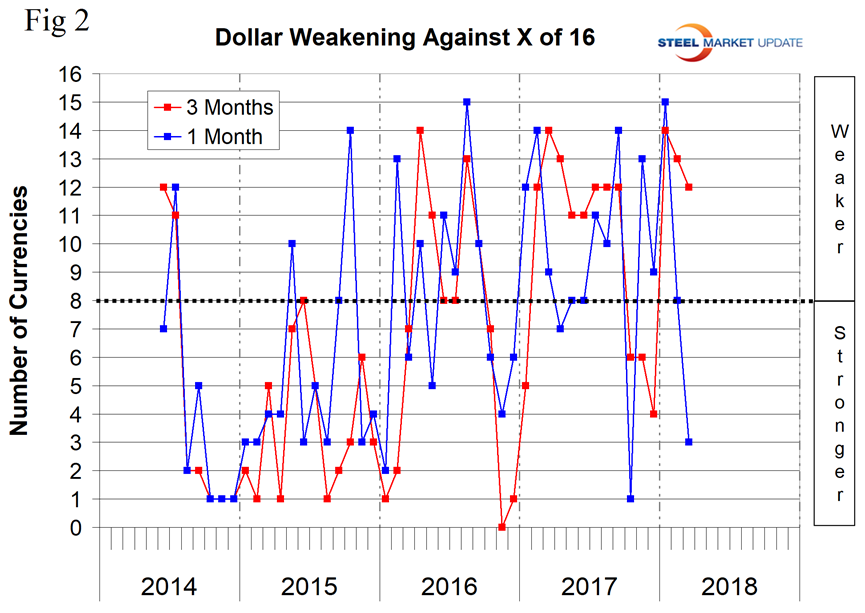
Figure 2 gives a longer-range perspective and shows the extreme gyrations that have occurred in the last three years. The dollar weakened against 12 of the 16 currencies in the last three months but strengthened against 13 of the 16 in the last month, probably in anticipation of the Fed’s move this week. Quite often the change in value of these 16 currencies does not accord with the broad index, but this is not one of those times.
A falling dollar puts upward pressure on all commodity prices that are greenback denominated. Table 1 is color coded to indicate strengthening of the dollar in red and weakening in green. We regard strengthening of the U.S. dollar as negative and weakening as positive because of the effect on the trade balance of all commodities and on the total national trade deficit.
In each of these reports, we comment on several of the 16 steel and iron ore trading currencies listed in Table 1 and over a period of several months will describe the history of all of them. Charts for each of the 16 currencies are available through Feb. 23 for any premium subscriber who requests them.
The Euro
The euro has strengthened by 4.4 percent against the dollar in the last three months, but in the last month weakened by 0.9 percent. Since Jan. 1, 2017, the EU has shipped 5,312,000 tons of rolled steel products into the U.S., enough of a reason for their opposition to the Section 232 legislation.
On Feb. 28, currency analyst Heidi Tait commented: “For a little over a year now, the U.S. dollar has been on a path of price destruction and the euro has increased upwards of 15 percent. This all seems to be counterintuitive, with the United States continuing to increase rates and the European Union still unable to discuss any rate hikes. One thing to remember is that all markets anticipate the future and price it in well ahead of time. Traditionally, currency moves tend to reflect interest rate differentials, but with the world anticipating the changes in central bank policy to come, these correlations are not holding to tradition. As we speak, things appear to be dead in the water as speculators and other players decide on what else is to come and how these things will affect the markets.”

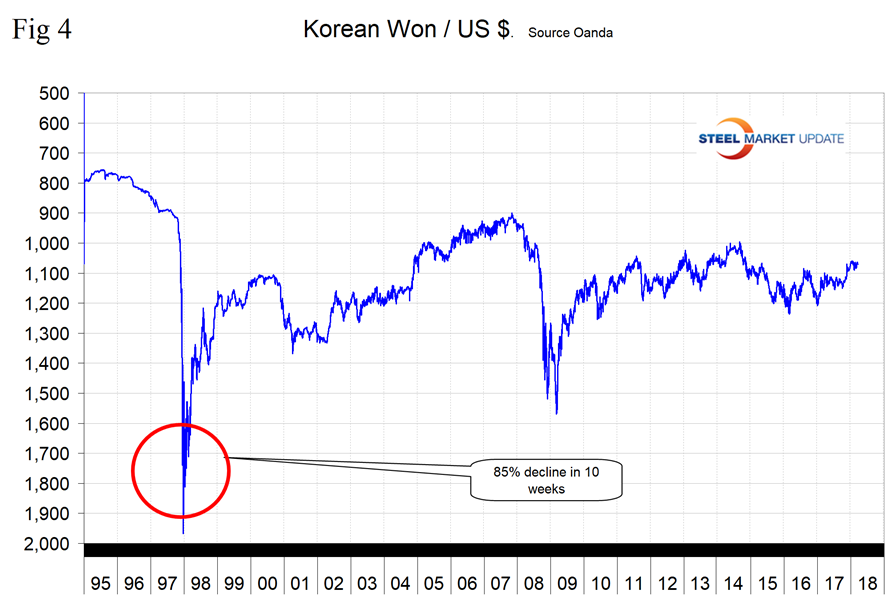
The Korean Won
Korea’s won has strengthened by 1.5 percent in the last three months but weakened by 0.3 percent in the last month. Since Jan. 1, 2017, Korea has shipped 4,087,000 tons into the U.S. putting them in third place after Canada and Brazil. The two highest volume items were OCTG and line pipe at 32 percent and 20 percent of the total, respectively.
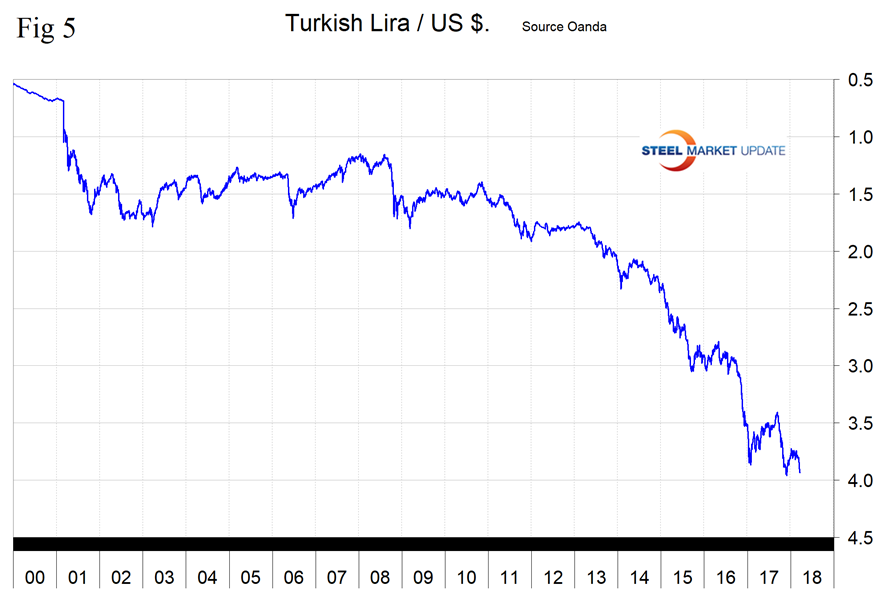
The Turkish Lira
Turkey’s lira has declined by 9.3 percent in the last year and by 4.9 percent in the last month. Since Jan. 1, 2017, Turkey has shipped 2,293,000 tons into the U.S., putting them in sixth place. The highest volume items were rebar at 42 percent of the total, 17 percent cold rolled sheet and 14 percent HDG.
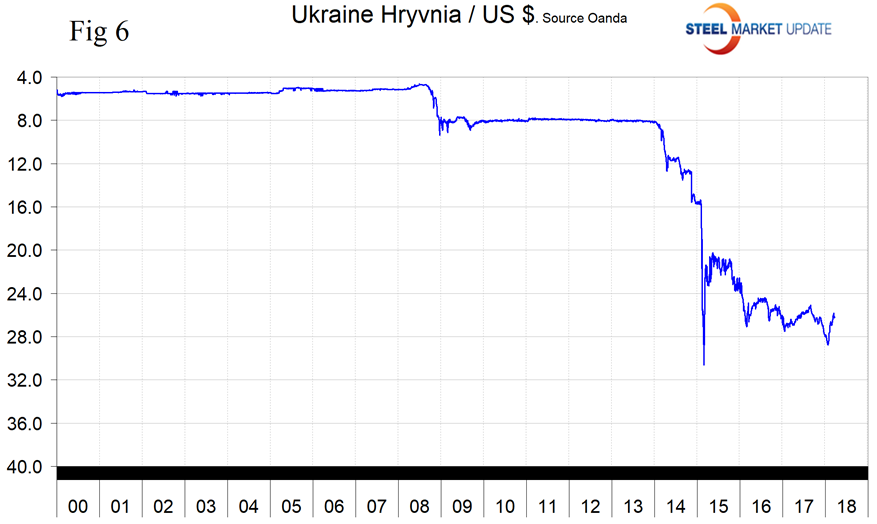
The Ukrainian Hryvnia
Ukraine’s hryvnia has strengthened by 5.9 percent in the last three months and by 2.3 percent in the last month. Since Jan. 1, 2017, Ukraine has shipped 270,000 tons into the U.S., putting them in ninth place. The highest volume products were OCTG at 21 percent, CTL plate at 21 percent and line pipe at 14 percent of the total. Ukraine is a big player on the global export scene with 18.2 million metric tons in 2016 (the most recent data available from the WSA).
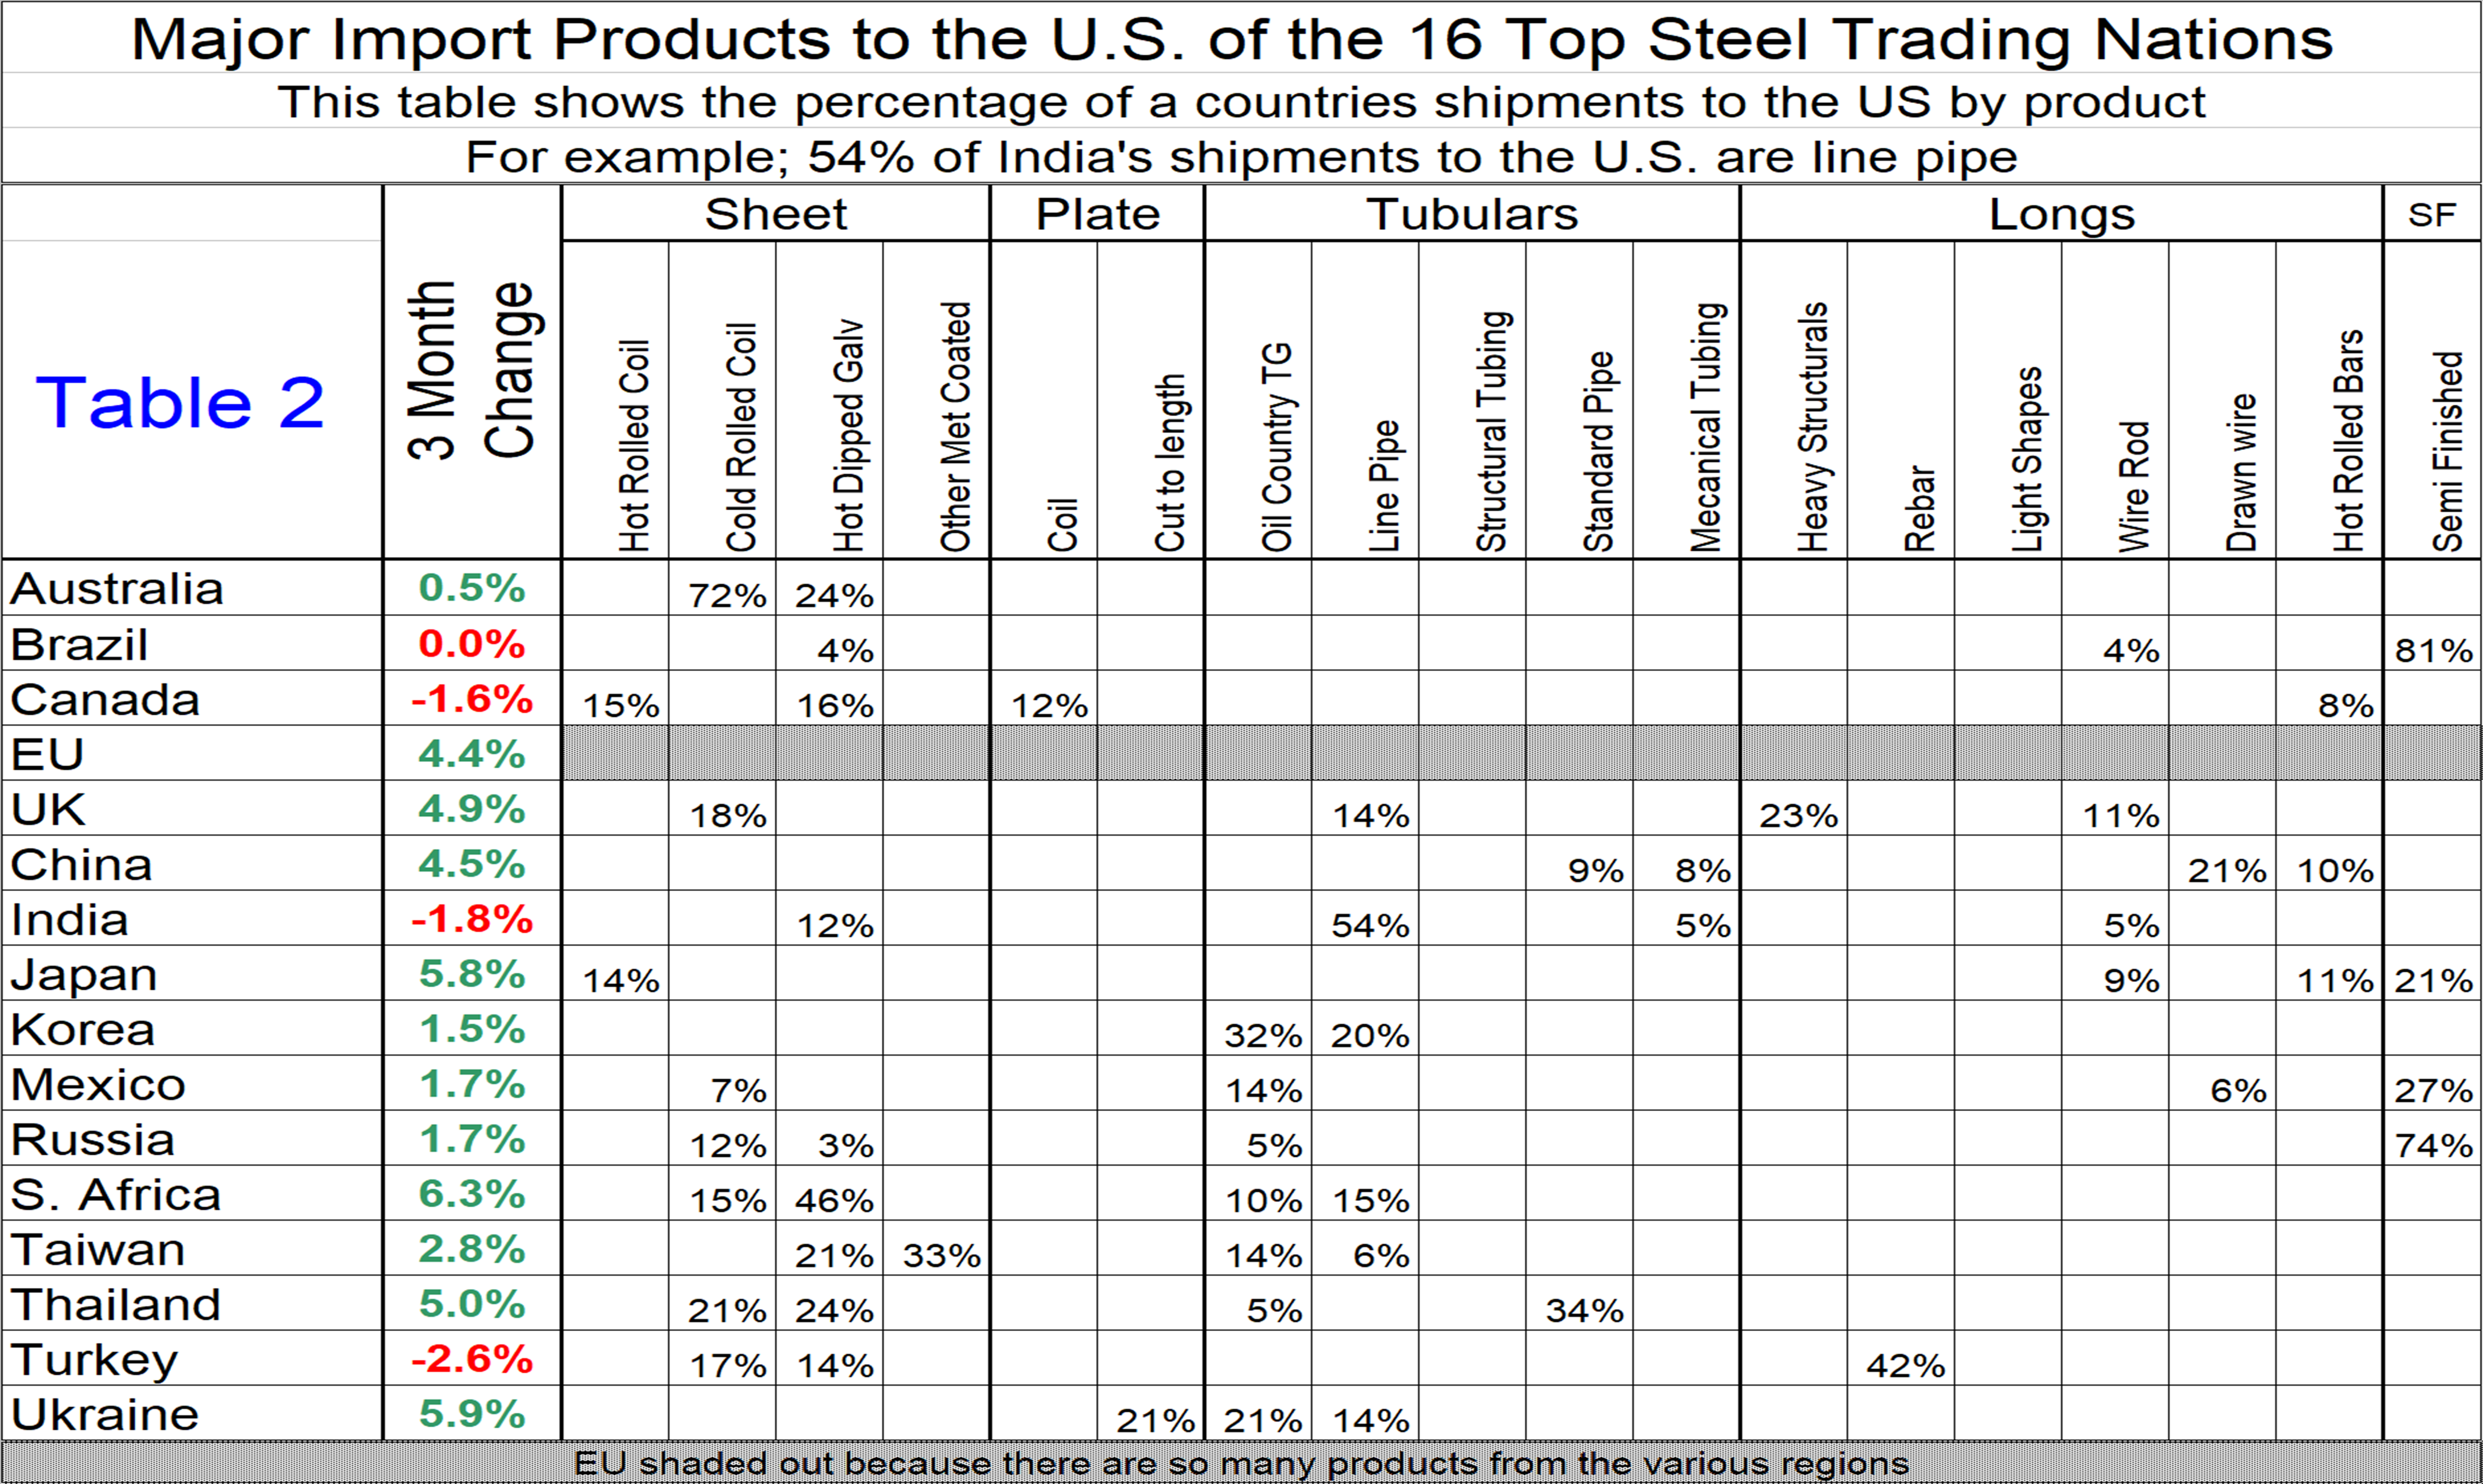
This month, for the first time, we have expanded our report to include Table 2. The intention is to show which products are in the portfolio of the 16 nations and to compare that with the three-month change in currency value. For example, if a subscriber is buying cold rolled coil from the UK, an alternative source would be Turkey with a currency price differential of 7.5 percent at the three-month level.
Explanation of Data Sources: The broad index is published by the Federal Reserve on both a daily and monthly basis. It is a weighted average of the foreign exchange values of the U.S. dollar against the currencies of a large group of major U.S. trading partners. The index weights, which change over time, are derived from U.S. export shares and from U.S. and foreign import shares. The data are noon buying rates in New York for cable transfers payable in the listed currencies. At SMU, we use the historical exchange rates published in the Oanda Forex trading platform to track the currency value of the U.S. dollar against that of 16 steel and iron ore trading nations. Oanda operates within the guidelines of six major regulatory authorities around the world and provides access to over 70 currency pairs. Approximately $4 trillion U.S. dollars are traded every day on foreign exchange markets.


