

Market Data

March 22, 2018
SMU Currency Analysis: Dollar Shows Some Weakness
Written by Peter Wright
The dollar has been trading in a range for eight weeks and on April 13 had the same value as it did on Feb. 14. Since its recent peak on Jan. 3, 2017, the dollar has weakened by 8.9 percent and in 2018 is down by 1.0 percent through April 13.
Please see the end of this report for an explanation of data sources. The analysis of currency trends is a highly technical undertaking. Therefore, in this monthly SMU update, we sometimes incorporate the opinions of analysts we deem credible to add color to our own data analysis.
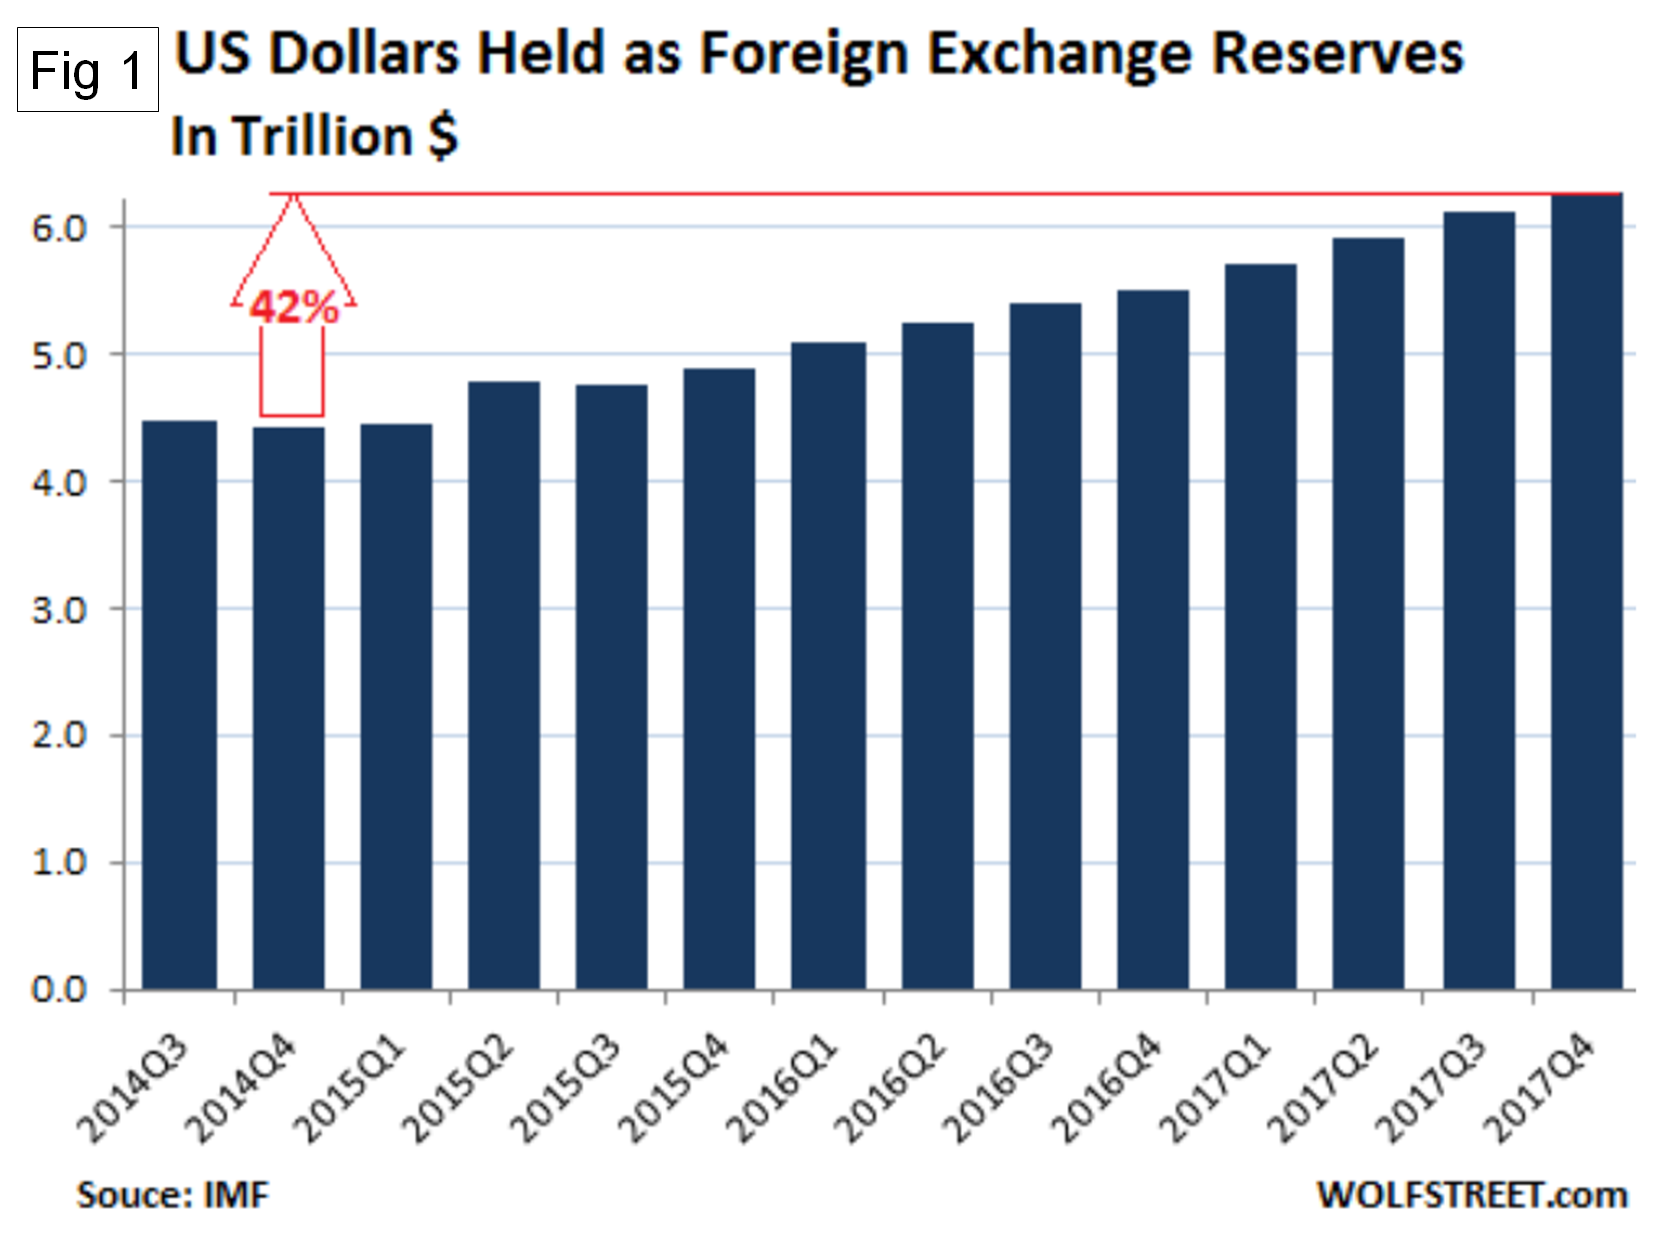
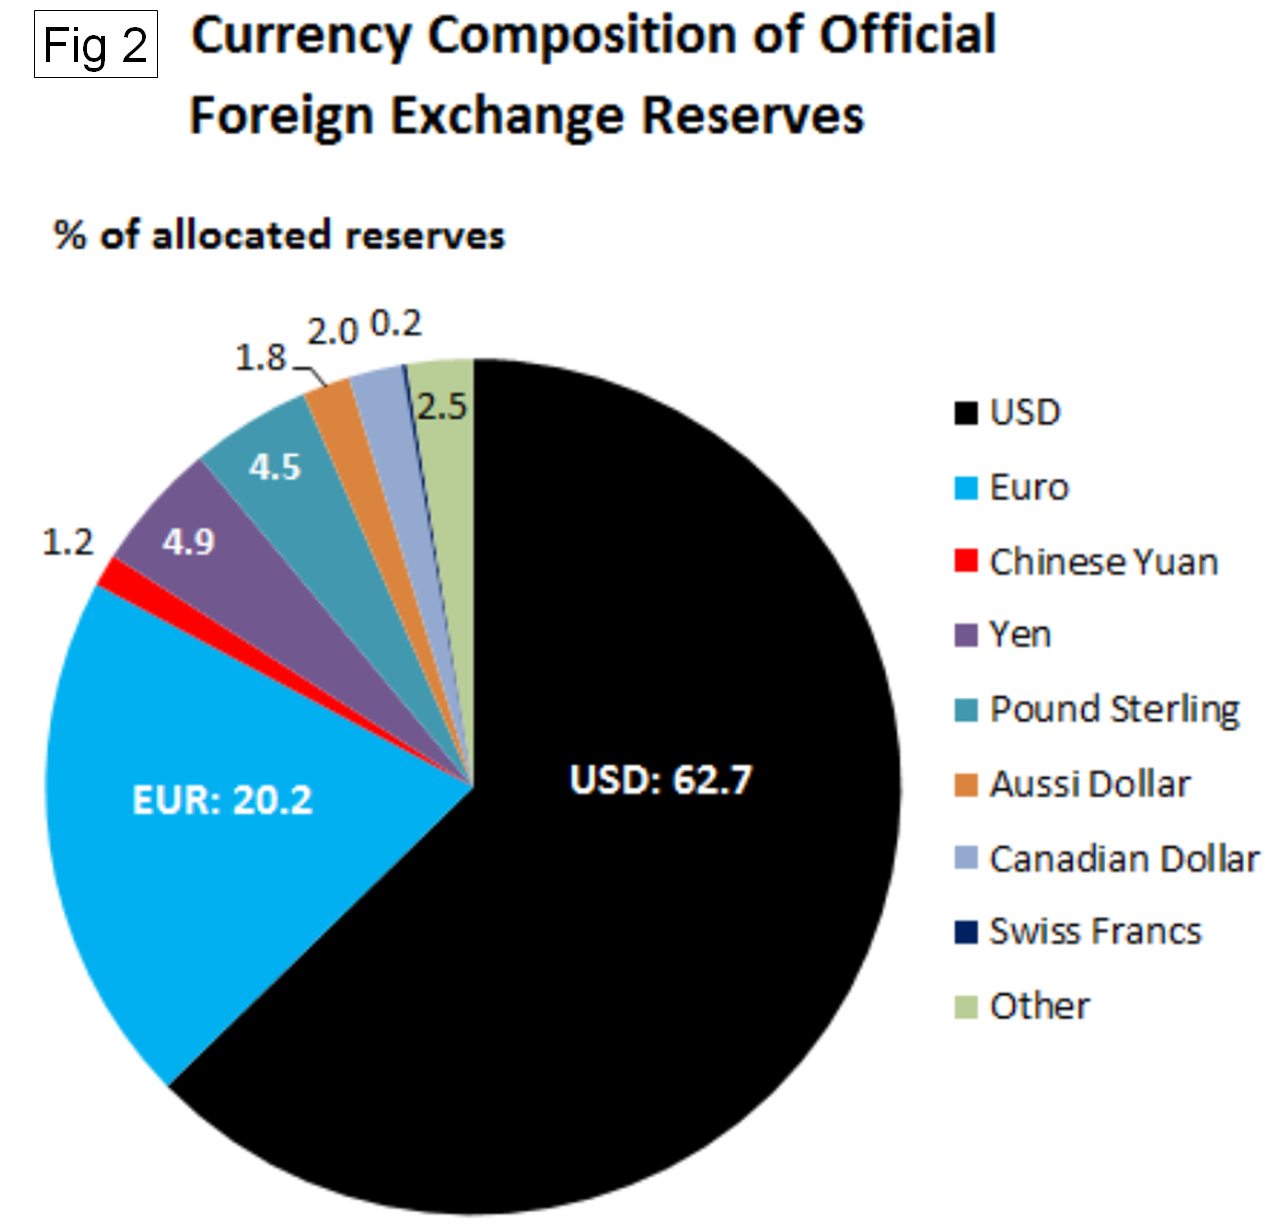
On March 31, currency analyst Wolf Richter examined the just-released IMF report on foreign exchange reserves in Q4 2017. He reported that dollar-denominated assets among foreign exchange reserves rose 14 percent year over year in Q4 to $6.28 trillion and are up 42 percent from Q4 2014 (Figure 1). There is no indication that global central banks have lost interest in the dollar. In Q4 2017, total global foreign exchange reserves, including all currencies, rose 6.6 percent year over year. For reporting purposes, the IMF converts all currency balances into dollars. Figure 2 shows the breakdown of the $11.42 trillion of foreign exchange reserves. Disappointingly for many folks, the Chinese yuan, the thin red sliver in the pie chart in Figure 2, didn’t exactly soar since its inclusion in the SDR basket. Its share ticked up to a minuscule 1.2 percent of allocated foreign exchange reserves in Q4. In other words, central banks seem to lack eagerness to hold yuan-denominated assets.
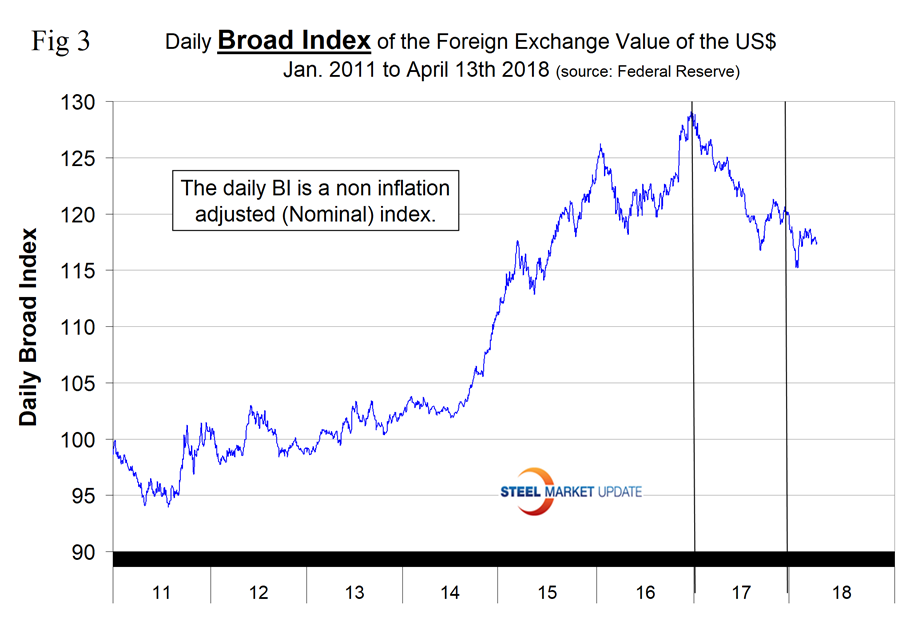
The Broad Index value of the U.S. dollar is reported several days in arrears by the Federal Reserve; the latest value published was for April 13. Figure 3 shows the index value since January 2011. The dollar had a recent peak of 128.96 on Jan. 3, 2017, which was the highest value in almost 15 years; the recent low point was Feb. 1, 2018, at 115.21. Since then, the dollar recovered to 117.44 on April 13.
Each month, SMU publishes an update of Table 1, which shows the value of the U.S. dollar against the currencies of 16 major global steel and iron ore trading nations. The table shows the change in value in one year, three months, one month and seven days through April 20.
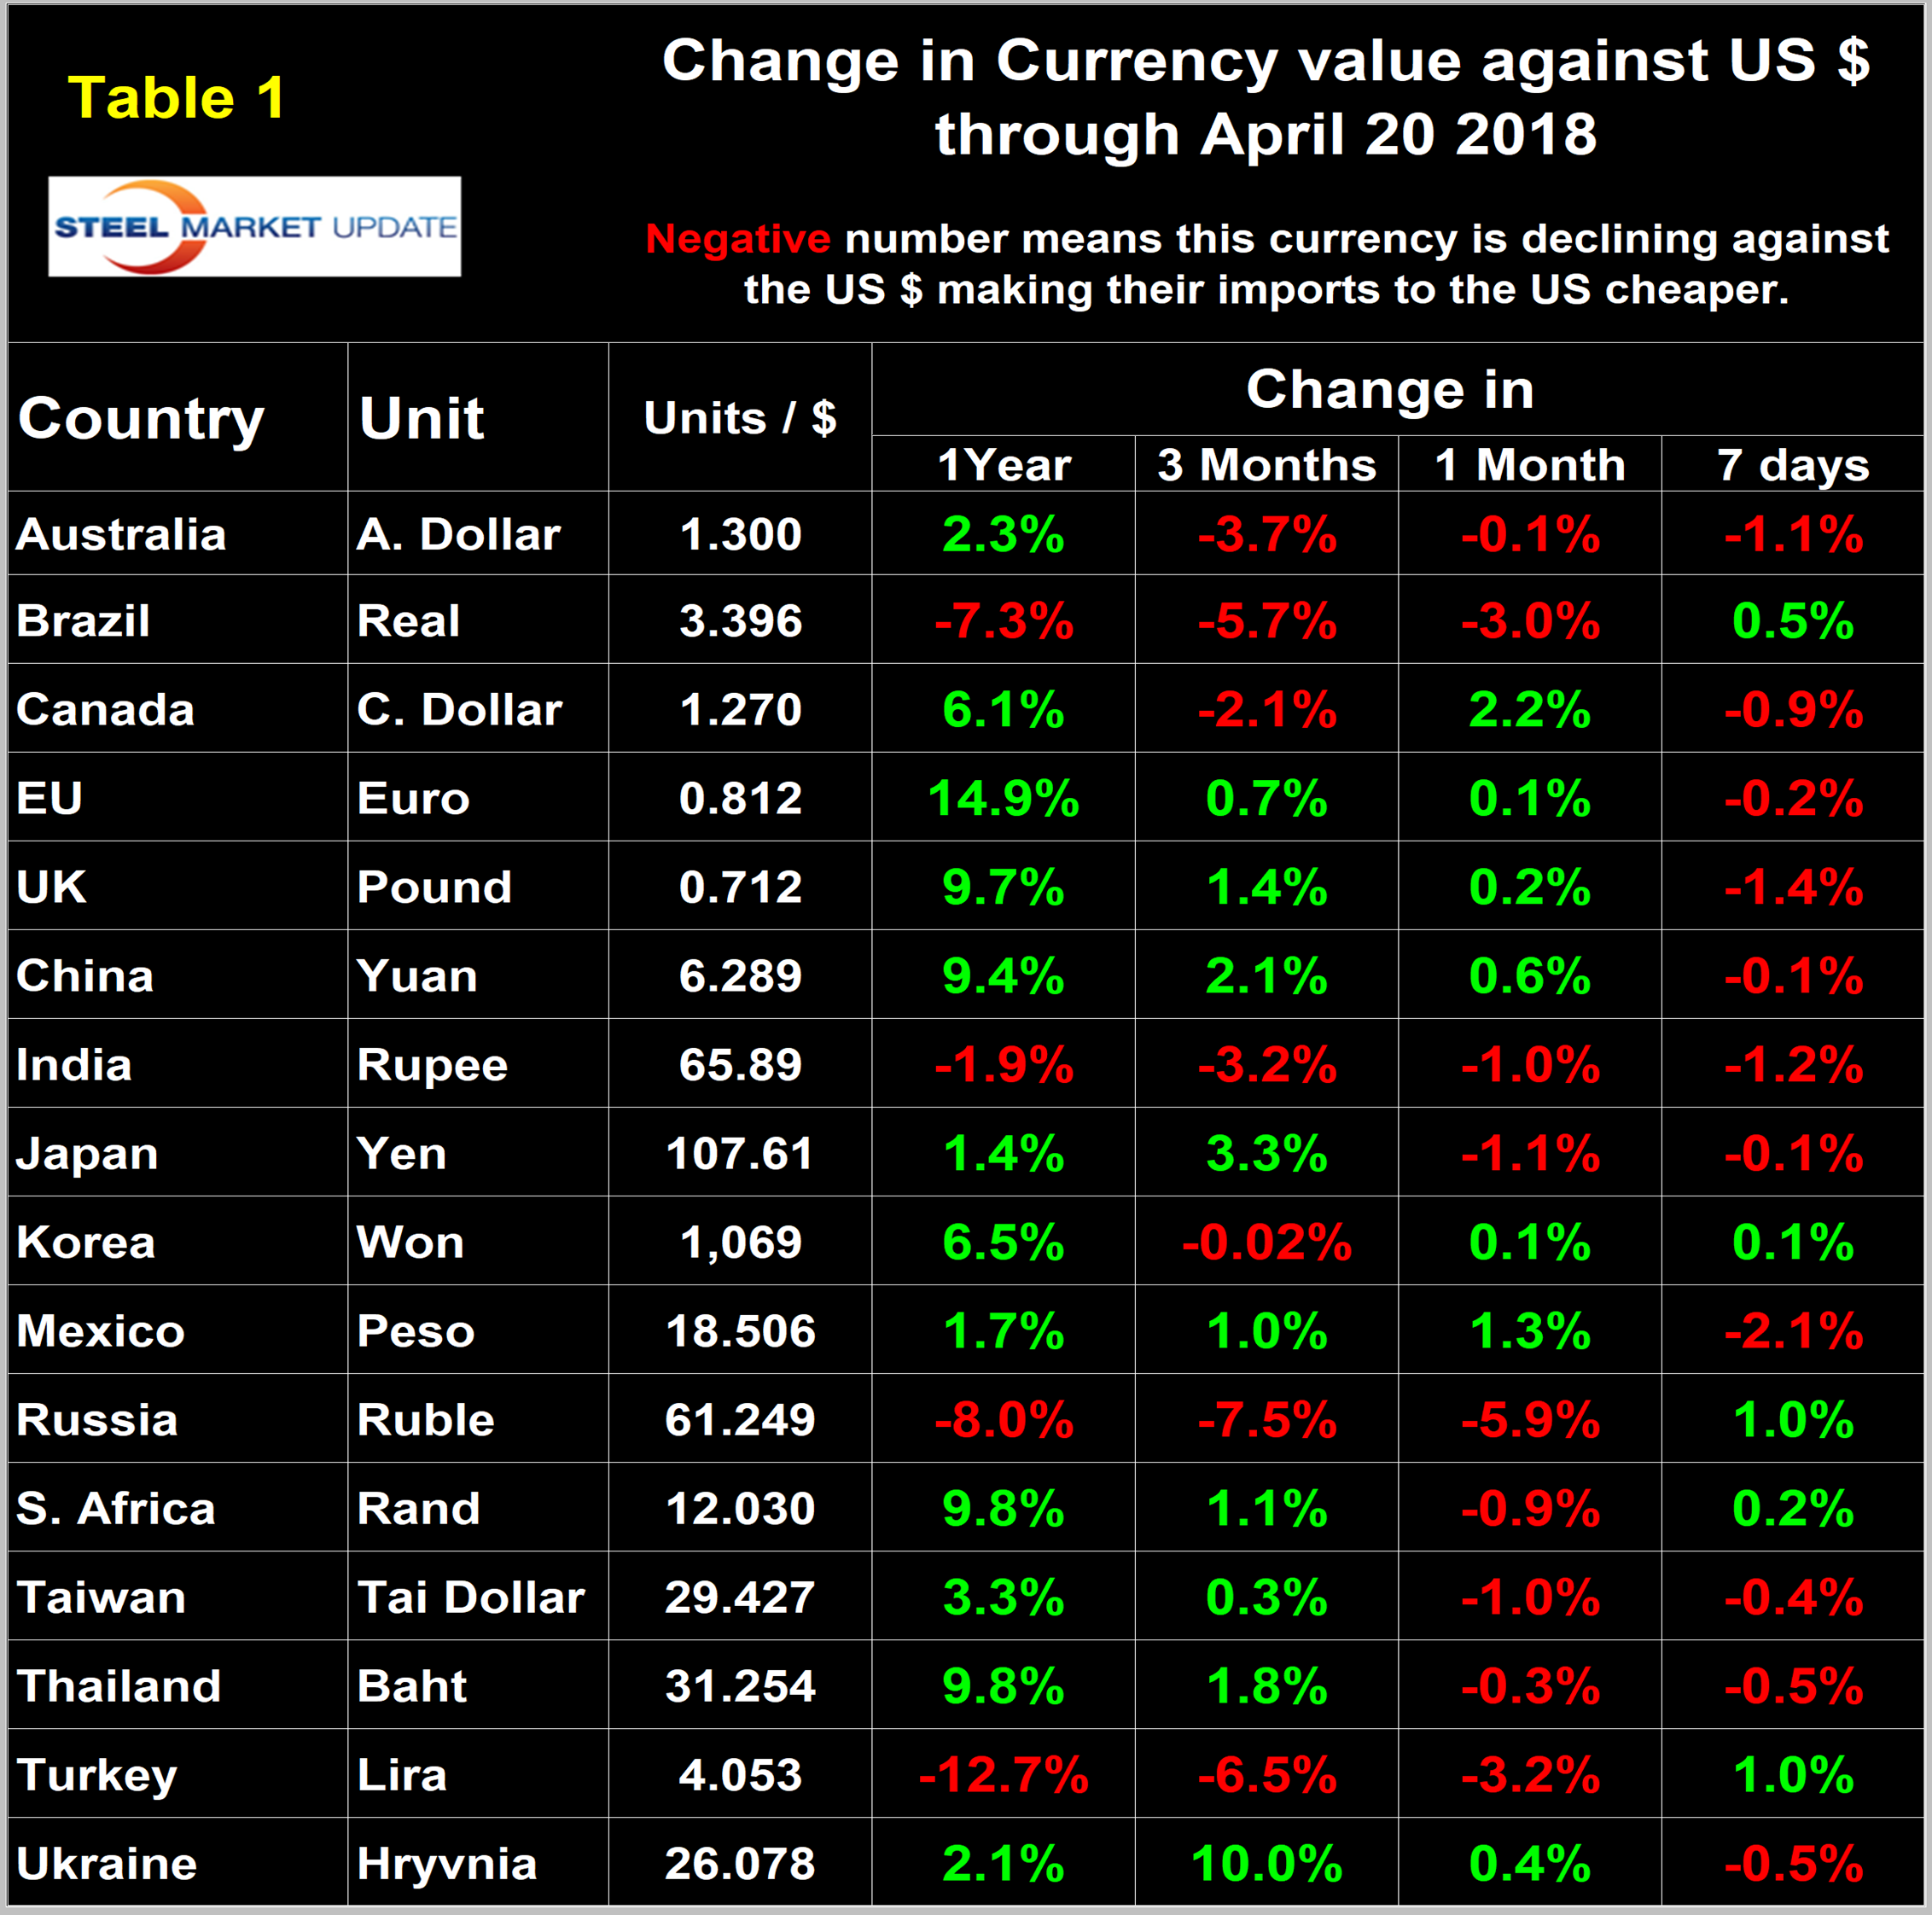
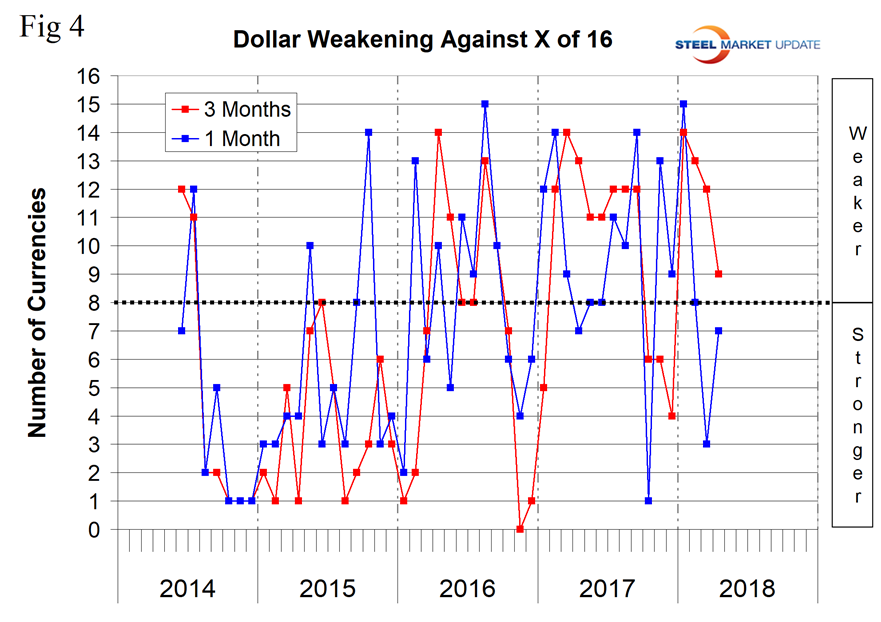
Figure 4 gives a longer-range perspective and shows the extreme gyrations that have occurred in the last three years. The dollar weakened against nine of the 16 currencies in the last three months and against seven in the last month. Quite often the change in value of these 16 currencies does not accord with the broad index, but this is not one of those times.
A falling dollar puts upward pressure on all commodity prices that are greenback denominated. Table 1 is color coded to indicate strengthening of the dollar in red and weakening in green. We regard strengthening of the U.S. dollar as negative and weakening as positive because of the effect on the trade balance of all commodities and on the total national trade deficit.
In each of these reports, we comment on several of the 16 steel and iron ore trading currencies listed in Table 1 and over a period of several months will describe the history of all of them. Charts for each of the 16 currencies are available through April 20 for any premium subscriber who requests them.
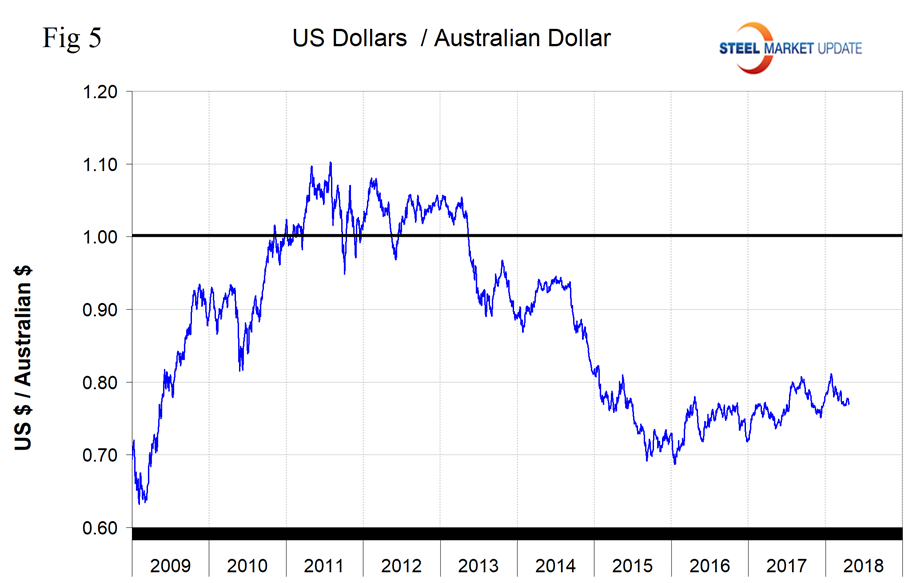
The Australian Dollar
Australia’s dollar has declined by 3.7 percent in the last three months and by 0.1 percent in the last month (Figure 5). Australia is not a major exporter of steel to the U.S., but we include them in this report because of their global significance as a supplier of iron ore and coking coal.
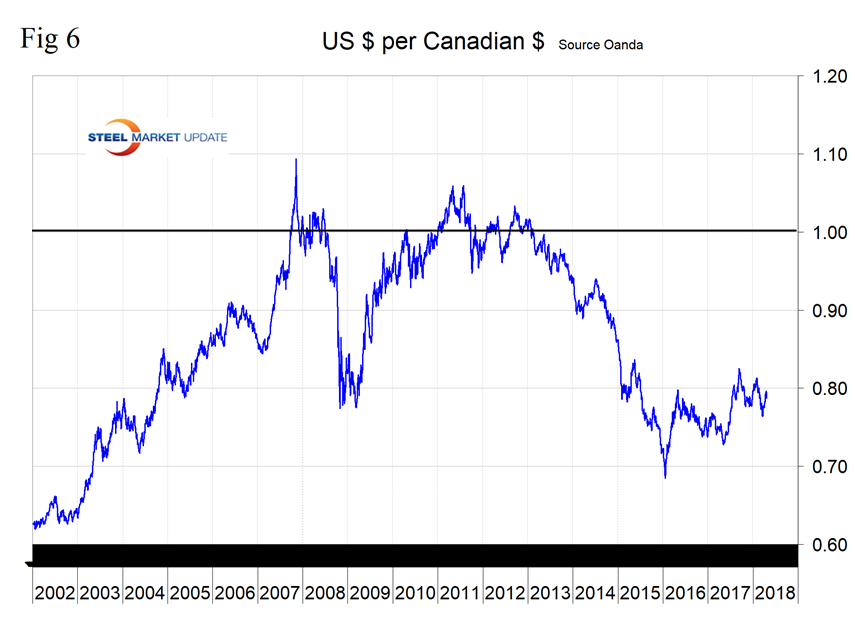
The Canadian Dollar
Canada’s dollar has gained 2.2 percent in the last month but over a three-month period is down by 2.1 percent (Figure 6). Canada is the nation with the largest steel export volume to the U.S. Since January last year, Canada has accounted for 17 percent of the total. Hot and cold rolled sheet are the primary products coming out of Canada; others are shown in Table 2.
Currency analyst Dean Popplewell said on April 20: “There were no surprises from the Bank of Canada on Wednesday, as the bank maintained the benchmark rate at 1.25 percent. The BoC was in cautious mode in the rate statement, noting that growth in the first quarter was weaker than the bank had forecast, but that it expected better news in the second quarter. The bank has some egg on its face as, in January, it predicted growth of 2.5 percent for the first quarter but has now revised the forecast to just 1.3 percent growth. Speaking after the statement, BoC Governor Stephen Poloz said that ‘the economy is in a good place’ but added that ‘interest rates are very low.’ This is a clear signal that the BoC plans to raise rates in the near future, and many analysts are predicting a rate hike in July. Canada’s employment picture has been a bright spot, underscored by an excellent ADP nonfarm payrolls report on Thursday. As well, inflation has moved closer to the BoC’s target of 2 percent, making a rate hike likely in the next few months.”
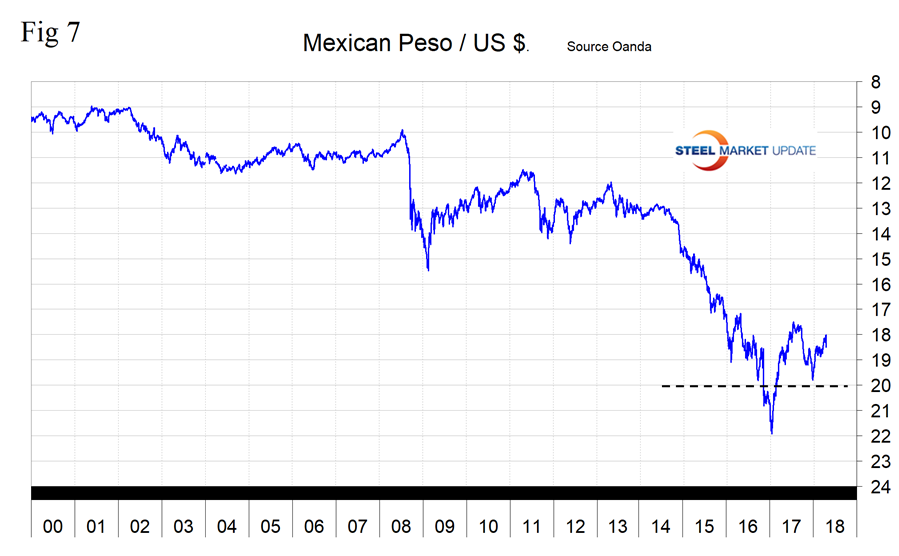
The Mexican Peso
Mexico’s peso has gained 1.3 percent in the last month and over a three-month period is up by 1.0 percent (Figure 7). Mexico is the third major importer of steel into the U.S. with a total of 3.9 million metric tons since and including February last year. Twenty-eight percent of Mexico’s volume is semi-finished. Other major products are: OCTG, 13 percent; cold rolled sheet, 7 percent; drawn wire, 6 percent; and line pipe, 5 percent.
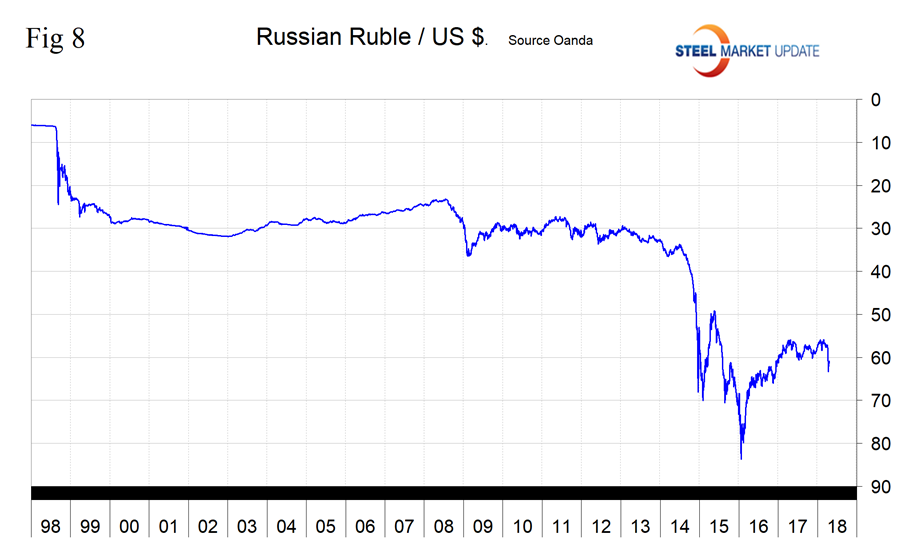
The Russian Ruble
Russia’s ruble has lost 5.9 percent in the last month and over three months is down by 7.5 percent (Figure 8). On both counts these are the largest changes to have occurred in the 16 currencies that we track. Since and including February last year, Russia has shipped 3.6 million tons of steel products into the U.S. of which 75 percent was semi-finished. Russia is in fifth place with 9 percent of the total. Other major products from Russia as a percentage of their total are: cold rolled sheet, 12 percent; HDG, 4 percent; and OCTG, 5 percent.
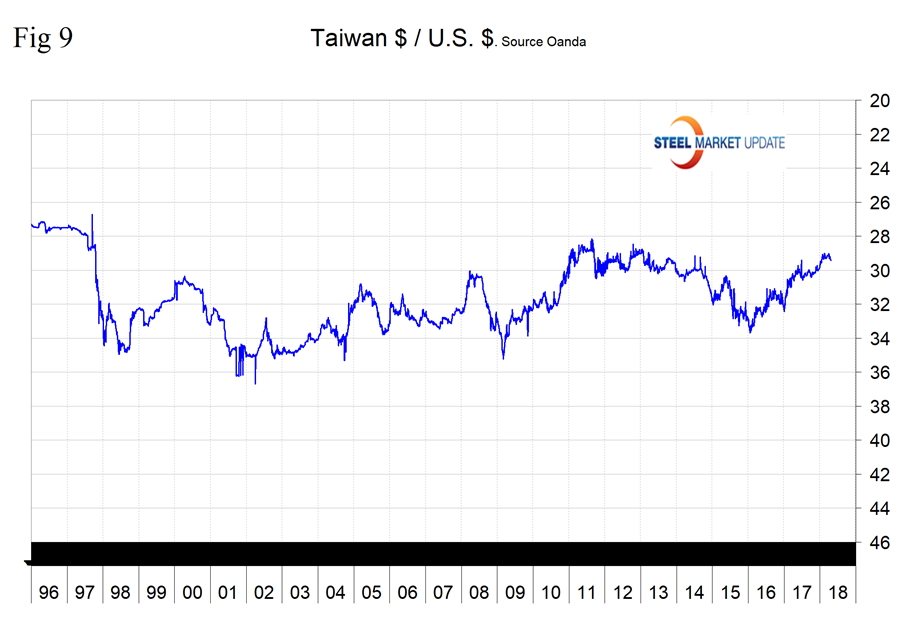
The Taiwanese Dollar
Taiwan’s dollar has lost 0.95 percent in the last month but is up by 0.33 percent in three months (Figure 9). Since and including February last year, Taiwan has shipped 1.197 million metric tons into the U.S, putting them in ninth place. Most of their tonnage was in three products: all other metallic coated sheets, (mainly Galvalume), 32 percent; OCTG, 15 percent; and HDG sheet, 20 percent.
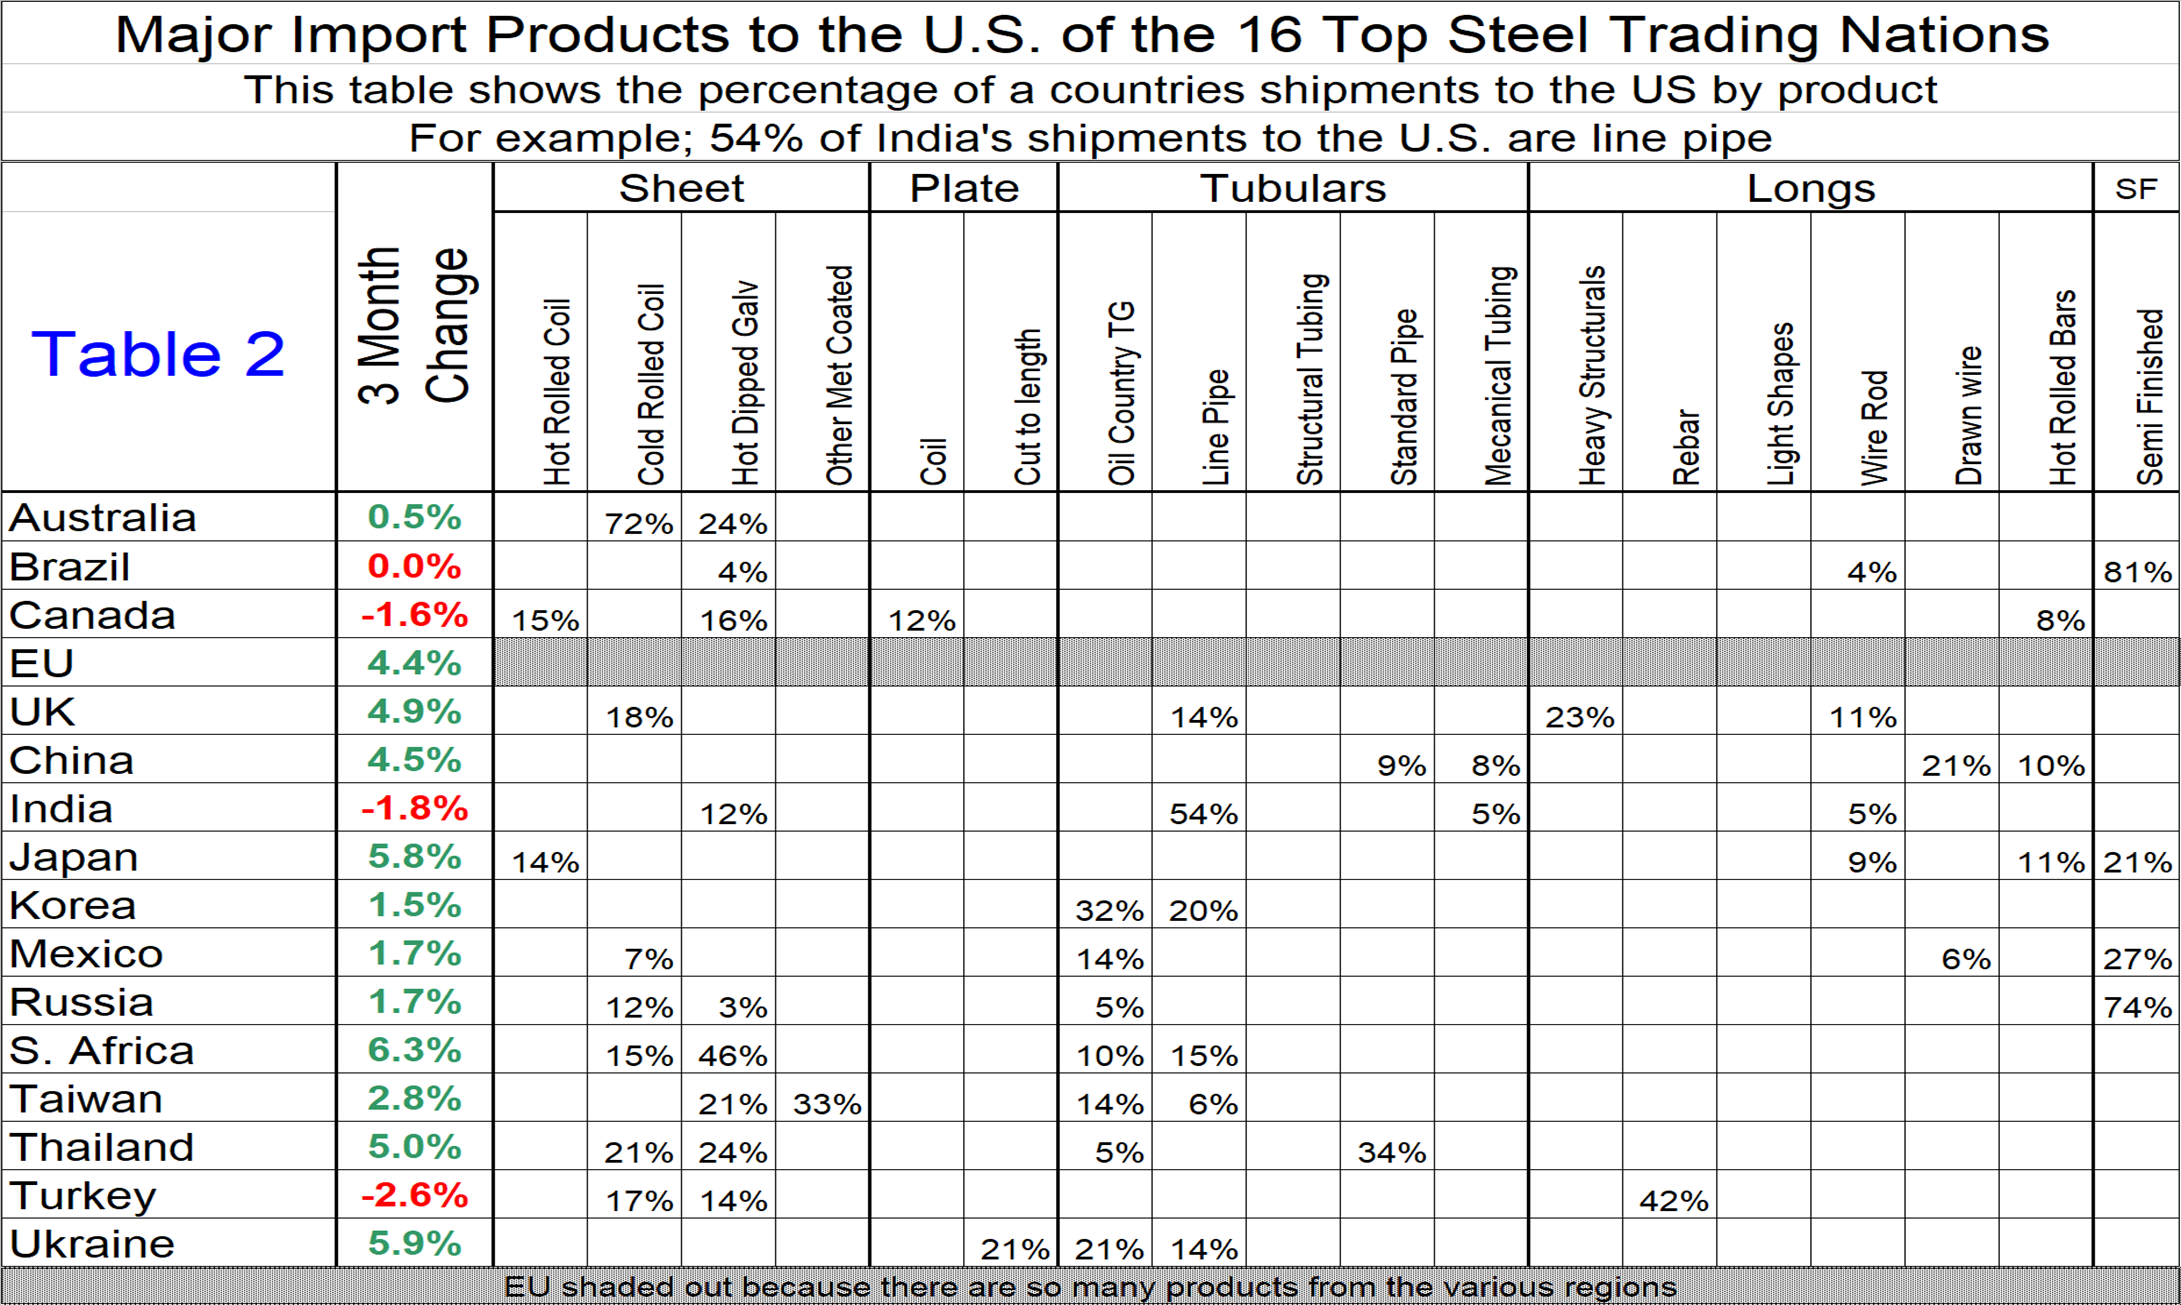
Last month we expanded our report to include Table 2. The intention here is to show which products are in the portfolio of the 16 nations and to compare with the three-month change in currency value. For example, if a subscriber is buying hot band from Japan, he or she could switch to Canada with a currency price differential of 5.4 percent at the three-month level.
Explanation of Data Sources: The broad index is published by the Federal Reserve on both a daily and monthly basis. It is a weighted average of the foreign exchange values of the U.S. dollar against the currencies of a large group of major U.S. trading partners. The index weights, which change over time, are derived from U.S. export shares and from U.S. and foreign import shares. The data are noon buying rates in New York for cable transfers payable in the listed currencies. At SMU, we use the historical exchange rates published in the Oanda Forex trading platform to track the currency value of the U.S. dollar against that of 16 steel and iron ore trading nations. Oanda operates within the guidelines of six major regulatory authorities around the world and provides access to over 70 currency pairs. Approximately $4 trillion U.S. dollars are traded every day on foreign exchange markets.


