

Market Data

March 26, 2018
Scrap Trade: Expanding with Global GDP
Written by Peter Wright
The world’s scrap trade continues to expand as the growth of global GDP accelerates. Steel Market Update performs this analysis quarterly to help readers understand the gyrations of the global scrap market. This data is a quarter in arrears because some nations are slow to report.
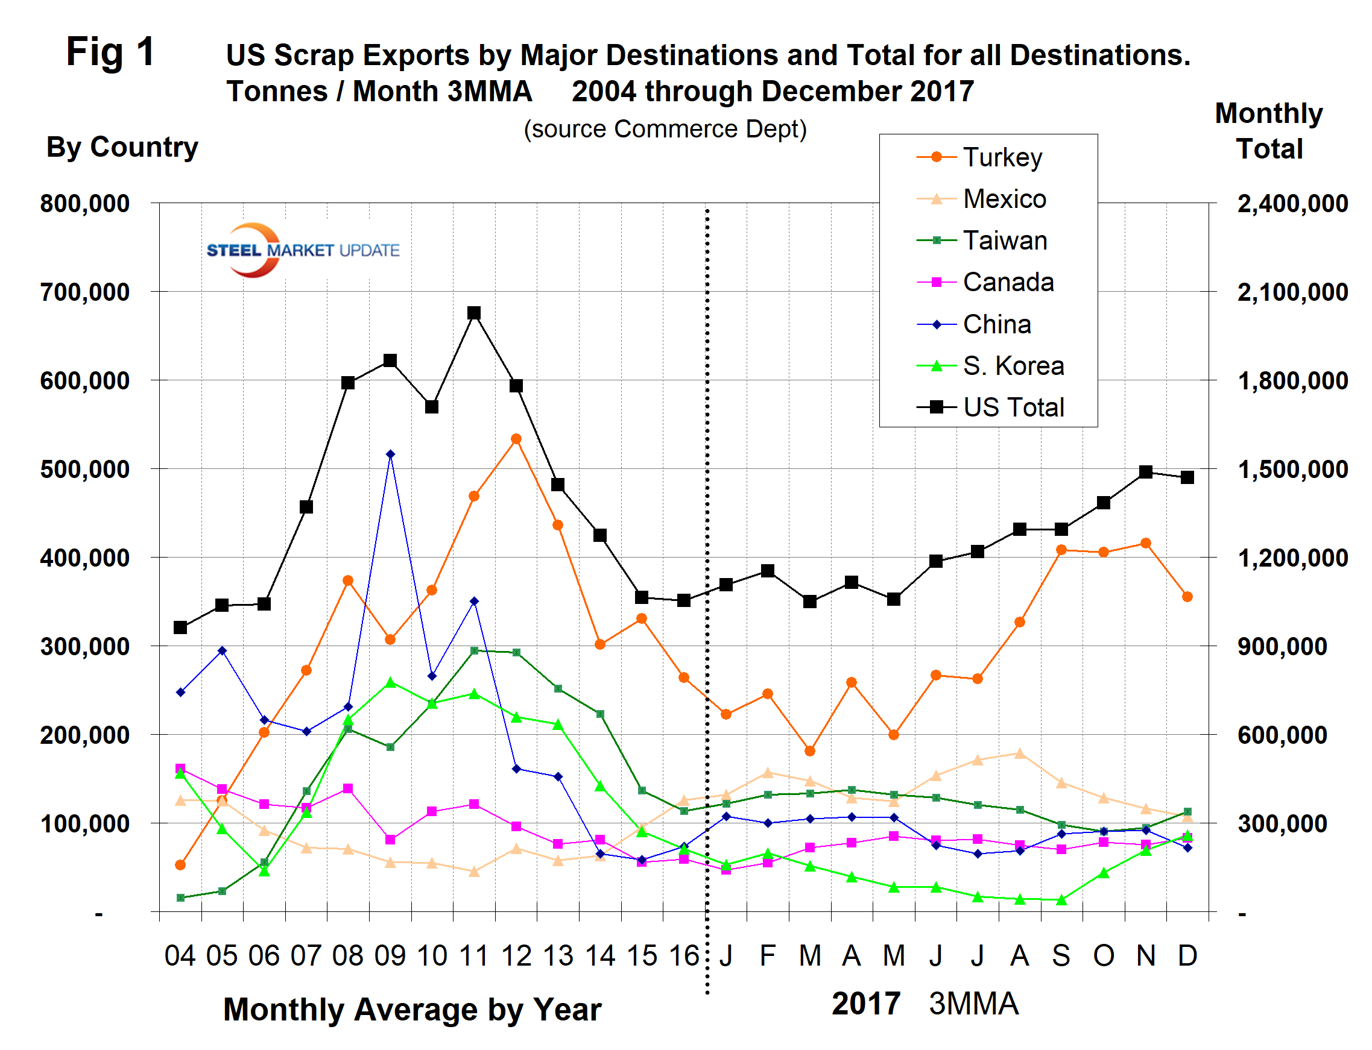
In the 12 months of 2017, U.S. scrap exports increased by 18.6 percent from 2016. While that figure may seem high, scrap exports were well below the rate experienced in 2008-13. To set the scene, Figure 1 shows total scrap exports from the U.S. as reported by the U.S. Department of Commerce on the right axis together with the major destinations reported on the left axis. It shows the monthly average for the years 2004-16 and the three-month moving average for January through December 2017.
In our analysis of global scrap trade, we have excluded scrap that moved within the EU from the global total. Figure 2 shows the total tonnage of global trade since Q1 2000 and the volume of the top five suppliers. These five are the U.S., the EU, the UK, Japan and Russia and they accounted for 64.4 percent of the total in Q4 2017. The total tonnage of ferrous scrap traded between nations in Q1 2016 was the lowest since the recession but bounced back in the latest seven quarters.
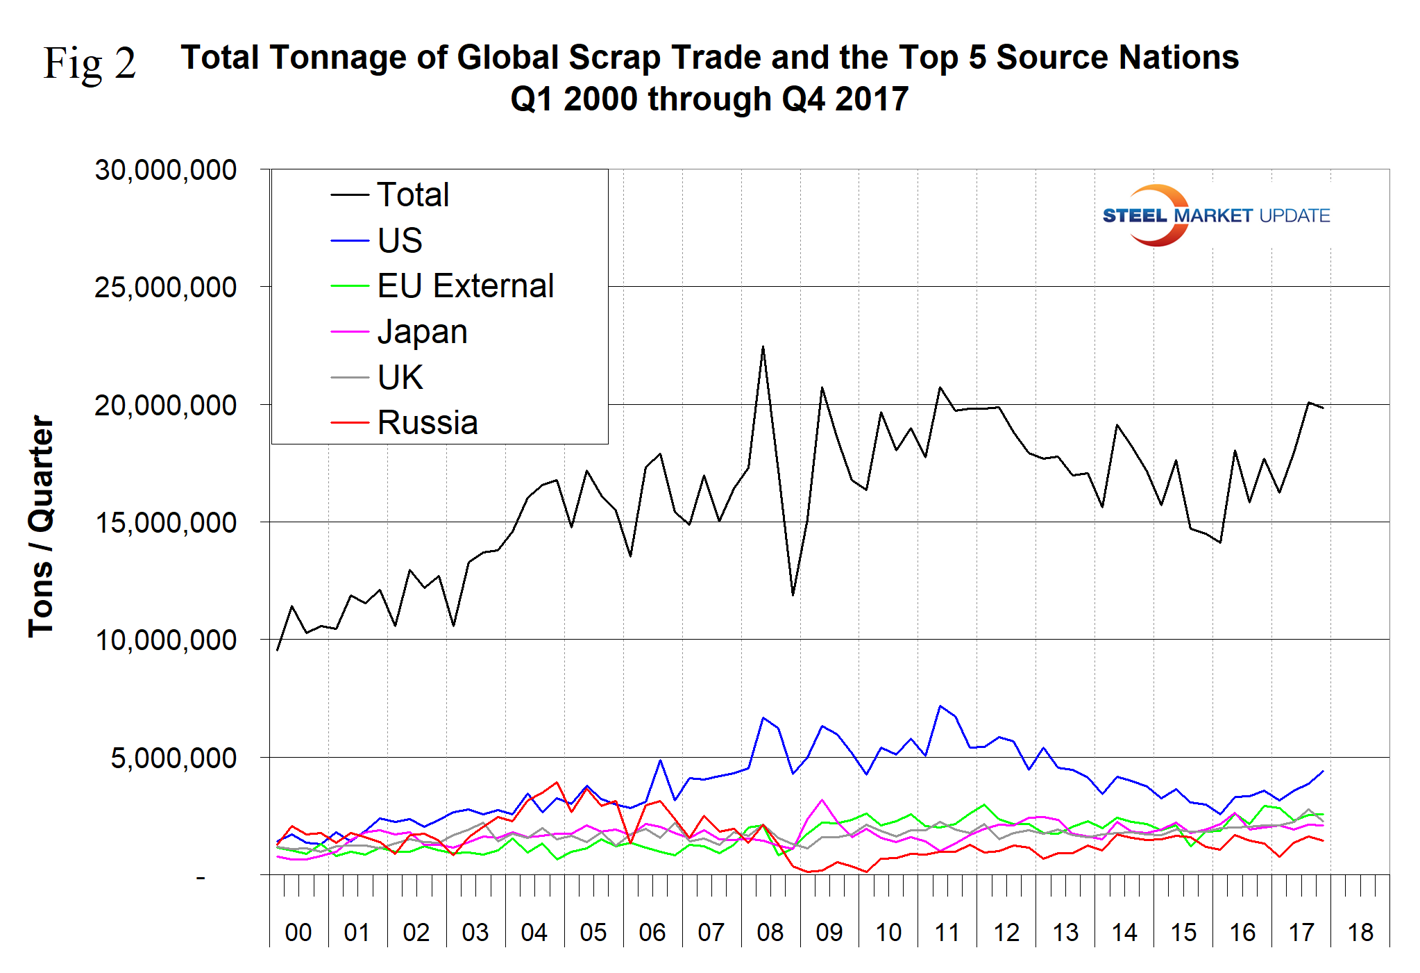
Figure 3 is the same graph with the total removed to better illustrate the volume of the five major players. The U.S. is still the highest volume source on a tonnage basis and moved further ahead of the rest in the years 2016 and 2017.
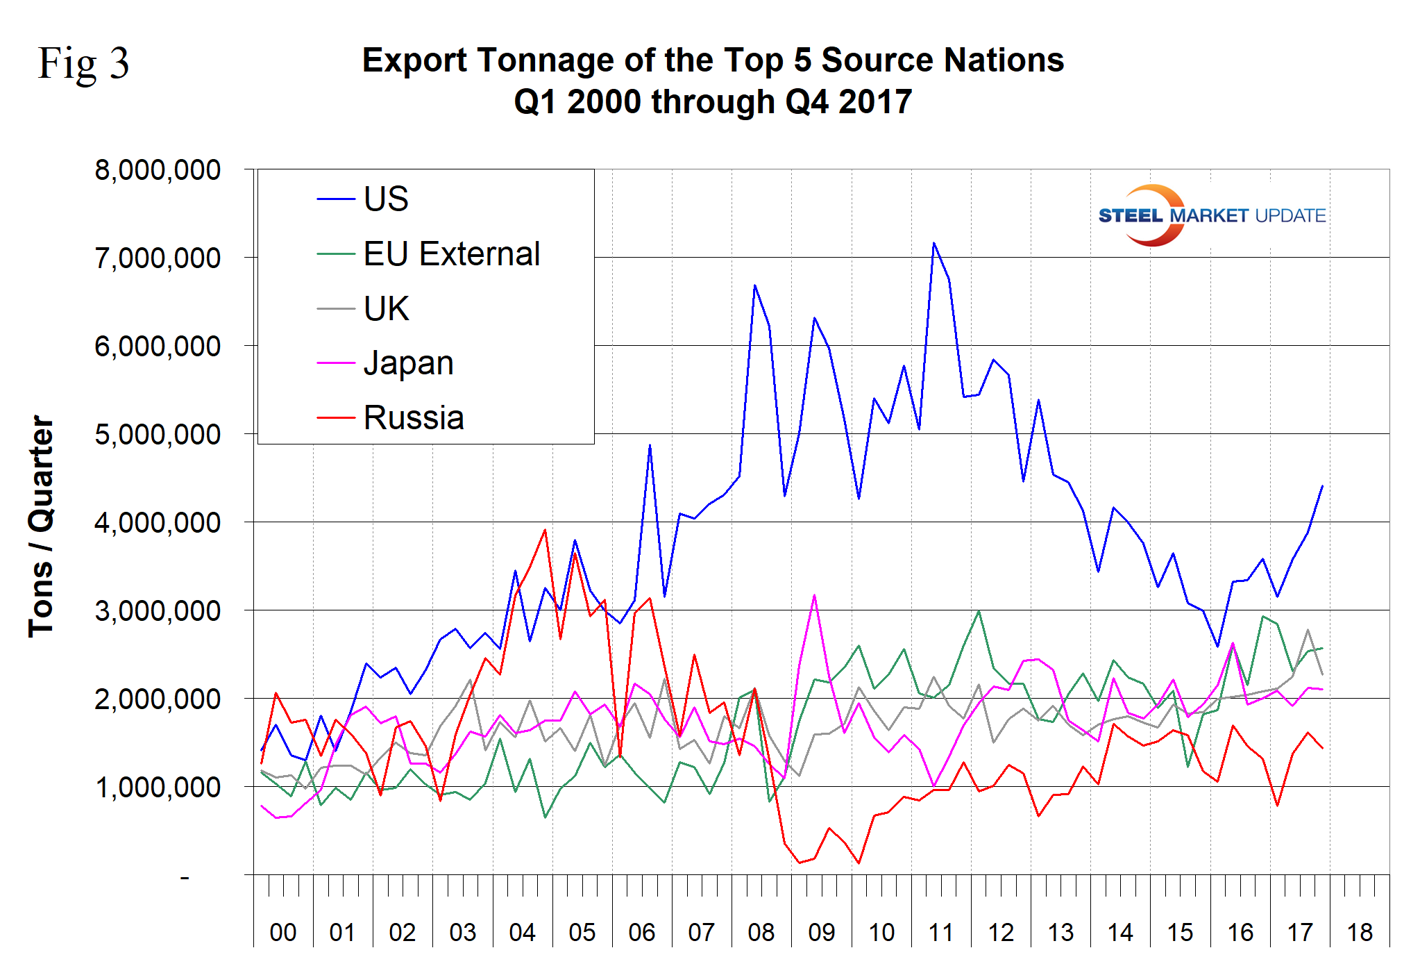
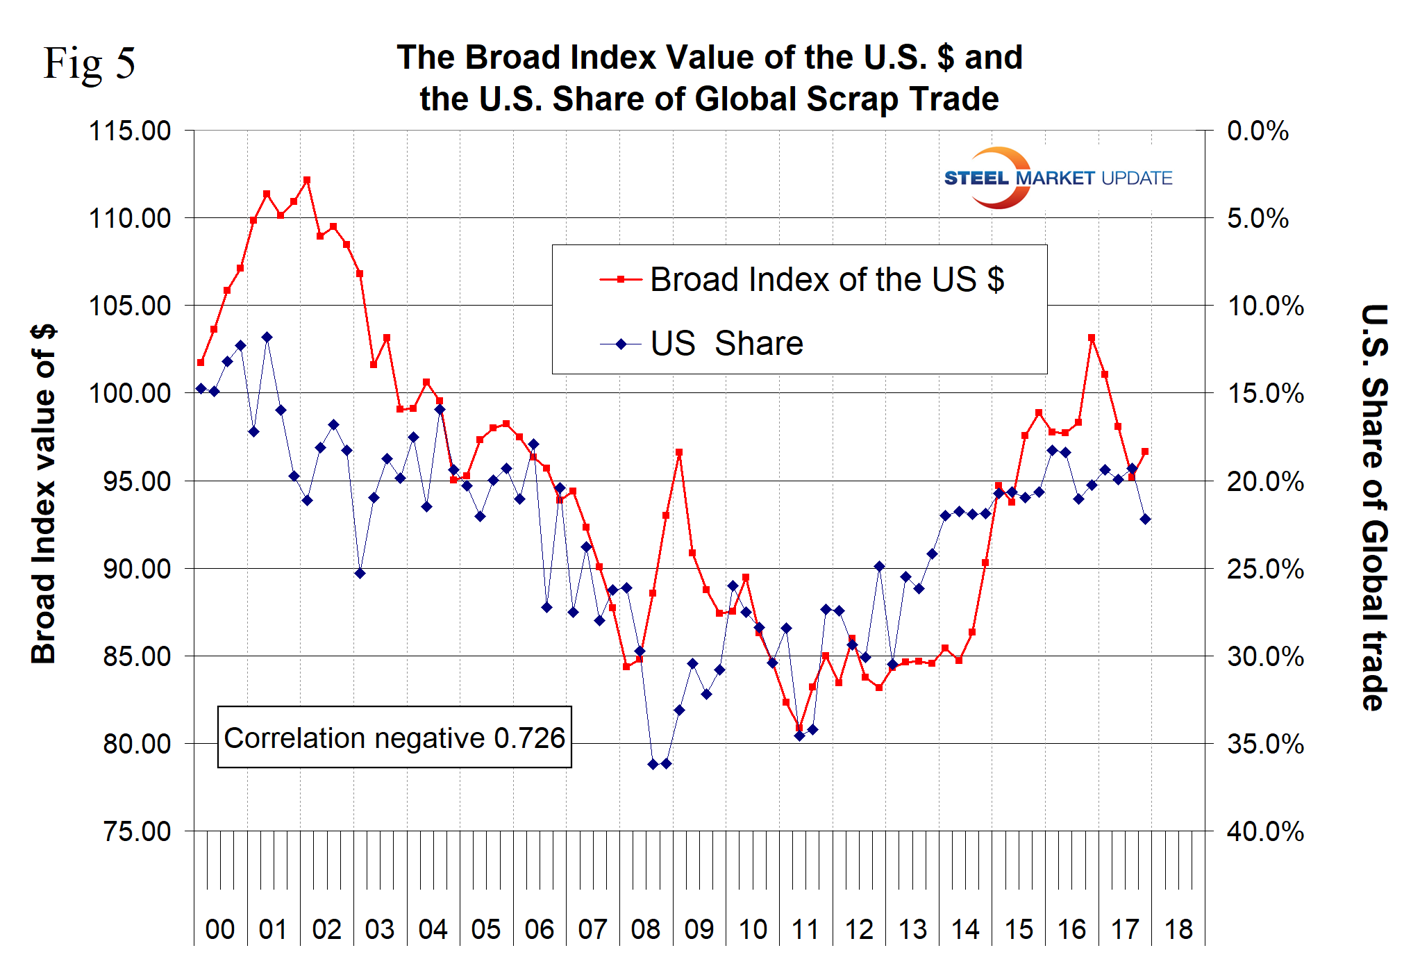
Figure 4 shows the market share of the top five sources. The U.S. share peaked at 36.2 percent in the third and fourth quarters of 2008 and stood at 22.2 percent in Q4 2017. We attribute the long-term decline in the U.S. share to the strengthening of the U.S. dollar. The dollar strengthened from 2011 through Q4 2016.
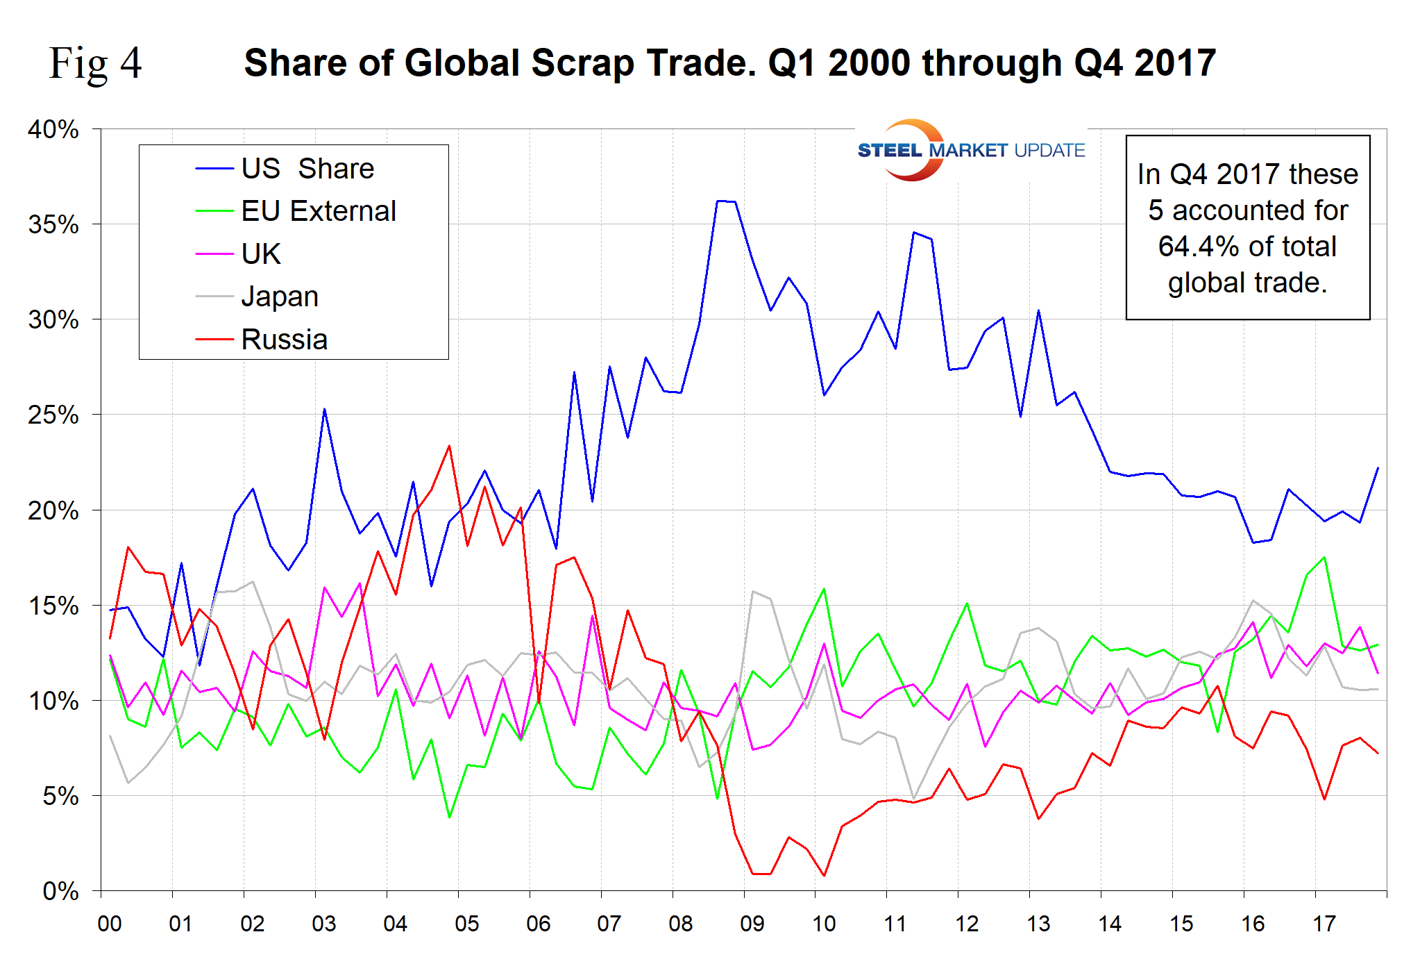
Figure 5 shows the negative correlation of 72.6 percent between the Broad Index value of the U.S. dollar and the U.S. share of global trade.
There is also a correlation between the U.S. global share and the U.S. domestic scrap price. The result is shown in Figure 6 with a correlation of 65.4 percent. The fact that our export share increases as our domestic price increases might seem backwards at first glance. However, scrap is a global commodity, and this would seem to support the view that the domestic price is driven more by export volume than by domestic demand.
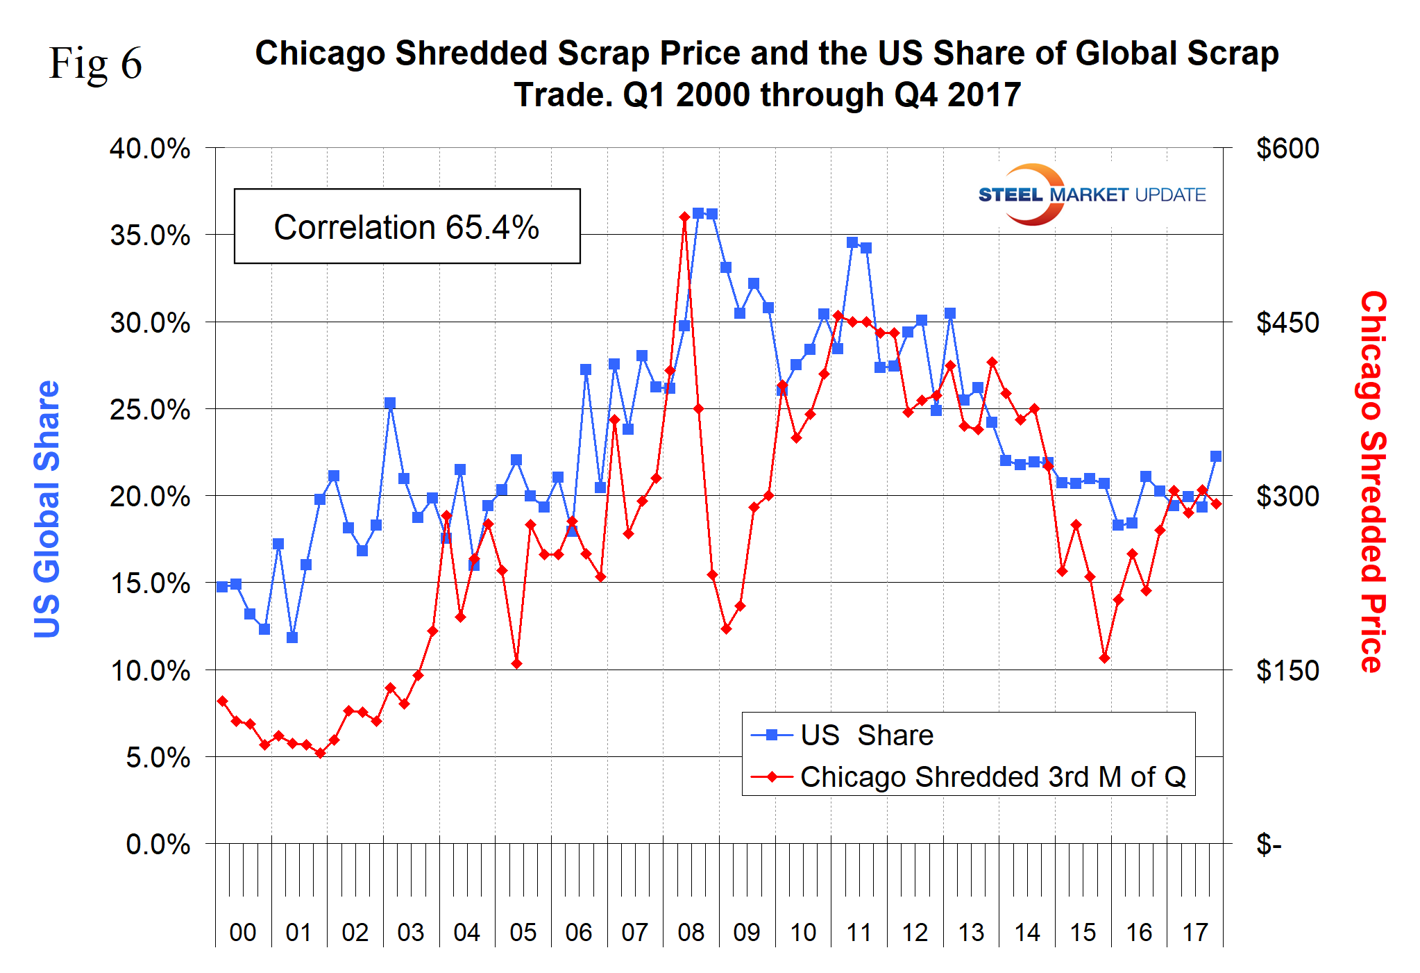
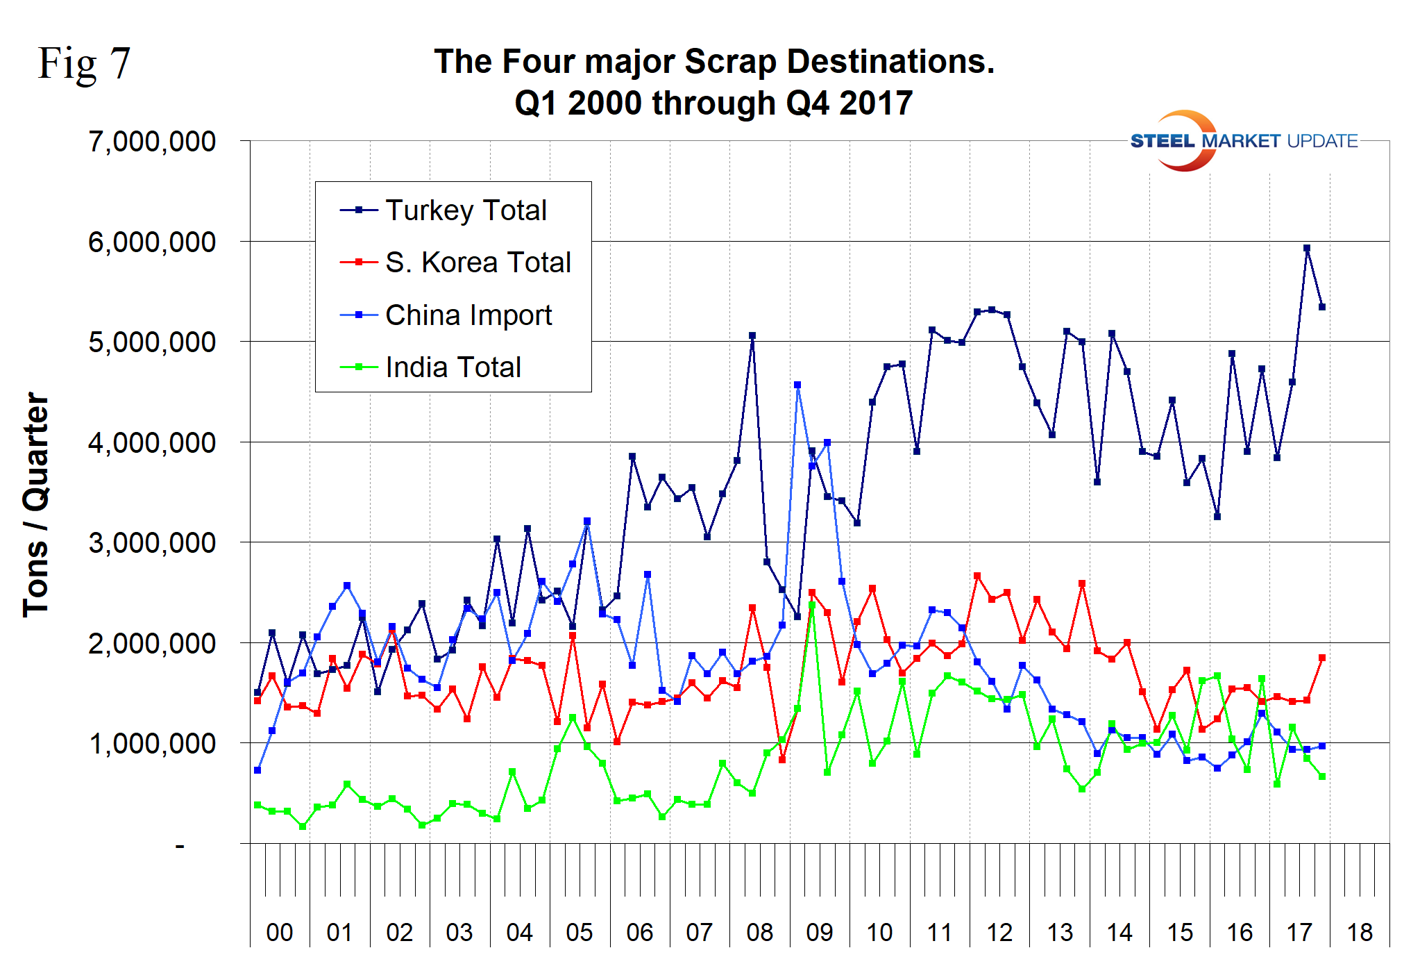
Figure 7 shows the tonnage received by the four major importing nations. Turkey is by far the largest global scrap buyer with a tonnage more than the other three combined. Their import volume was at an all-time high in Q3 2017.
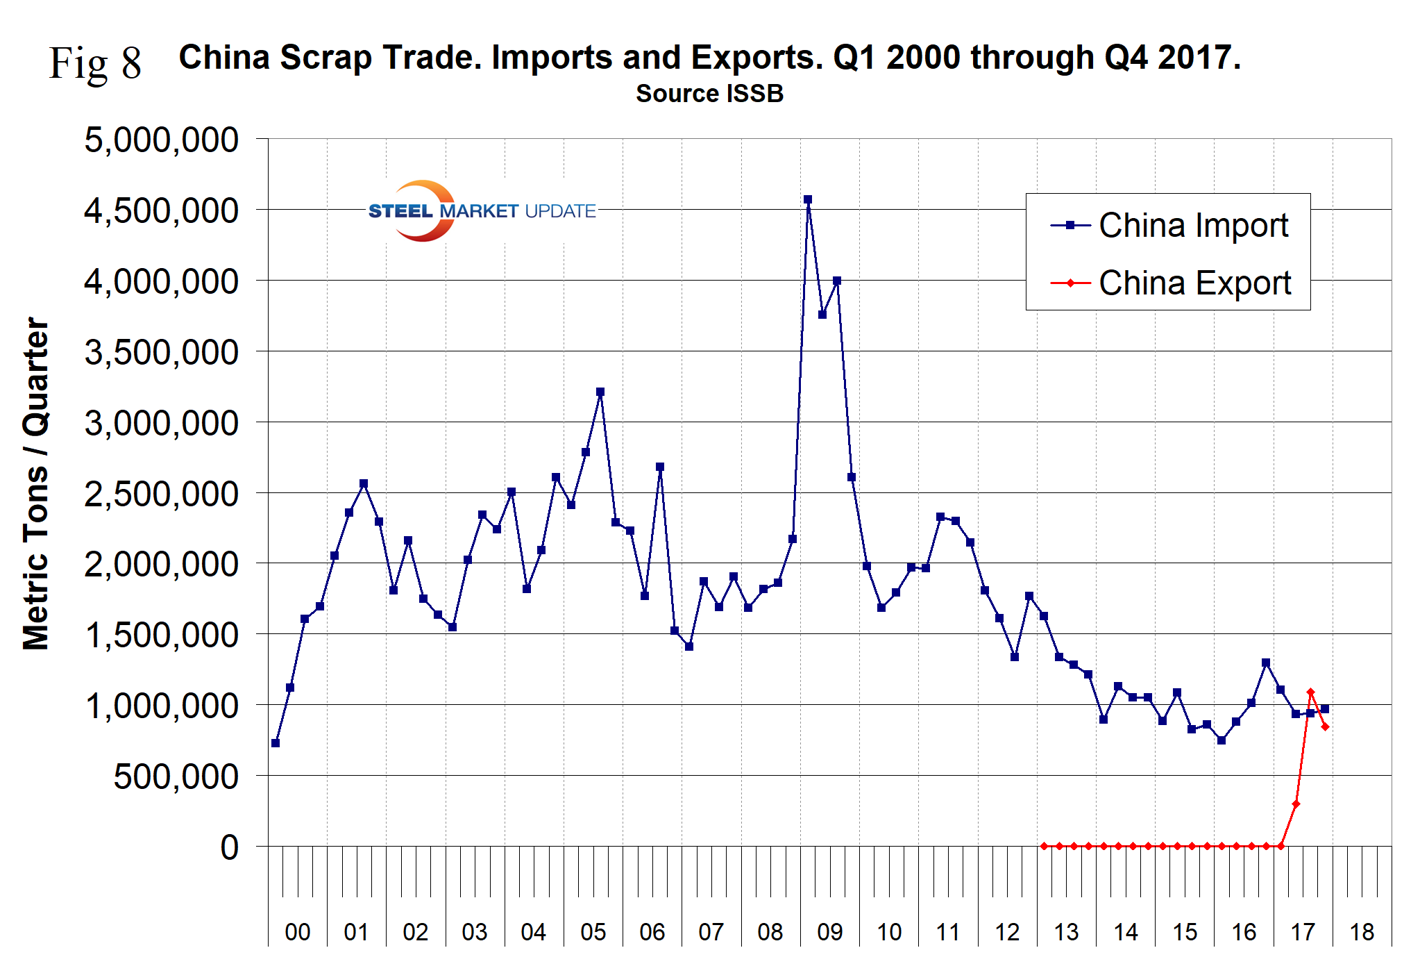
China’s scrap imports have been fairly consistent in the last three and a half years. The most significant information in the second half of 2017 is that China’s scrap exports have finally taken off and in Q3 2017 their exports exceeded their imports. Exports surged from virtually zero to 279,000 tons in Q2, to 1,090,000 tons in Q3, before declining to 842,000 tons in Q4 (Figure 8). This is still a small volume, but we expect China to totally disrupt the global scrap market before the end of this decade as the massive consumption of steel within China begins to generate ever-increasing obsolete volumes.
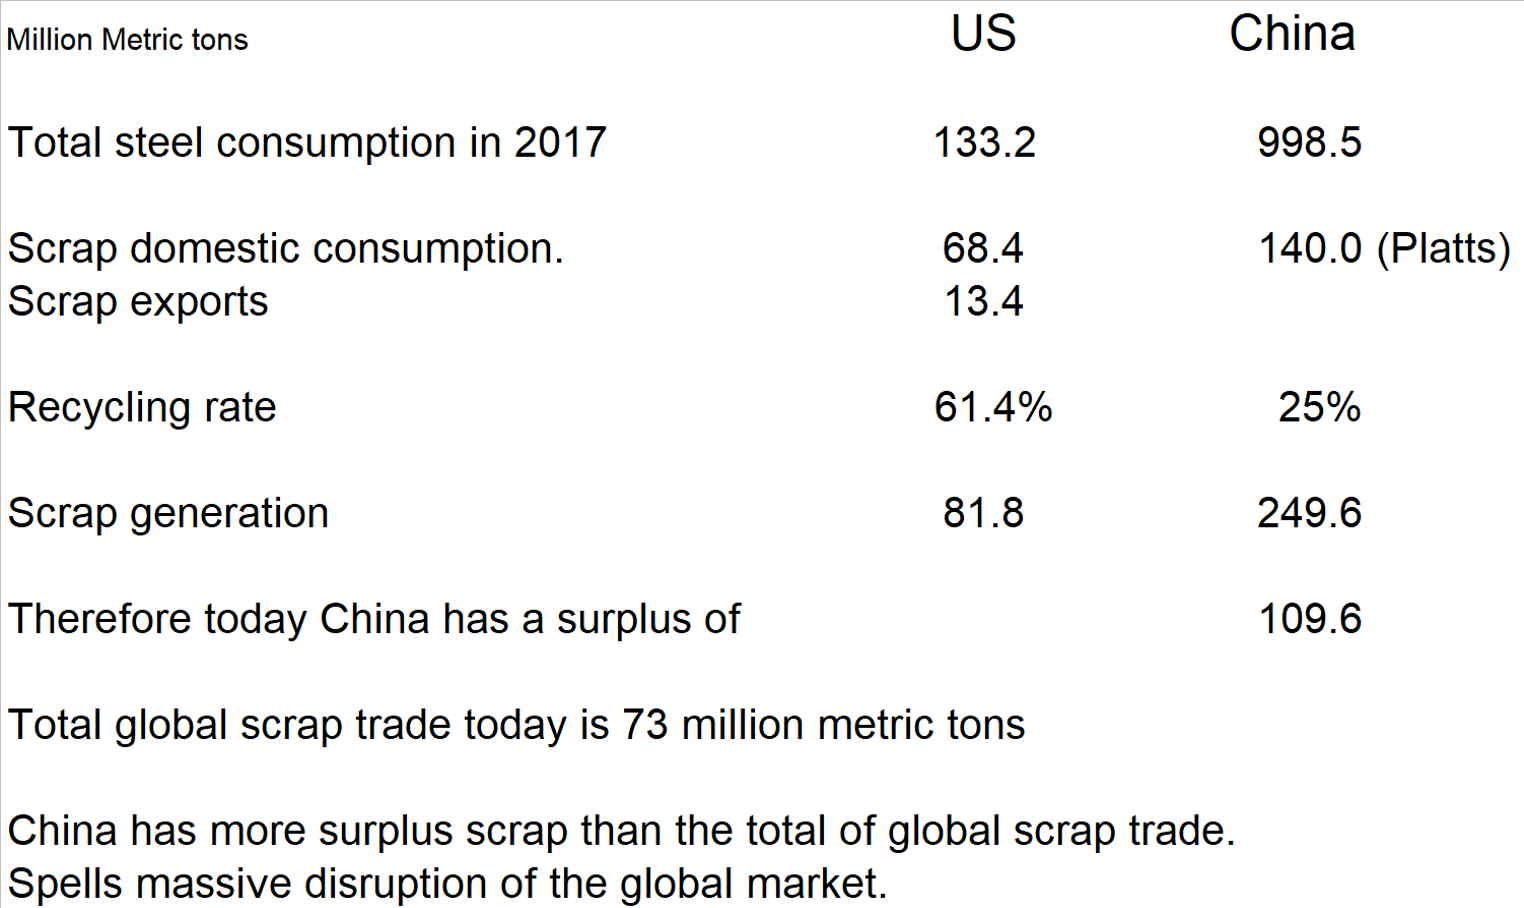
The chart below shows an estimated scrap balance for the U.S. and China. The recycling rate in the U.S. is 61.4 percent. We have assumed a rate of 25 percent in China because a high proportion of their consumption is in construction, which has a longer service life than manufactured products. Even so, China has a greater internal scrap surplus than the total of global scrap trade. China’s steel production is 93 percent BOF, and the government has recently shut most or all the country’s induction furnace capacity due to pollution problems. In the long run, China will reduce its dependence on iron ore in preference for scrap, but considering their already huge surplus in capacity, new investments in EAFs can be expected to be slow.
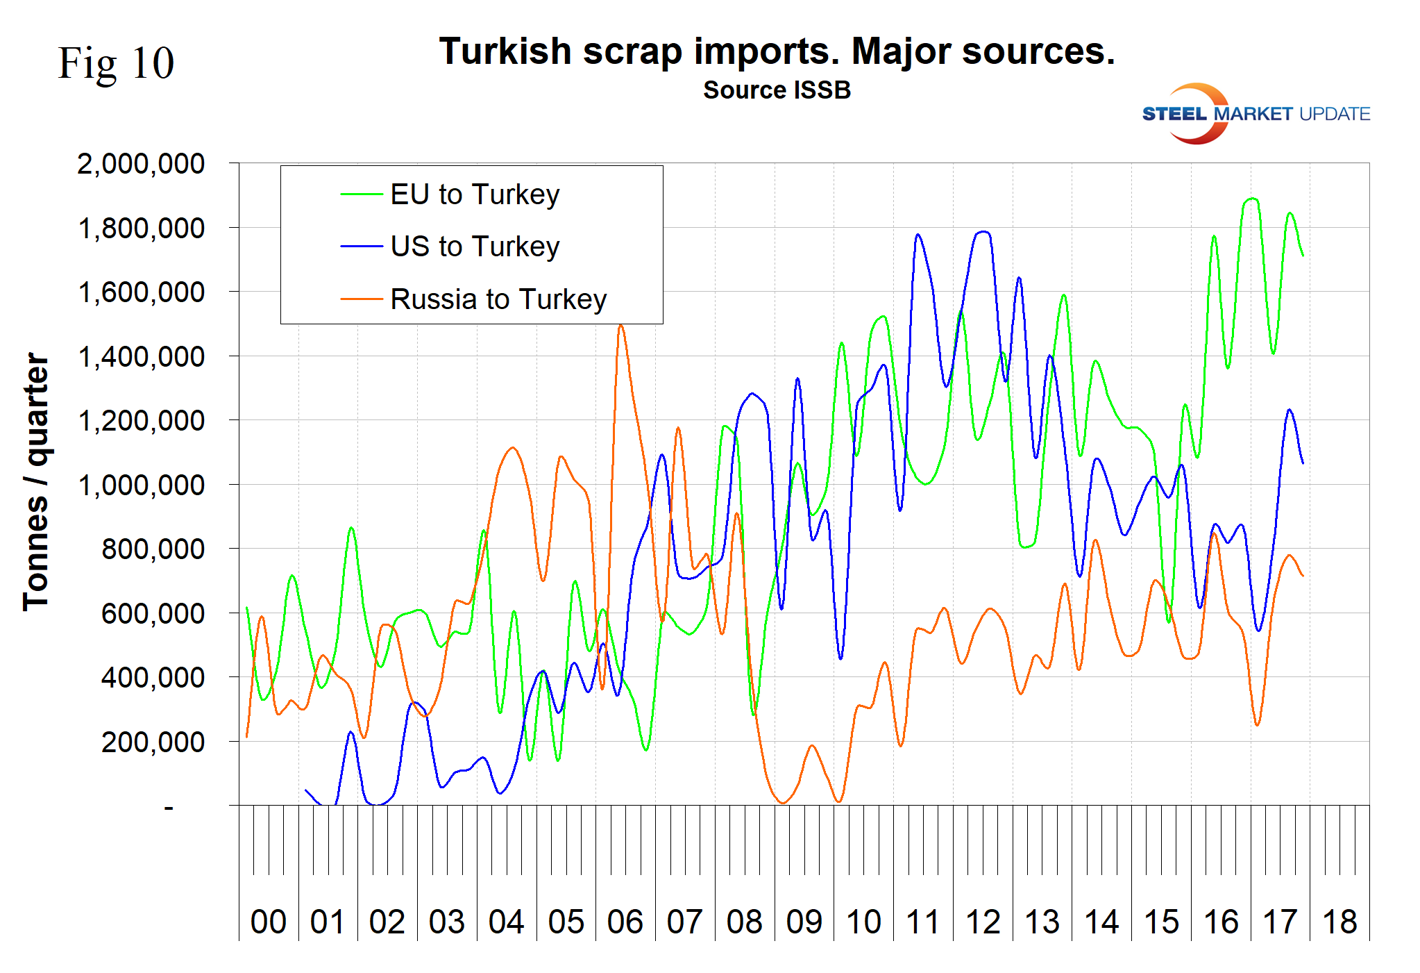
Turkey’s import tonnage declined in 2014 and 2015 and bounced back strongly in 2016 and 2017 to an all-time high of 5.9 million tons in Q3 2017. In the period 2010 through 2013, Turkey purchased a similar tonnage from the U.S. as it did from the EU. But as the euro declined in U.S. dollar terms, EU scrap become more attractive, and in 2016 European shipments to Turkey surged to over double the U.S. tonnage (Figure 10). In 2017, this situation began to reverse as the U.S. dollar declined in value.
SMU Comment: We see the increase in total global scrap trade and the decline of the U.S. dollar continuing, which will put upward pressure on domestic scrap prices. However, around the end of this decade, we see a huge disruption of the global scrap market as China’s scrap collection industry catches up with the rate of scrap generation. China’s steel is manufactured predominantly in basic oxygen furnaces, therefore until they get their industry in balance, scrap will be exported in huge volumes.


