Market Data

April 11, 2018
Shipments and Supply of Sheet Products through February
Written by Peter Wright
U.S. demand for steel sheet products expanded slowly through February, according to Steel Market Update’s analysis of data from the American Iron and Steel Institute (AISI) and the U.S. Department of Commerce.
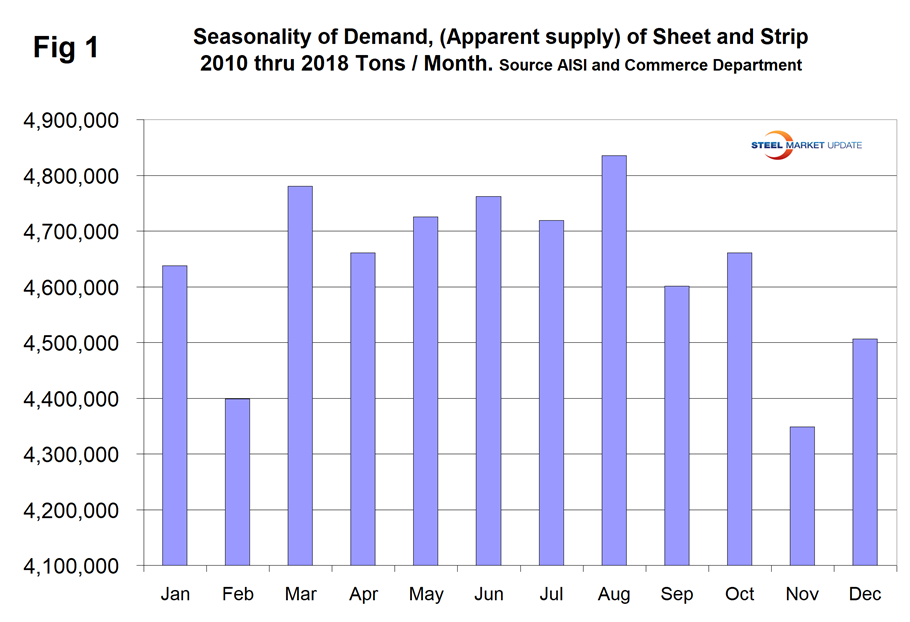
Apparent supply is a proxy for market demand. Demand momentum for sheet products in total was negative in the three months through February, but individual products varied. The overall negativity was partly a seasonal effect; on average since and including 2010, sheet supply in February has been down by 5.2 percent because of reduced days. In 2018, the decline was 7.0 percent, therefore a little worse than normal for this time of year.
Figure 1 shows the seasonality that has existed since January 2010.
This report summarizes total steel supply by product from 2003 through February 2018 and year-on-year changes. It then compares domestic mill shipments with total supply to the market. It quantifies market direction by product and enables a side-by-side comparison of the degree to which imports have absorbed demand.
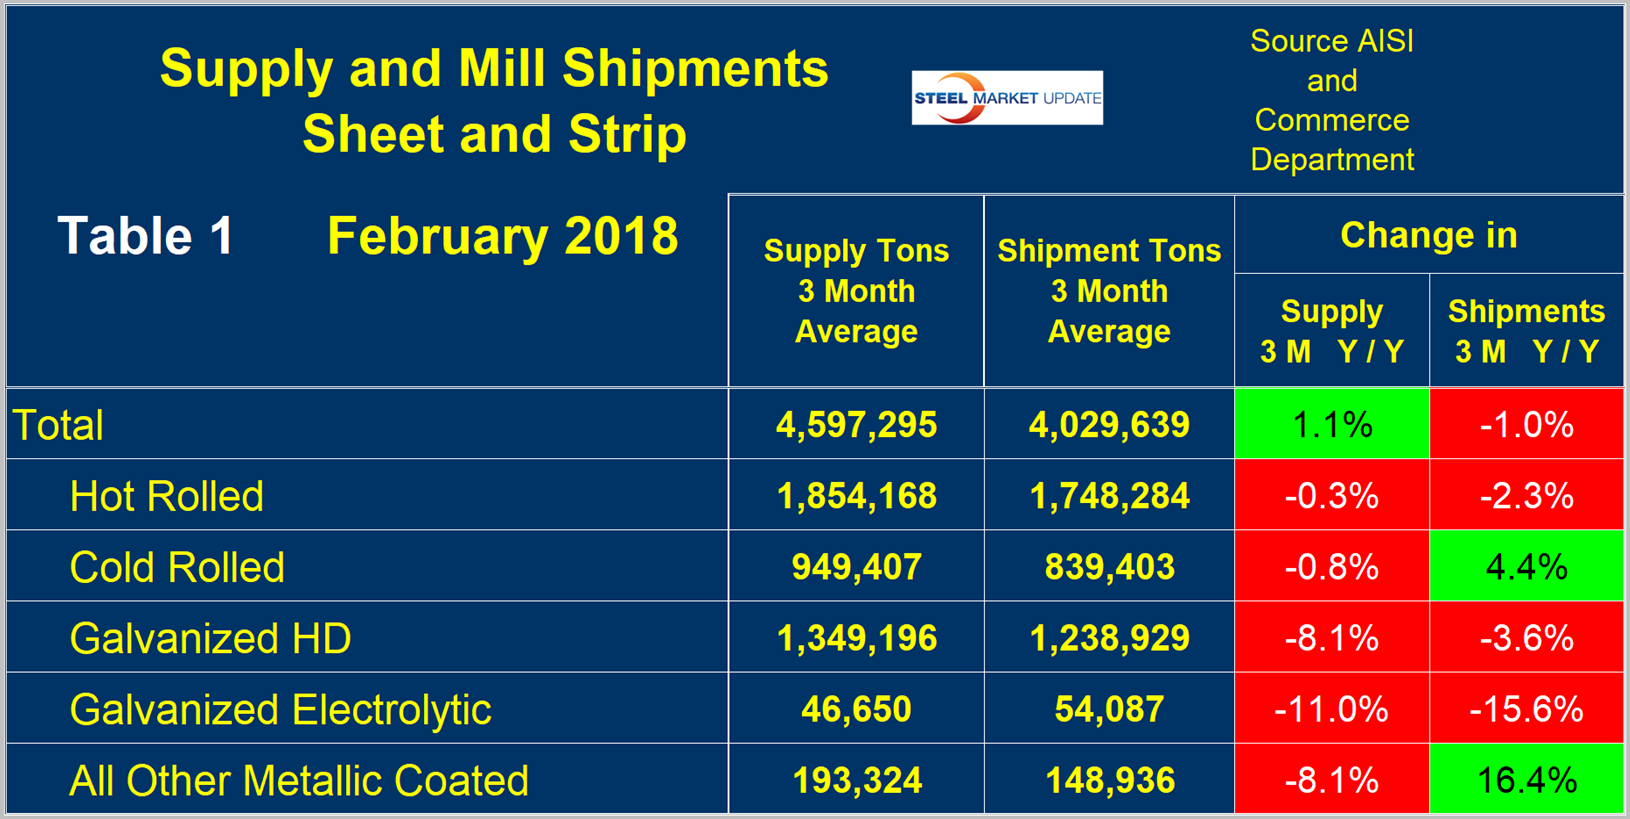
Table 1 describes both apparent supply and mill shipments of sheet products (shipments includes exports) side by side as three-month averages through February with year-over-year growth rates for each. The data in the column “3 months supply year / year” looks wrong because the total is positive and all the components are negative. This is because the total includes black plate, tin plate, tin free steel and electrical sheet and strip. Comparing the year-over-year time periods, total supply to the market increased by 1.1 percent and mill shipments were down by 1.0 percent. Table 1 breaks down the total into product detail and shows that imports were less of a factor for cold rolled and other metallic coated. A review of supply and shipments separately for individual sheet products is given below.
Apparent Supply
Apparent supply is defined as domestic mill shipments to domestic locations plus imports. In the three months through February 2018, the average monthly supply of sheet and strip was 4.597 million tons, up by 0.8 percent year to date but down by 2.1 percent in the three months through February compared to three months through November. There is no seasonal manipulation of any of these numbers. By definition, year-over-year comparisons have seasonality removed, but 3M/3M comparisons do not. Table 2 shows the change in supply by product on this basis through February.
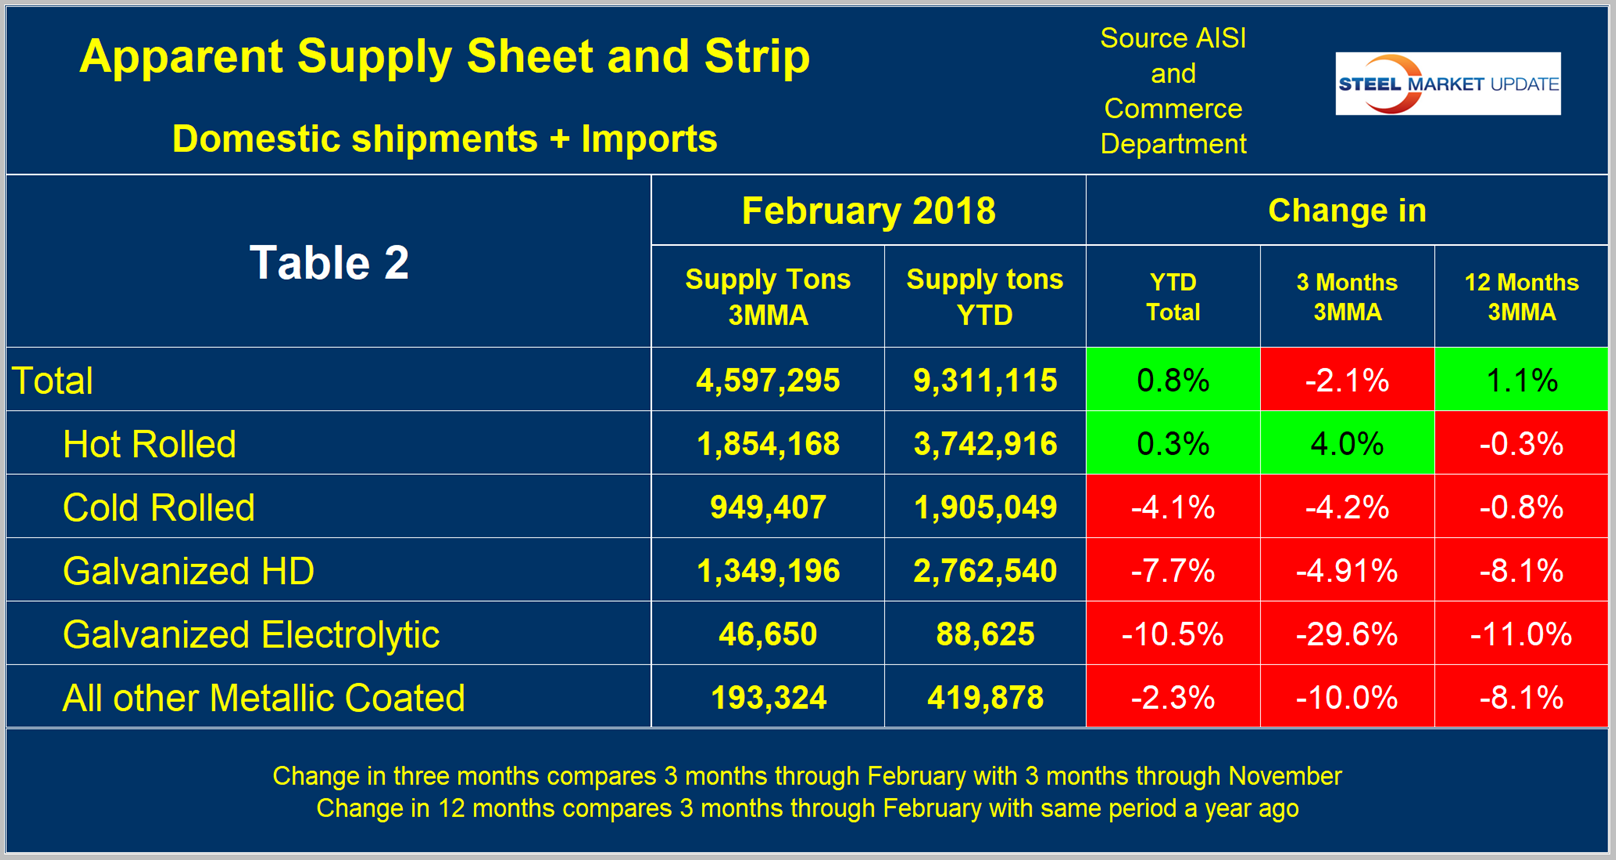
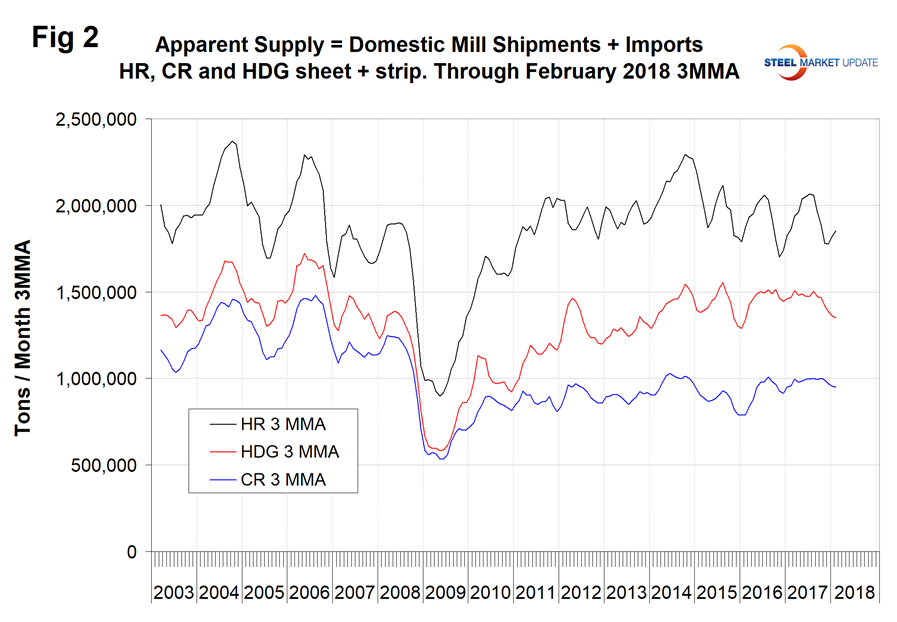
Figure 2 shows the long-term supply picture for the three major sheet and strip products, HRC, CRC and HDG, since January 2003 as three-month moving averages.
Mill Shipments
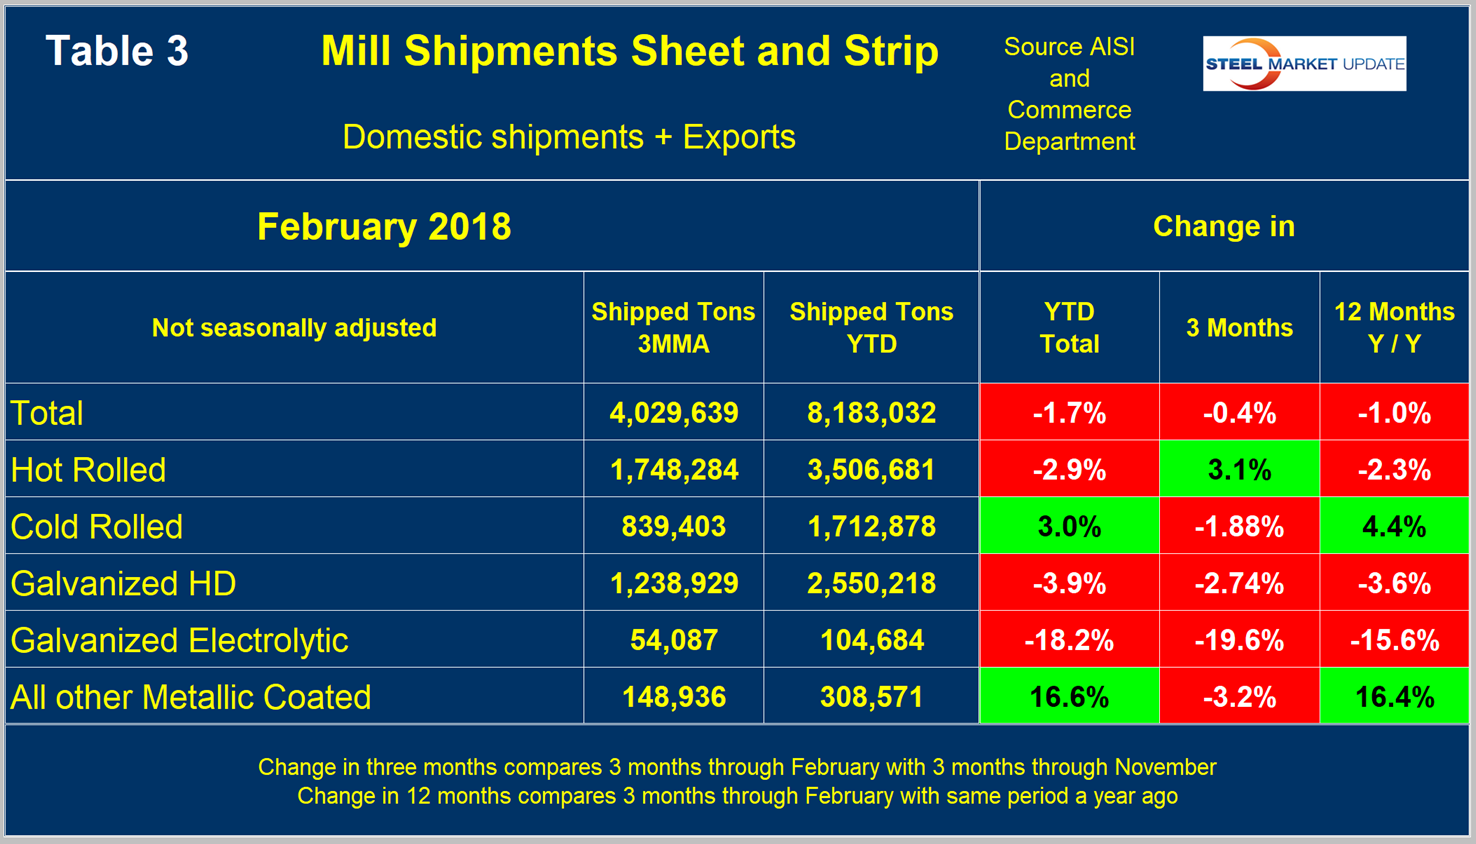
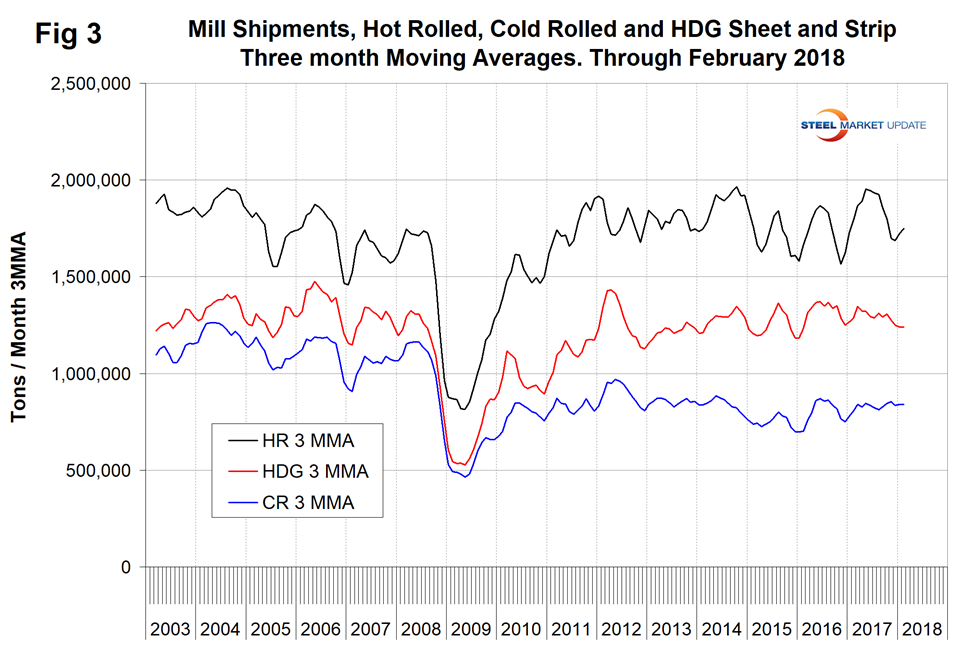
Table 3 shows that total shipments of sheet and strip products including hot rolled, cold rolled and all coated products decreased by 1.7 percent year to date and were down by 0.4 percent in three months through February compared to three months through November. The negative growth in three months through February compared to three months through November is largely a seasonal effect as described above. Other metallic coated has had very strong shipment growth year to date. Figure 3 puts the shipment results for the three main products into the long-term context since January 2003.
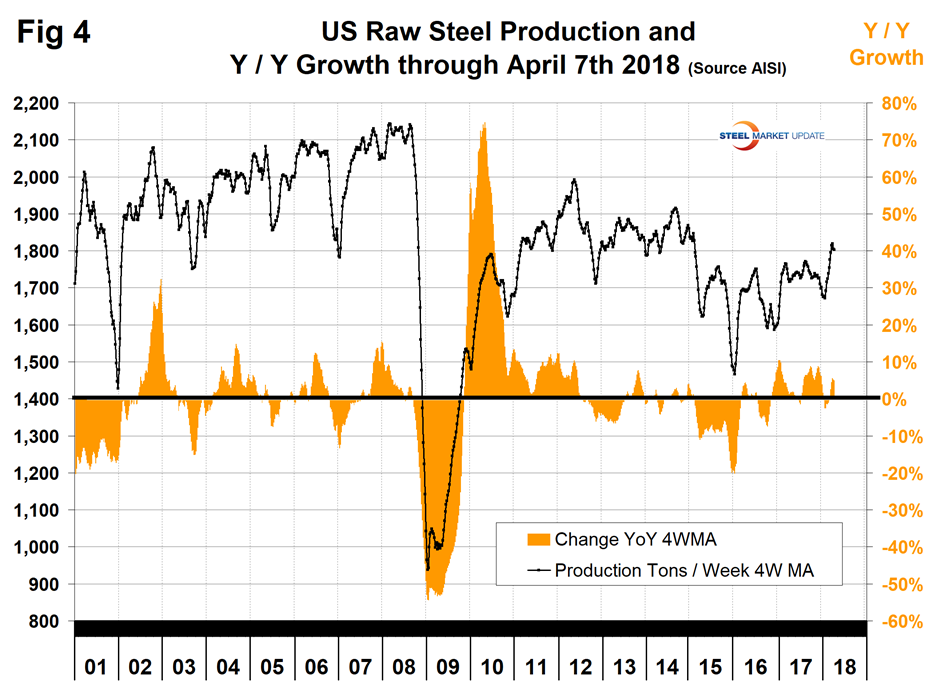
SMU Comment: One problem with this data is that it’s now well into April and the latest information we have for shipments and supply is for February. AISI puts out weekly data for crude steel production, the latest for which was the week ending April 7. This provides the most current data for steel mill activity. Figure 4 shows the year-over-year change in weekly crude output on a four-week moving average basis. Growth became positive year-over-year in the week ending July 15, 2017, and was greater than 5.0 percent every week from July 29 through Dec. 23. Growth became briefly negative from mid-January through the end of February 2018, which shows up in the data through February described above. Based on the strength of the economic indicators analysis that SMU performs and our proprietary measure of buyer sentiment, we are expecting demand for sheet products to increase in the first half of 2018.