Market Data

April 12, 2018
SMU SC Spot Pricing Index Showing Early Cracks in Price Foundation?
Written by John Packard
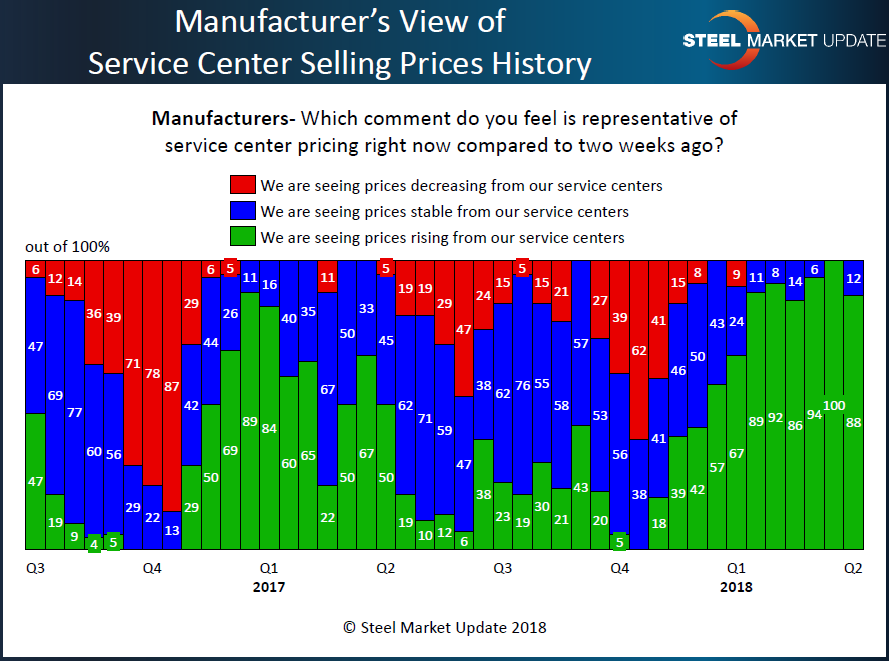
Since the beginning of the New Year, manufacturing companies and steel service centers have been reporting service center spot pricing to their end customers as rising. Just a few weeks ago, 100 percent of the manufacturers responding to our mid-March flat rolled steel market trends questionnaire reported distributor prices as rising. Last week, Steel Market Update conducted our early April analysis and we found 88 percent of the manufacturing companies still reporting distributor spot prices as rising.
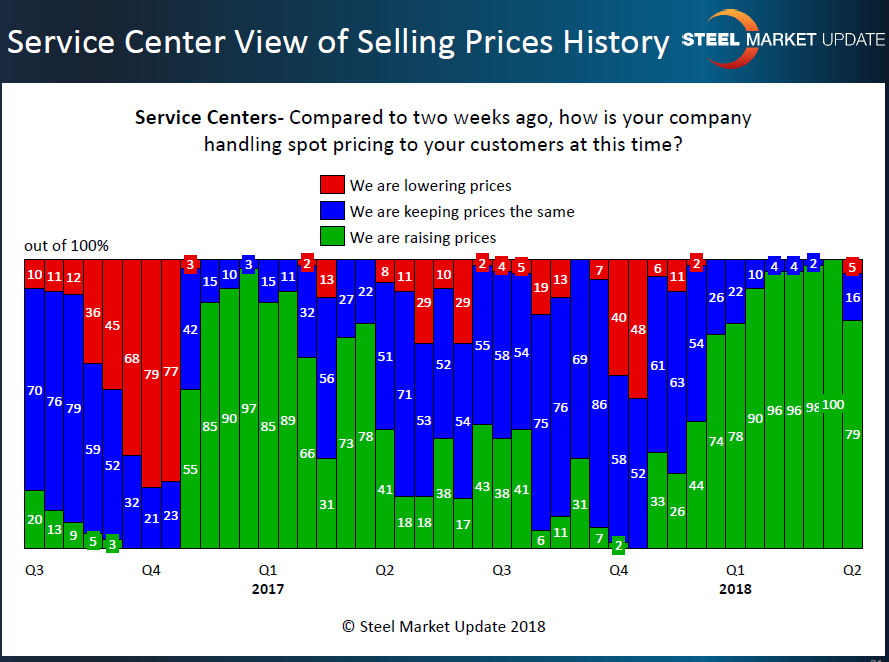
Service centers, who reported rising spot prices unanimously during our mid-March analysis, saw those reporting rising prices slide slightly to 79 percent this past week. For the first time since late fourth quarter, we found 5 percent of the distributors reporting their company as lowering spot prices. The balance (16 percent) told SMU steel spot prices were the same as what was reported in mid-March.
The 21 percent drop in those reporting rising spot prices is significant and may be the harbinger of a transitioning market. SMU will be watching this carefully during our mid-April analysis time period, which will begin on Monday of next week.
In the meantime, the SMU Price Momentum Indicator continues to point toward Higher steel prices over the next 30 days.