Analysis

April 16, 2018
February Heating and Cooling Equipment Shipment Data
Written by Brett Linton
Below is the latest data released by the the Air-Conditioning, Heating, and Refrigeration Institute (AHRI) regarding residential and commercial heating and cooling equipment shipments through February 2018. You may read the press release on their website here.
Residential Storage Water Heaters
U.S. shipments of residential gas storage water heaters for February 2018 increased 1.4 percent, to 378,045 units, up from 372,724 units shipped in February 2017. Residential electric storage water heater shipments increased 5.3 percent in February 2018, to 356,416 units, up from 338,410 units shipped in February 2017.
Year-to-date U.S. shipments of residential gas storage water heaters increased 4.5 percent, to 765,990, compared to 732,857 shipped during that same period in 2017. Residential electric storage water heater shipments increased 2.6 percent year-to-date, to 713,781 units, compared to 695,804 shipped during the same period in 2017.
Commercial Storage Water Heaters
Commercial gas storage water heater shipments decreased 12.6 percent in February 2018, to 7,829 units, down from 8,953 units shipped in February 2017. Commercial electric storage water heater shipments decreased 6.3 percent in February 2018, to 10,613 units, down from 11,331 units shipped in February 2017.
Year-to-date U.S. shipments of commercial gas storage water heaters decreased 1.7 percent, to 15,514 units, compared with 15,785 units shipped during the same period in 2017. Year-to-date commercial electric storage water heater shipments decreased 2 percent, to 21,442 units, up from 21,876 units shipped during the same period in 2017.
Warm Air Furnaces
U.S. shipments of gas warm air furnaces for February 2018 increased 13.5 percent, to 208,815 units, up from 184,013 units shipped in February 2017. Oil warm air furnace shipments decreased 8.7 percent, to 2,396 units in February 2018, down from 2,623 units shipped in February 2017.
Year-to-date U.S. shipments of gas warm air furnaces increased 13.4 percent, to 471,559 units, compared with 416,010 units shipped during the same period in 2017. Year-to-date U.S. shipments of oil warm air furnaces increased 0.5 percent, to 5,622 units, compared with 5,593 units shipped during the same period in 2017.
Central Air Conditioners and Air-Source Heat Pumps
U.S. shipments of central air conditioners and air-source heat pumps totaled 515,936 units in February 2018, up 10.2 percent from 468,164 units shipped in February 2017. U.S. shipments of air conditioners increased 5.2 percent, to 307,522 units, up from 292,446 units shipped in February 2017. U.S. shipments of air-source heat pumps increased 18.6 percent, to 208,414 units, up from 175,718 units shipped in February 2017.
Year-to-date combined shipments of central air conditioners and air-source heat pumps increased 7.2 percent, to 998,607, up from 931,226 units shipped in February 2017. Year-to-date shipments of central air conditioners increased 1.8 percent, to 574,379 units, up from 564,400 units shipped during the same period in 2017. The year-to-date total for heat pump shipments increased 15.6 percent, to 424,228, up from 366,826 units shipped during the same period in 2017.
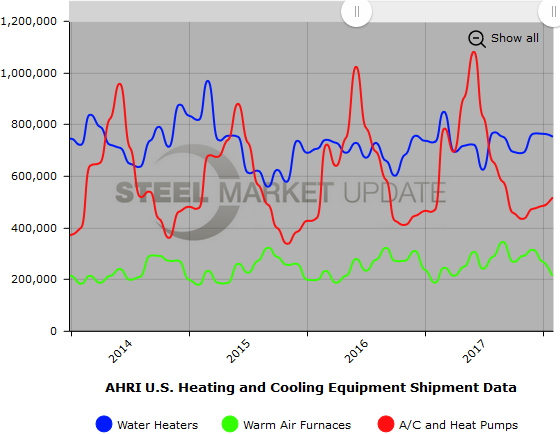
Below is a graph showing the history of water heater, warm air furnace, and air conditioner shipments. You will need to view the graph on our website to use it’s interactive features; you can do so by clicking here. If you need assistance with either logging in or navigating the website, please contact our office at 800-432-3475 or info@SteelMarketUpdate.com.