

Market Data

April 30, 2018
Manufacturing Indicators Point to Strong First Half
Written by Peter Wright
Indicators of manufacturing activity point to a strong first half for the U.S. economy and the steel industry.
This report summarizes seven data sources that describe the state of manufacturing in the United States. We have reported on most of these separately in our Steel Market Update publications, and therefore will be brief in this summary. We don’t expect these data sources to all point in the same direction. Our intent in summarizing them in one document is to provide a consensus of the state of this critical steel consumption sector. Based on American Iron and Steel Institute estimates of steel mill shipments by market classification, almost 50 percent of the steel consumed in the U.S. is manufacturing-oriented. This breaks down to about 27 percent in ground transportation including infrastructure, 9 percent in machinery and equipment, 5 percent in appliances, 4 percent in defense and about 4 percent in containers.
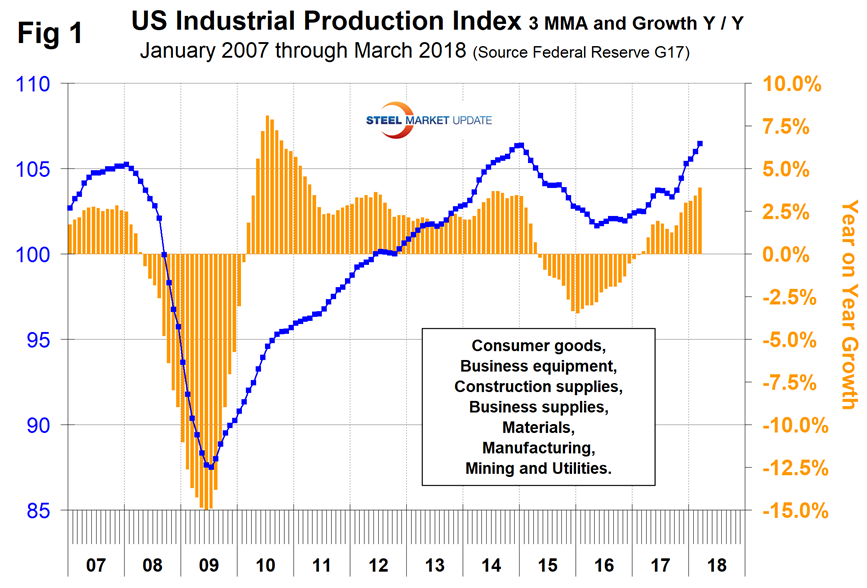
The Industrial Production Index: Figure 1 shows the IP index since January 2007 with the year-over-year growth. The three-month moving average (3MMA) had negative growth every month from October 2015 through December 2016 as shown by the brown bars in Figure 1. January 2017 was the first month of positive growth in the 3MMA since August 2015. Growth has improved on a year-over-year basis every month since September 2017. Manufacturing capacity utilization improved from 74.57 in March last year to 75.61 in March 2018, also on a 3MMA basis.
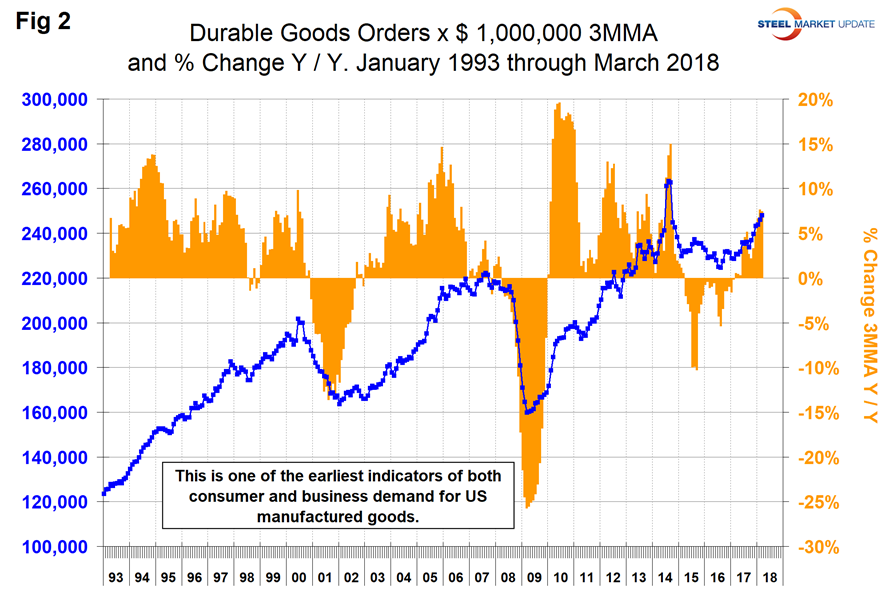
New Orders for Durable Goods: The U.S. Census Bureau announced on Thursday that new orders for manufactured durable goods in March increased by 0.8 percent on a 3MMA basis month over month and were up by 7.5 percent year over year. Figure 2 shows the 3MMA of monthly orders for durable goods since January 2010 and that the percent change year over year was the highest since September 2014.
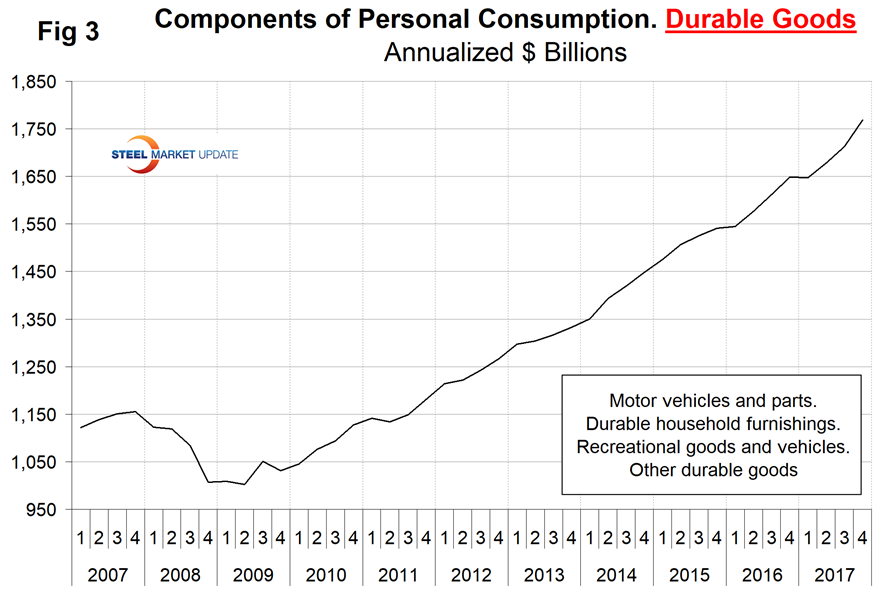
The Durable Goods Portion of GDP: The third estimate of Q4 2017 GDP came in at 2.87 percent annualized growth, which was down from 3.16 percent in Q3. A subcomponent of the quarterly data is durable goods, which is part of the personal consumption calculation. It therefore contains no military hardware or civil aircraft data. This is shown in Figure 3 and, presumably because of the exclusions just mentioned, looks nothing like Figure 2. Except for one quarter, Q1 2017, the durable goods portion of GDP has had positive growth every quarter since Q2 2011 and in Q4 2017 was 3.25 percent.
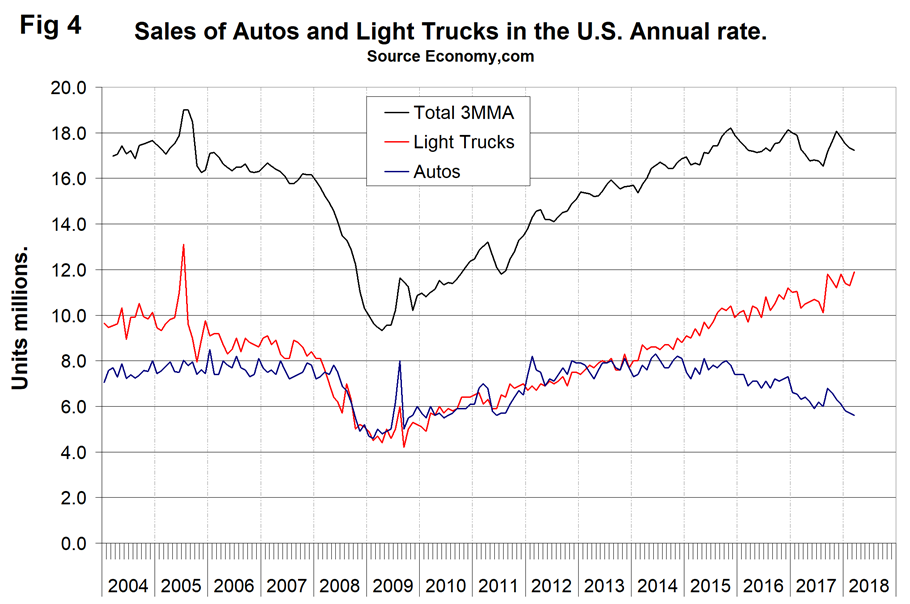
Light Vehicle Production in NAFTA: Our past reports have included auto assembly data for the U.S., Canada and Mexico, but that source has dried up, so until we find a replacement we are reporting on U.S. auto sales. Automobile sales have trended down slightly in the last two years but in March were up by 5.4 percent year over year. Sales are still strong on a historical basis. The data behind Figure 4 includes imports, which had a market share of 21.7 percent in March, up from a recent low of 20.5 percent in March last year. The consumer preference for light trucks, which includes SUVs and crossovers, is still increasing.
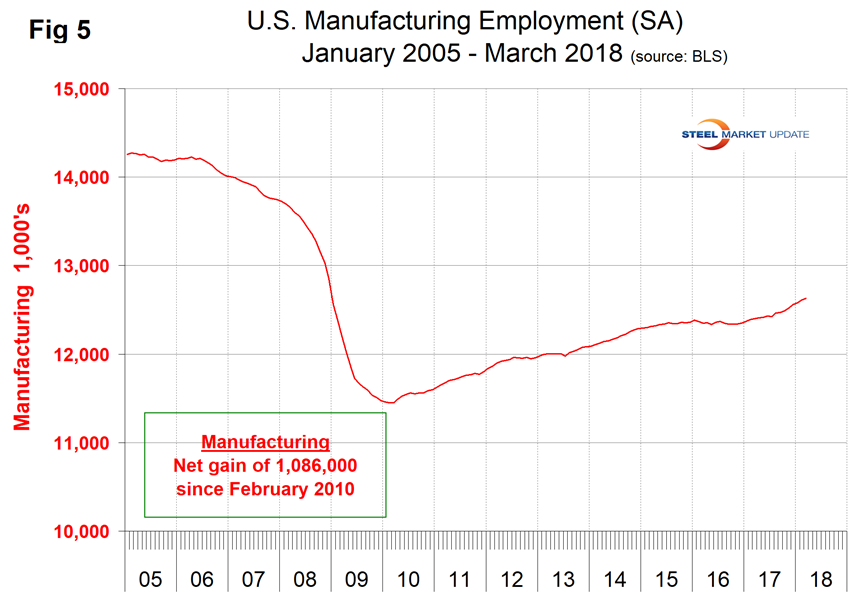
Manufacturing Employment: Manufacturing employment plummeted during the recession and gradually improved from the spring of 2010 through 2014. Growth was flat in 2015 and declined slightly in 2016 when 23,000 jobs were lost during the year as a whole. There was a turnaround in 2017, and in the eight months August 2017 through March 2018 208,000 jobs were created in manufacturing (Figure 5). The motor vehicles and parts subcomponent of manufacturing employment had a net gain of 34,000 in the same time frame.
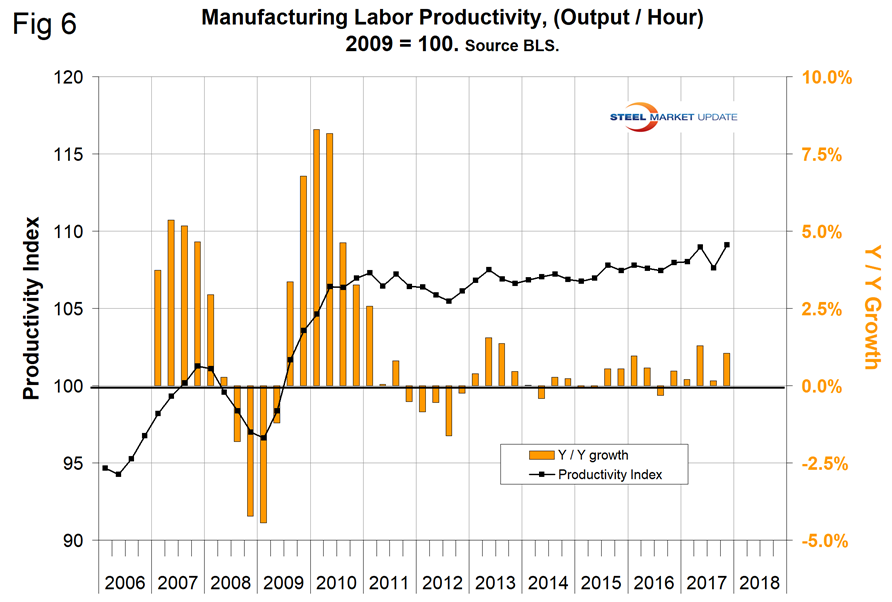
Manufacturing Productivity: The Bureau of Labor Statistics reported that in Q4 2017 manufacturing productivity improved by 1.1 percent year over year (Figure 6). Productivity growth was erratic in 2017, but there has been a gradual improvement for three years.
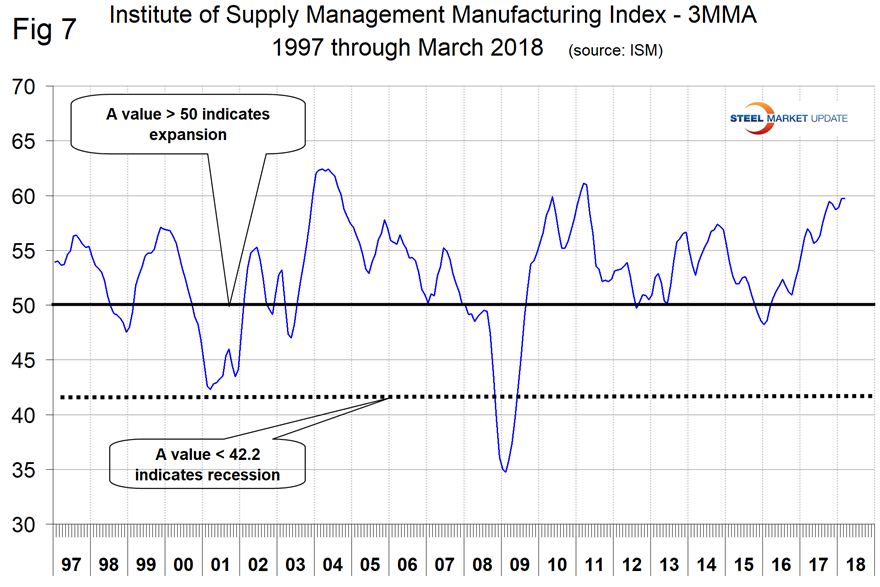
The ISM Manufacturing Index: The Institute for Supply Management’s Manufacturing Index is a diffusion index. ISM states: “Diffusion indexes have the properties of leading indicators and are convenient summary measures showing the prevailing direction of change and the scope of change. An index value above 50 percent indicates that the manufacturing economy is generally expanding; below 50 percent indicates the opposite.” Figure 7 shows the 3MMA of the ISM index from January 1997 through March 2018 with an improving trend since January 2016. In March, the 3MMA of the index at 59.73 was unchanged since February and the highest since April 2011.
On March 22, the Manufacturers Alliance for Productivity and Innovation summarized as follows: “After years of post-financial crisis struggle, the U.S. manufacturing sector finally has a range of recovery tailwinds that are catalyzing its increasingly sunny outlook. The world is now experiencing a strengthening economic rebound, with every major region enjoying stable performance. Some regions, including the Eurozone, are growing above the expectations of forecasters. The global economic rebound along with the passage of tax reform legislation in the U.S. and the resumption of a much-needed dollar depreciation that began in the early months of 2017 has given rise to the MAPI Foundation’s outlook for the best U.S. manufacturing growth performance in more than a decade.”
SMU Comment: Another excellent month for manufacturing indicators. The ISM index, to which we give the most credence, is at its strongest level since April 2011 and signaling expansion. Auto sales in the U.S. are slowing but still historically strong. The industrial production index and new orders for durable goods have positive growth. The net of these seven indicators is very positive and point to a strong first half for 2018.


