

Market Data

May 8, 2018
Service Center Spot Prices Showing Cracks in the Foundation?
Written by John Packard
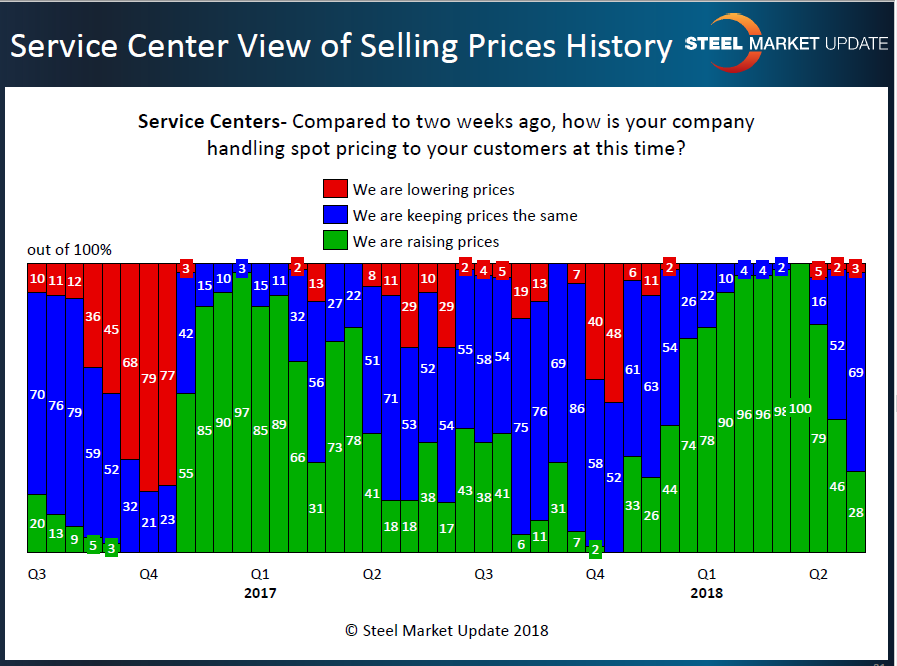
Last week, Steel Market Update conducted our early May flat rolled steel market trends survey. One of the key areas that we focus in on is the area of service center spot pricing to their end customers. We are interested in better understanding if steel distributors are raising, lowering or keeping spot prices the same as what was being offered just two weeks back.
What we have found is service centers are no longer actively raising spot prices and have instead switched to trying to keep prices steady. Only 28 percent of the distributors responding to our questions reported their company as raising prices. This is down from the 46 percent we found in mid-April and well below the 100 percent level recorded during the middle of March 2018.
Manufacturing companies were not as pessimistic and reported service centers as still raising prices. Seventy-one percent of end-users responded that spot prices out of the service centers were higher last week than they were just two weeks before. This is a bit unusual, and SMU will need to take a harder look at this data in our next survey, which will begin next Monday, May 14.
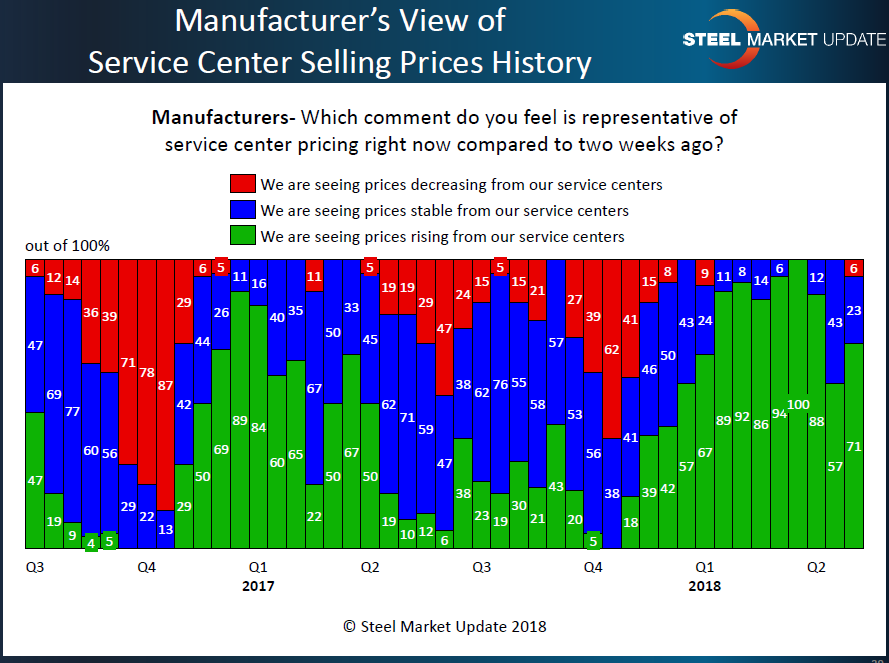
Steel Market Update is a believer that how service centers are handling spot pricing is a reflection on the ability of the steel mills to collect higher steel prices. With the mixed results we are getting from service centers and manufacturing companies, we believe this supports our SMU Price Momentum Indicator, which is currently at Neutral. A Neutral reading means we are in a transitional market with no clear momentum for prices to move higher or lower at this time.


