

Market Data
May 14, 2018
June PPI Shows Aluminum Prices Rising Even Faster Than Steel
Written by Peter Wright
Carbon steel prices have escalated at a lower rate than aluminum, but higher than plastic and wood. Truck transportation prices are rising faster than rail, according to the latest data from the Bureau of Labor Statistics. Last week, the BLS released its series of producer price indexes (PPIs) for more than 10,000 goods and materials through June. Using this information, Steel Market Update provides subscribers with a view of the competitive position of sheet steel, aluminum and plastic, as well as downstream products including beverage cans, metal buildings and pipe, along with a comparison of truck and rail transportation.
The PPIs are helpful in monitoring price direction and based on known transaction prices are a reasonable representation of the real world, though there may be a lag between the BLS reports and spot prices for steel products. We have also concluded that the actual index values of the PPIs of different products cannot be compared with one another because they are developed by different committees within the BLS. We believe this data is useful in comparing the direction of prices in the short and medium term, but not the absolute value.
The headline summary from the BLS was as follows: “Prices for final demand goods edged up 0.1 percent in June following a 1.0 percent rise in May. Leading the June increase, the index for final demand goods less foods and energy advanced 0.3 percent. Prices for final demand energy climbed 0.8 percent. In contrast, the index for final demand foods fell 1.1 percent. Product detail: A major factor in the advance in the index for processed goods for intermediate demand was prices for industrial chemicals, which rose 2.1 percent. The indexes for diesel fuel, commercial electric power, industrial electric power, thermoplastic resins and materials, and hot rolled steel sheet and strip also moved higher.”
Figure 1 shows the composite PPI of all commodities since January 2008. The index has risen steadily for 2 1/2 years, but is still not back to where it was in 2014.
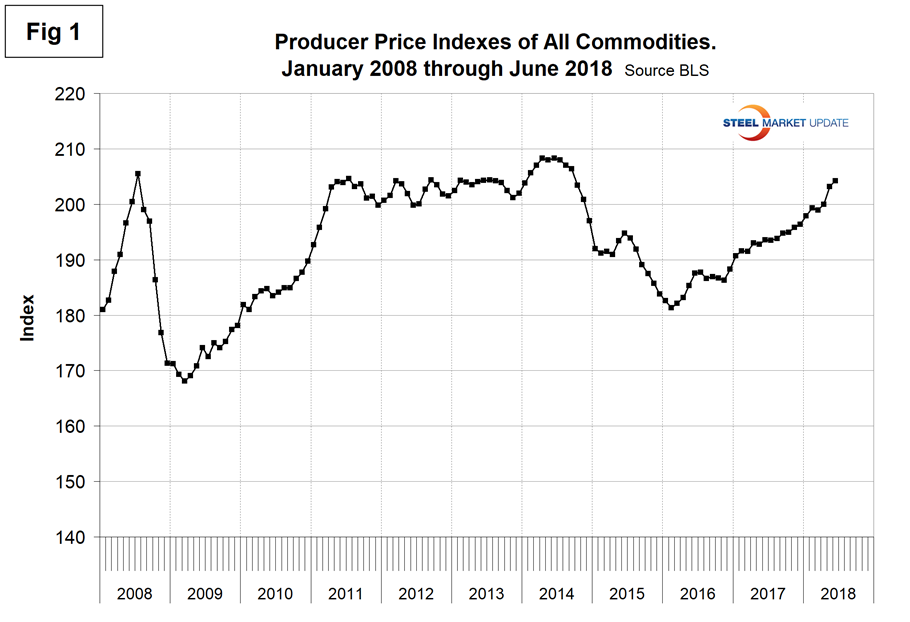
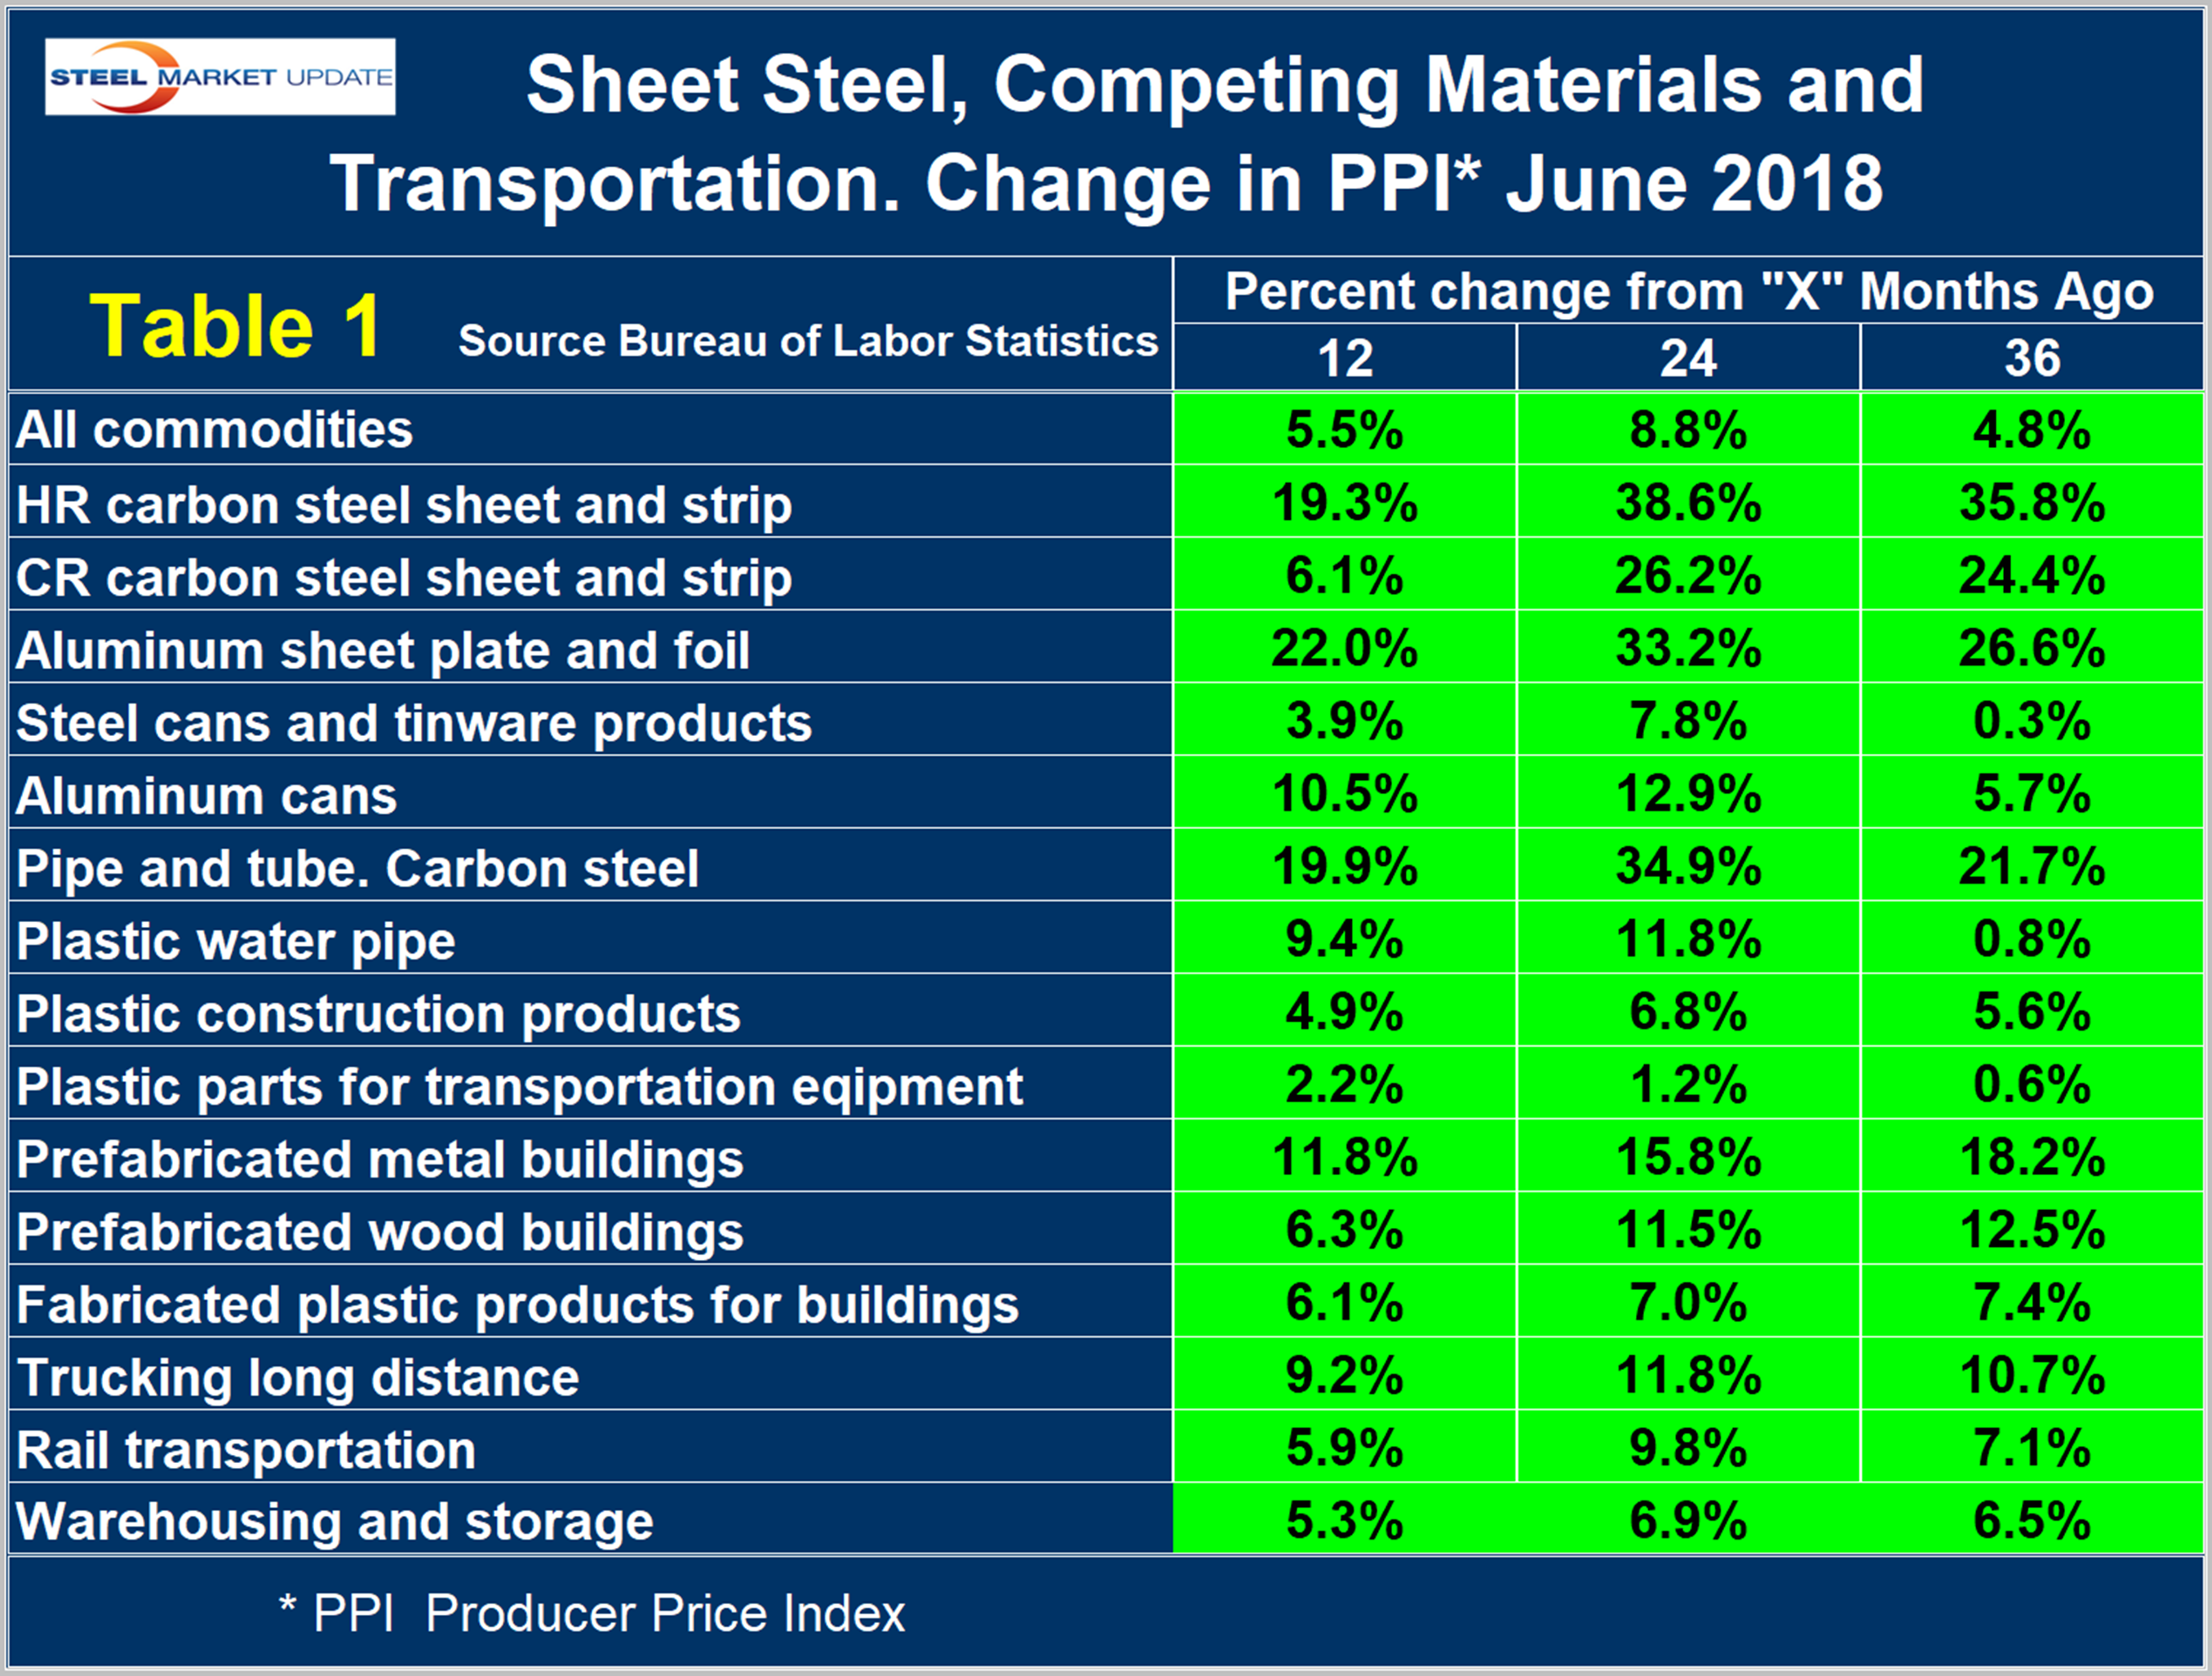
Table 1 is a summary of each category on a year over one-, two- and three-year basis. The gain/loss pattern is shown by the color codes; we interpret rising prices as positive. This table includes some other plastic products for which there is no direct steel comparison and a measure of price changes for warehousing and storage.
Some specific comparisons of steel and steel products with their competition are as follows. Please note the Y axis scales are not the same. Figure 2 shows the year-over-year comparison of the price change of cold rolled steel sheet and flat rolled aluminum. The price of aluminum sheet has escalated faster than CR steel since third quarter last year. This is the year-over-year price change. In early 2017, the rate of price increase of CR was escalating faster on a percentage basis than it is in mid-2018.
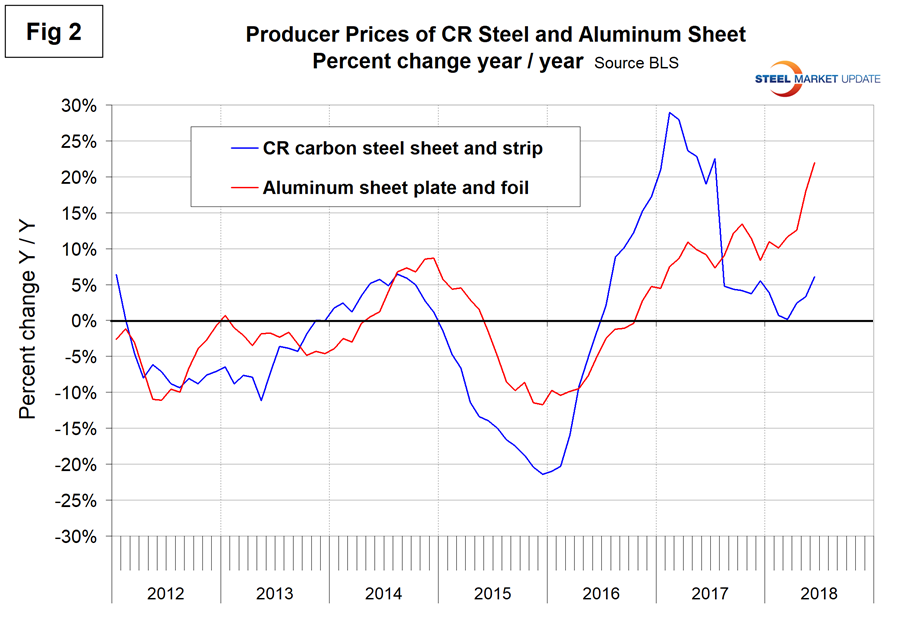
Figure 3 shows the same comparison for steel and aluminum beverage cans and supports the observations in Figure 2. Steel’s competitive position has improved since third-quarter 2017.
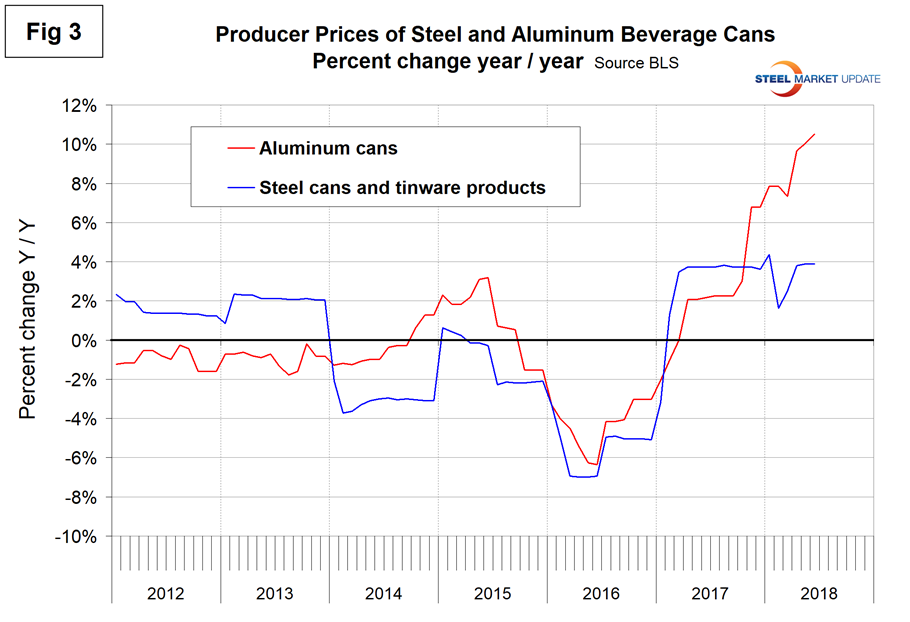
Figure 4 compares prefabricated metal with prefabricated wood buildings. From mid-2017 through February 2018, the price of wood buildings was escalating faster than steel, but that is no longer the case.
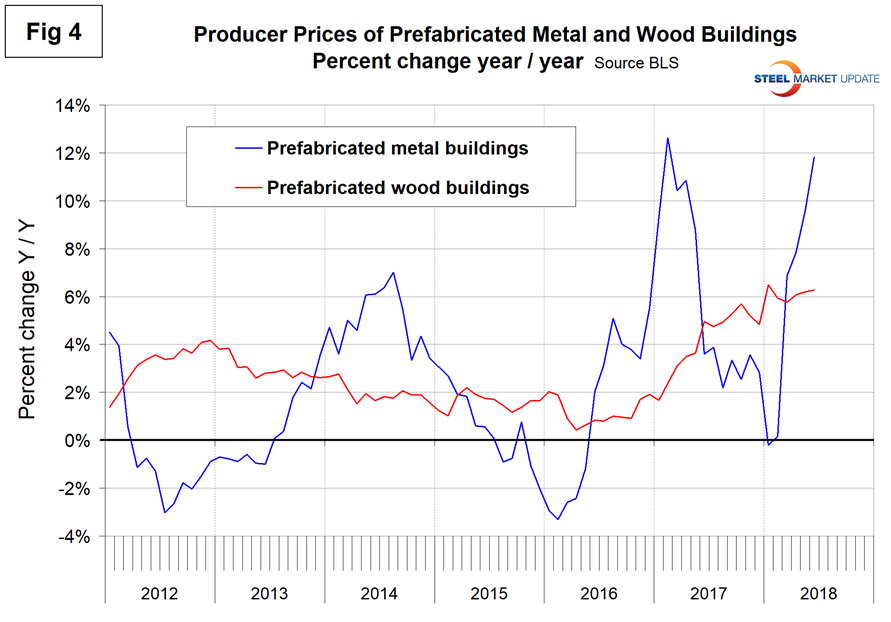
Figure 5 compares steel and plastic pipe. Carbon steel pipe is currently experiencing a higher rate of price escalation than plastic pipe.
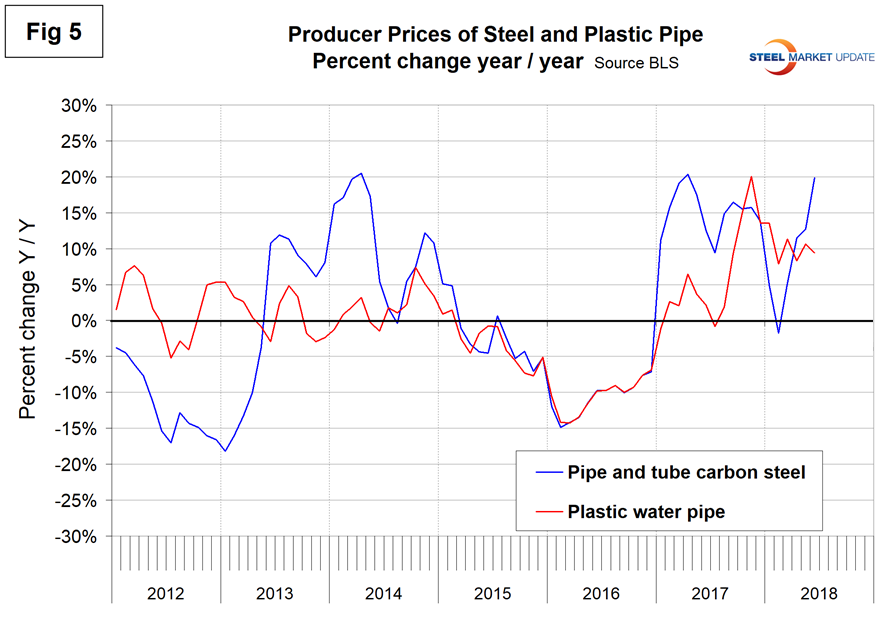
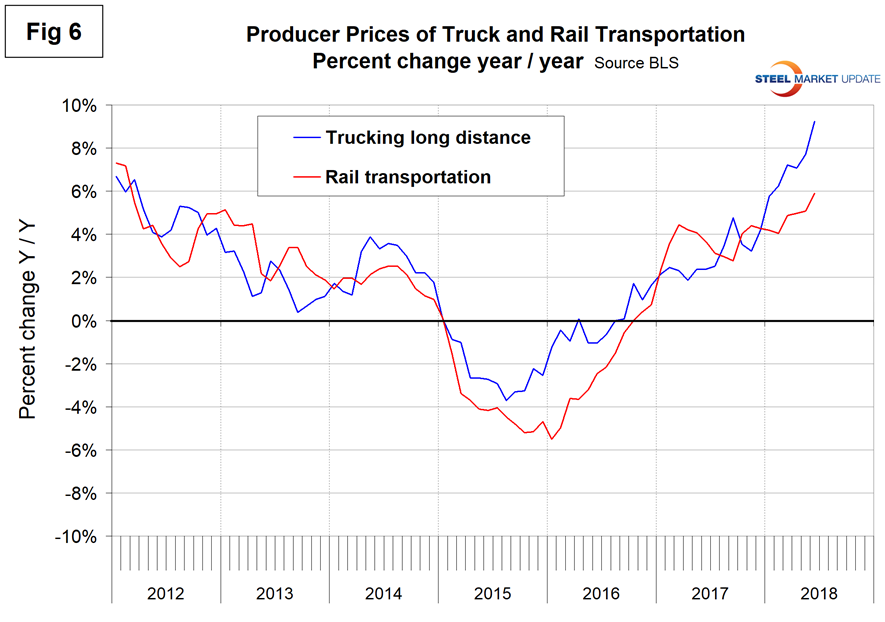
Figure 6 compares the changes in the price of truck and rail transportation. Trucking price increases have outpaced rail since last December.
The official description of this program from the BLS reads as follows: “The Producer Price Index (PPI) is a family of indexes that measure the average change over time in the prices received by domestic producers of goods and services. PPIs measure price change from the perspective of the seller. This contrasts with other measures, such as the Consumer Price Index (CPI). CPIs measure price change from the purchaser’s perspective. Sellers’ and purchasers’ prices can differ due to government subsidies, sales and excise taxes, and distribution costs. More than 10,000 PPIs for individual products and groups of products are released each month. PPIs are available for the products of virtually every industry in the mining and manufacturing sectors of the U.S. economy. New PPIs are gradually being introduced for the products of industries in the construction, trade, finance and services sectors of the economy. More than 100,000 price quotations per month are organized into three sets of PPIs: (1) stage-of-processing indexes, (2) commodity indexes, and (3) indexes for the net output of industries and their products. The stage-of processing structure organizes products by class of buyer and degree of fabrication. The commodity structure organizes products by similarity of end use or material composition. The entire output of various industries is sampled to derive price indexes for the net output of industries and their products.”


