Market Data

May 14, 2018
Shipments and Supply of Sheet Products through March
Written by Peter Wright
March was a strong month for both steel mill shipments and demand for rolled steel products, but this was partly a seasonal effect. This conclusion is based on Steel Market Update’s analysis of data from the American Iron and Steel Institute (AISI) and the U.S. Department of Commerce.
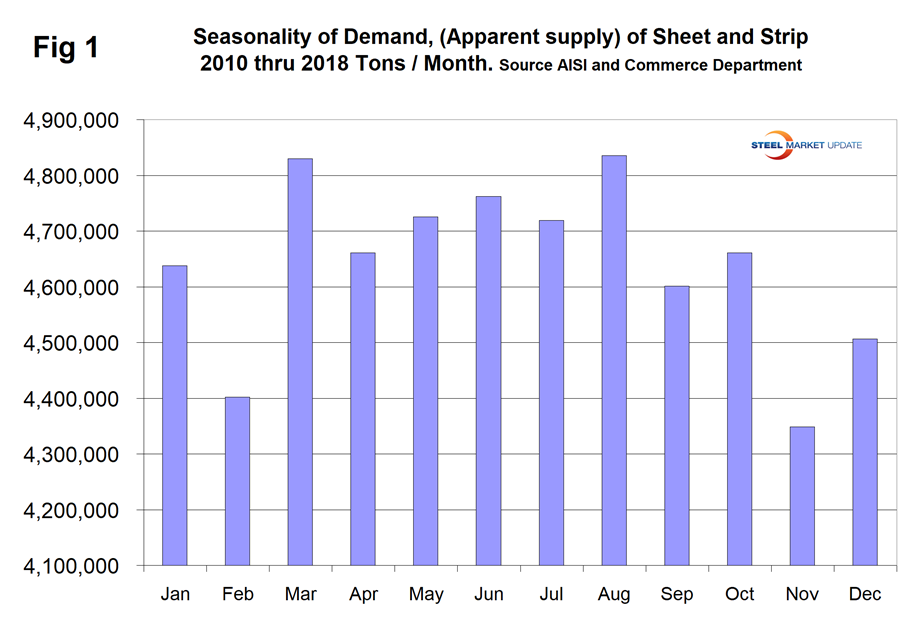
March was a good month for both total shipments and supply of steel products. Excluding semis, shipments were up by 10.4 percent and supply was up by 13.3 percent. Apparent supply is a proxy for market demand. In this analysis, we use three-month moving averages, which somewhat dilutes these good results. Which means, “let’s wait and see what April and May bring before reacting.” One consideration is that historically March has had a higher demand level than February and over the last nine years has been up by 9.7 percent on average. Figure 1 shows the seasonality that has existed since January 2010.
This report summarizes total steel supply by product from 2003 through March 2018 and year-on-year changes. It then compares domestic mill shipments with total supply to the market. It quantifies market direction by product and enables a side-by-side comparison of the degree to which imports have absorbed demand.
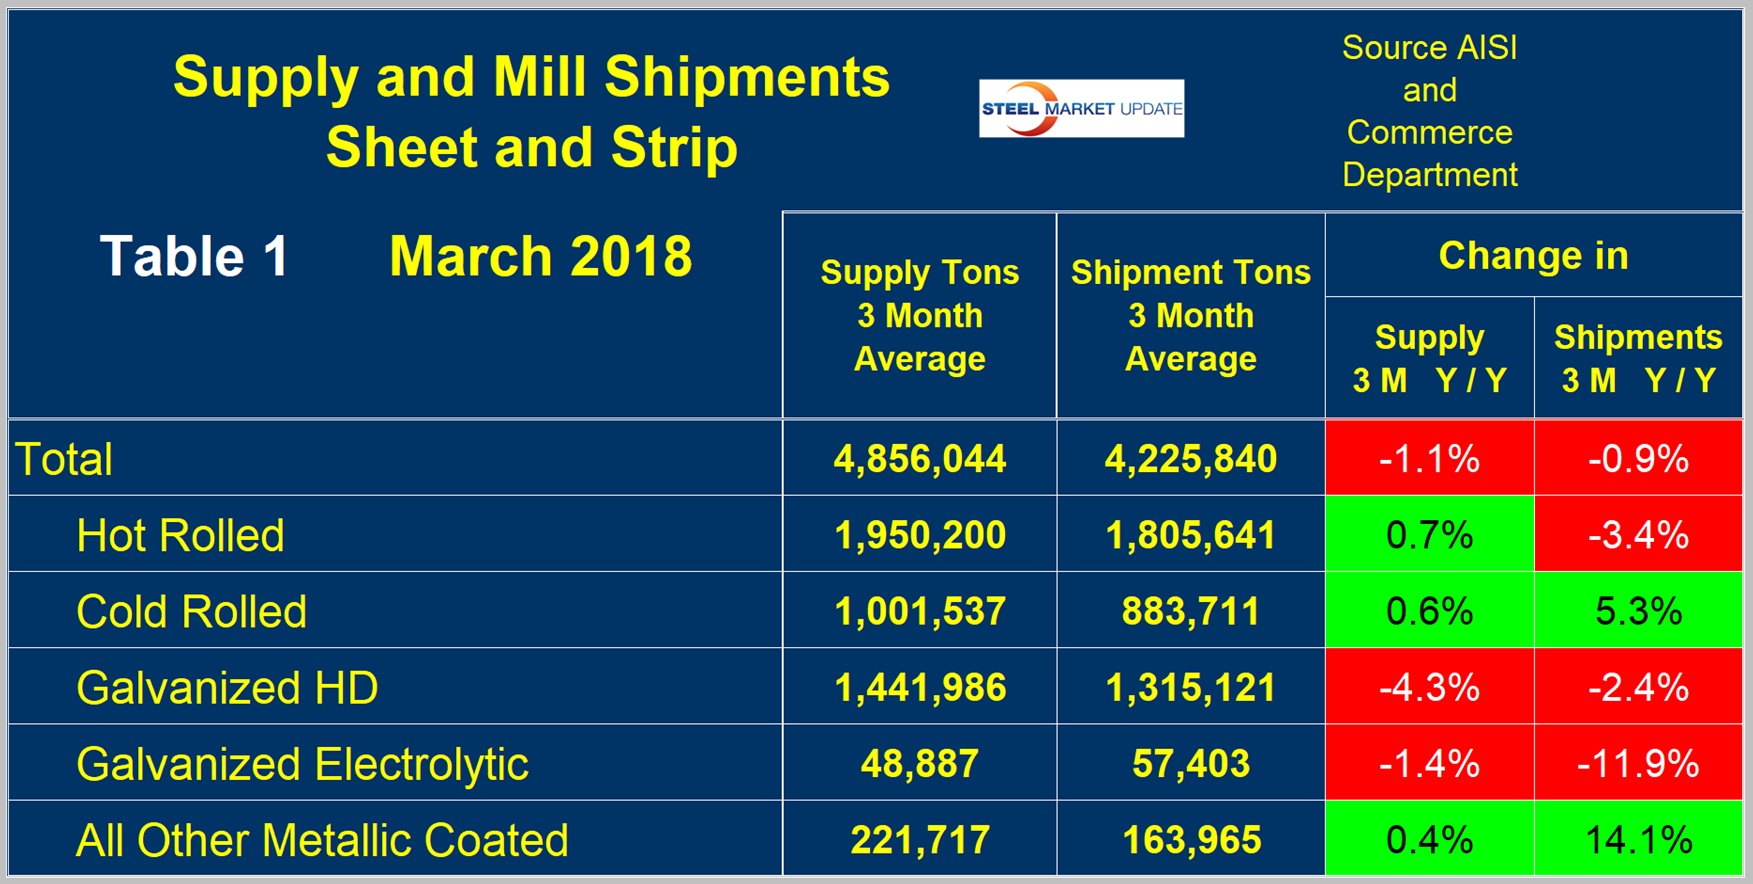
Table 1 describes both apparent supply and mill shipments of sheet products (shipments includes exports) side by side as three-month averages through March with year-over-year growth rates for each. Comparing the year-over-year time periods, total supply to the market decreased by 1.1 percent and mill shipments were down by 0.9 percent. Table 1 breaks down the total into product detail and shows that imports were more of a factor for HR and less for CR. Shipments of other metallic coated improved the most. A review of supply and shipments separately for individual sheet products is given below.
Apparent Supply
Apparent supply is defined as domestic mill shipments to domestic locations plus imports. In the three months through March 2018, the average monthly supply of sheet and strip was 4.856 million tons, up by 5.4 percent in the three months through March, but down by 1.1 percent year to date compared to 2017. There is no seasonal manipulation of any of these numbers. By definition, year-over-year comparisons have seasonality removed, but 3M/3M comparisons do not. Table 2 shows the change in supply by product on this basis through March.
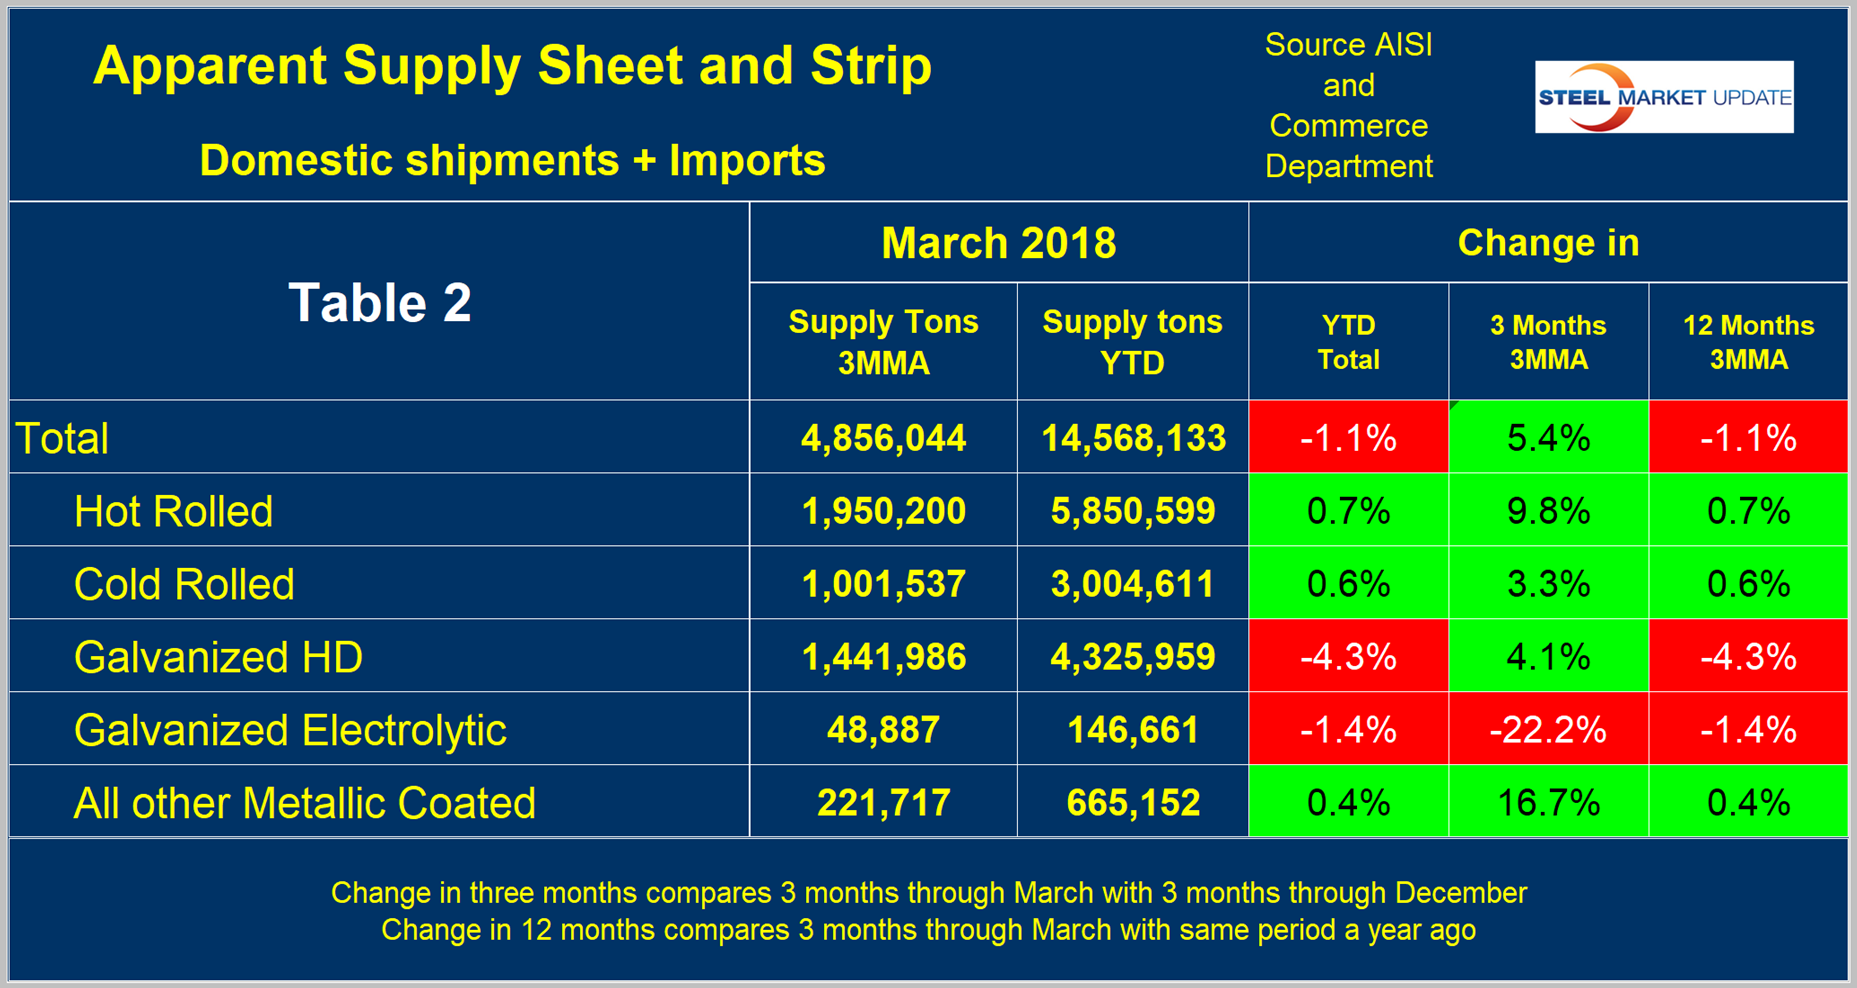
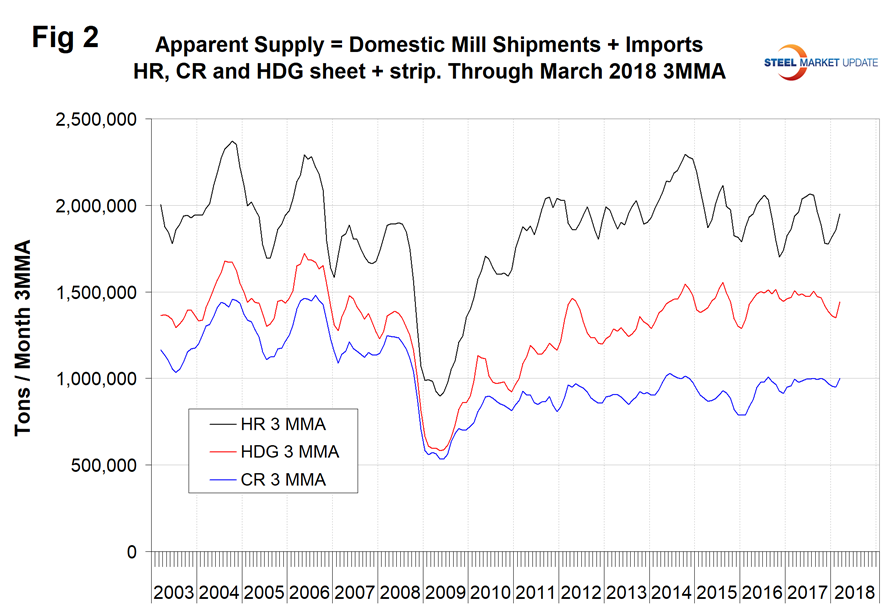
Figure 2 shows the long-term supply picture for the three major sheet and strip products, HRC, CRC and HDG, since January 2003 as three-month moving averages.
Mill Shipments
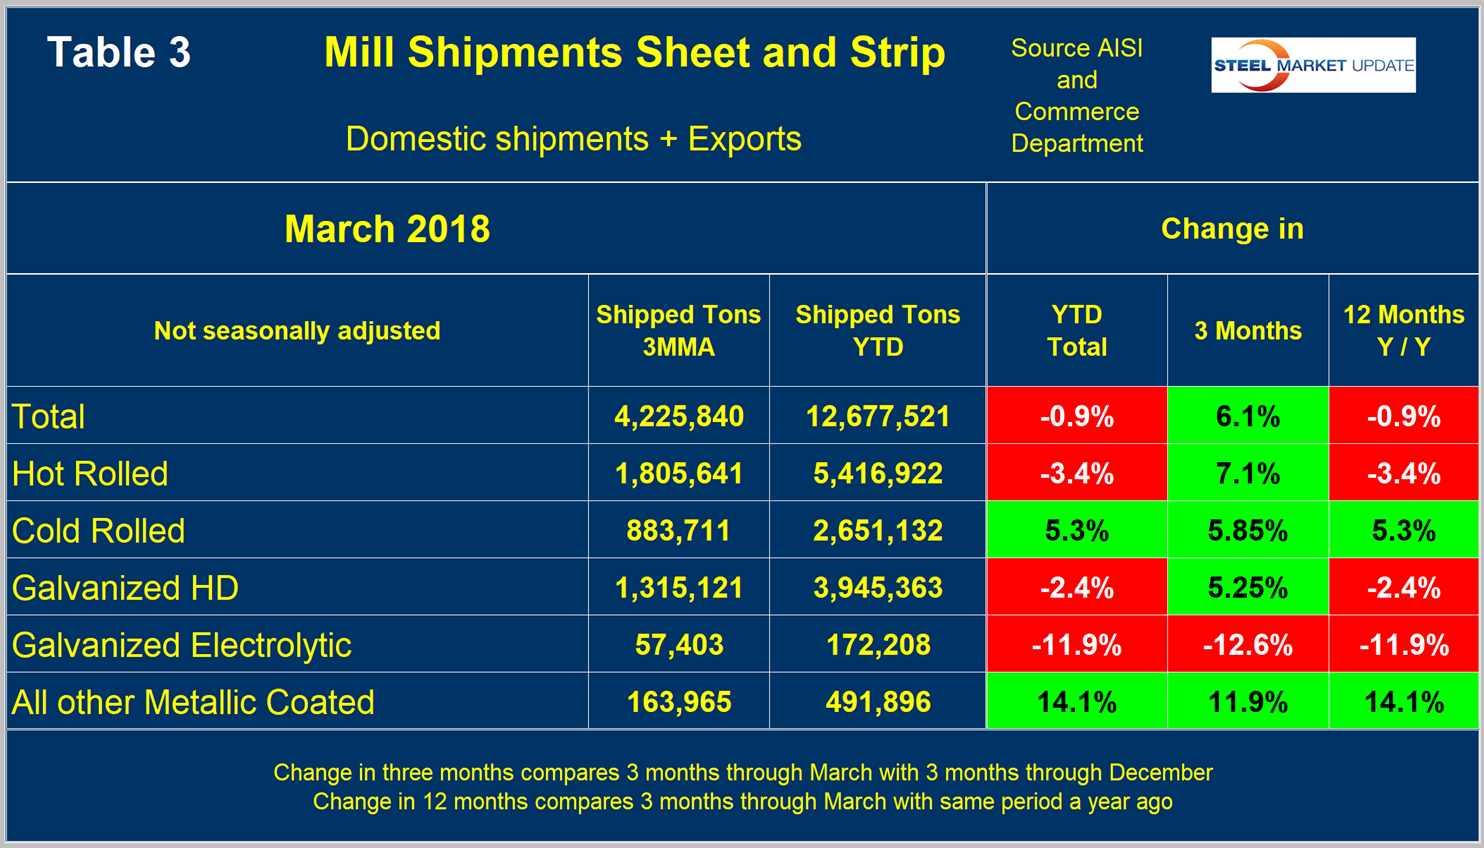
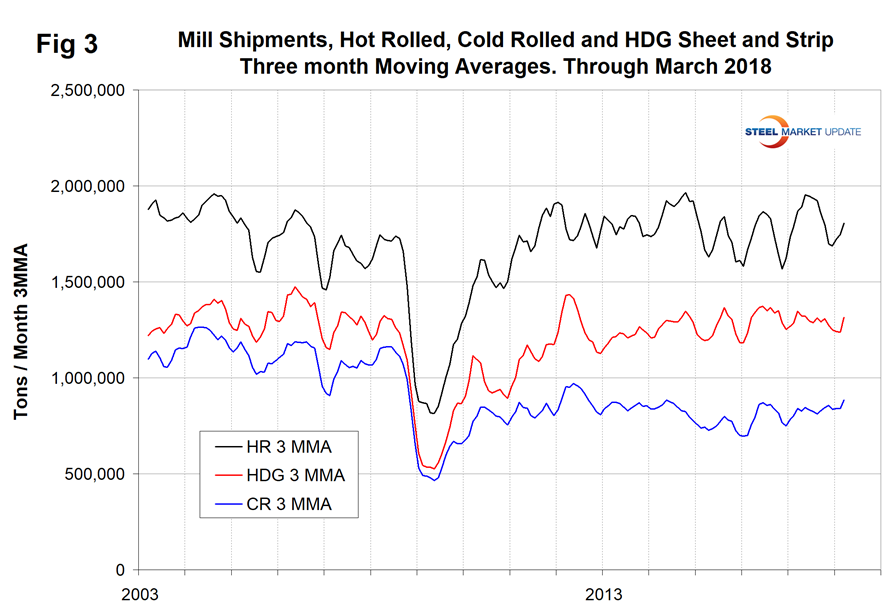
Table 3 shows that total shipments of sheet and strip products including hot rolled, cold rolled and all coated products decreased by 0.9 percent year to date, but were up by 6.1 percent in three months through March compared to three months through December. The positive growth in three months through March compared to three months through December is partly a seasonal effect as described above. Other metallic coated has had very strong shipment growth year to date. Figure 3 puts the shipment results for the three main products into the long-term context since January 2003.
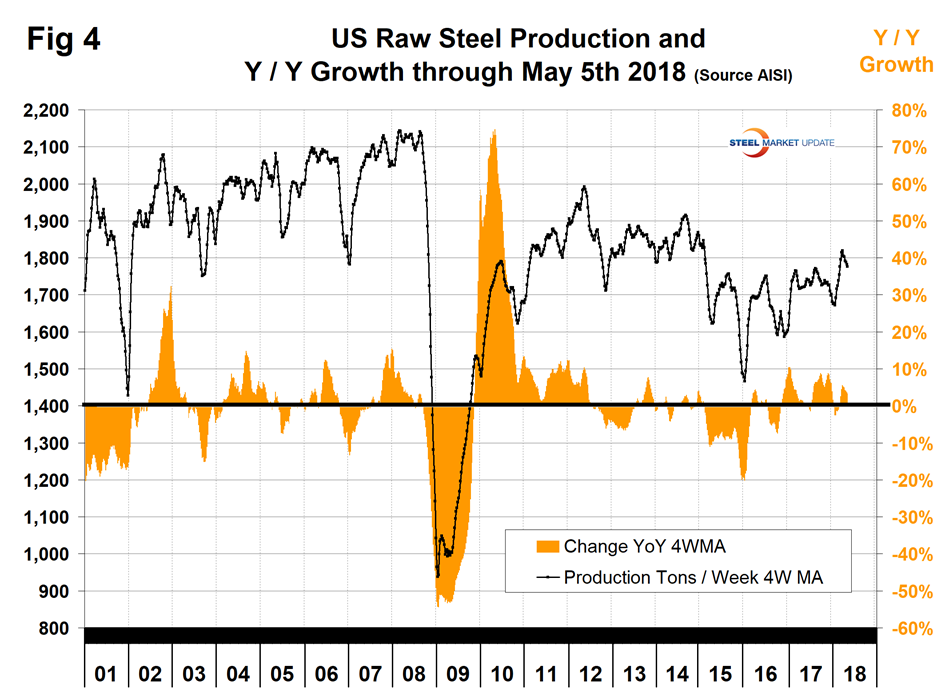
SMU Comment: It’s now well into May and the latest information we have for shipments and supply is for March. AISI puts out weekly data for crude steel production, the latest for which was the week ending May 5. This provides the most current data for steel mill activity. Figure 4 shows the year-over-year change in weekly crude output on a four-week moving average basis. In the last two months, production has been higher than at any time since early 2015, but is still not great on a historical basis. Based on the strength of the economic indicators analysis that SMU performs and our proprietary measure of buyer sentiment, we are expecting demand for sheet products to continue to increase at least through mid-2018.