

Prices

June 12, 2018
Flat Roll Imports by District of Entry and Source-April 2018
Written by Peter Wright
This Steel Market Update analysis breaks down the imported tonnage of six flat rolled products into the district of entry and the source country. We believe that misinformation (or lack of) about regional import volumes is often used to influence purchase decisions. Our intent with this analysis is to describe in detail what is going on in a company’s immediate neighborhood and thus provide a negotiating advantage for our premium subscribers.
Premium members will find reports on our website that break down the import tonnage through April into the port of entry and country of origin in metric tons. Products analyzed in this way are HRC, CRC, HDG sheet, OMC sheet, CTL plate and coiled plate. This data set is large; therefore, we will make no attempt to provide a commentary. Each reader’s interest will be different and he or she simply needs to select one of the six products, then find the nearest port or ports of entry to see how much came into the region each month and from where. Monthly data is provided back to January 2015. It is clear from these detailed reports that the change in tonnage entering a particular district in many cases is completely different to the change in volume at the national level.
Here are some examples to illustrate why this information can be actionable: Cold rolled sheet imports in April year to date were down by 17 percent, but Laredo was up by 10 percent and San Francisco, which completely dried up 14 months ago, came roaring back in March and April with 5,300 tons from Vietnam. HDG was down by 8 percent for the year as of April, but Philadelphia was down by 24 percent and volume into Ogdensburg more than doubled to 18,100 tons, as did tonnage into Boston, which reached 25,600 tons. The discrepancy between the change in the national total and the individual regions is why it’s important for both market understanding and negotiating position to know what’s going on in your own backyard.
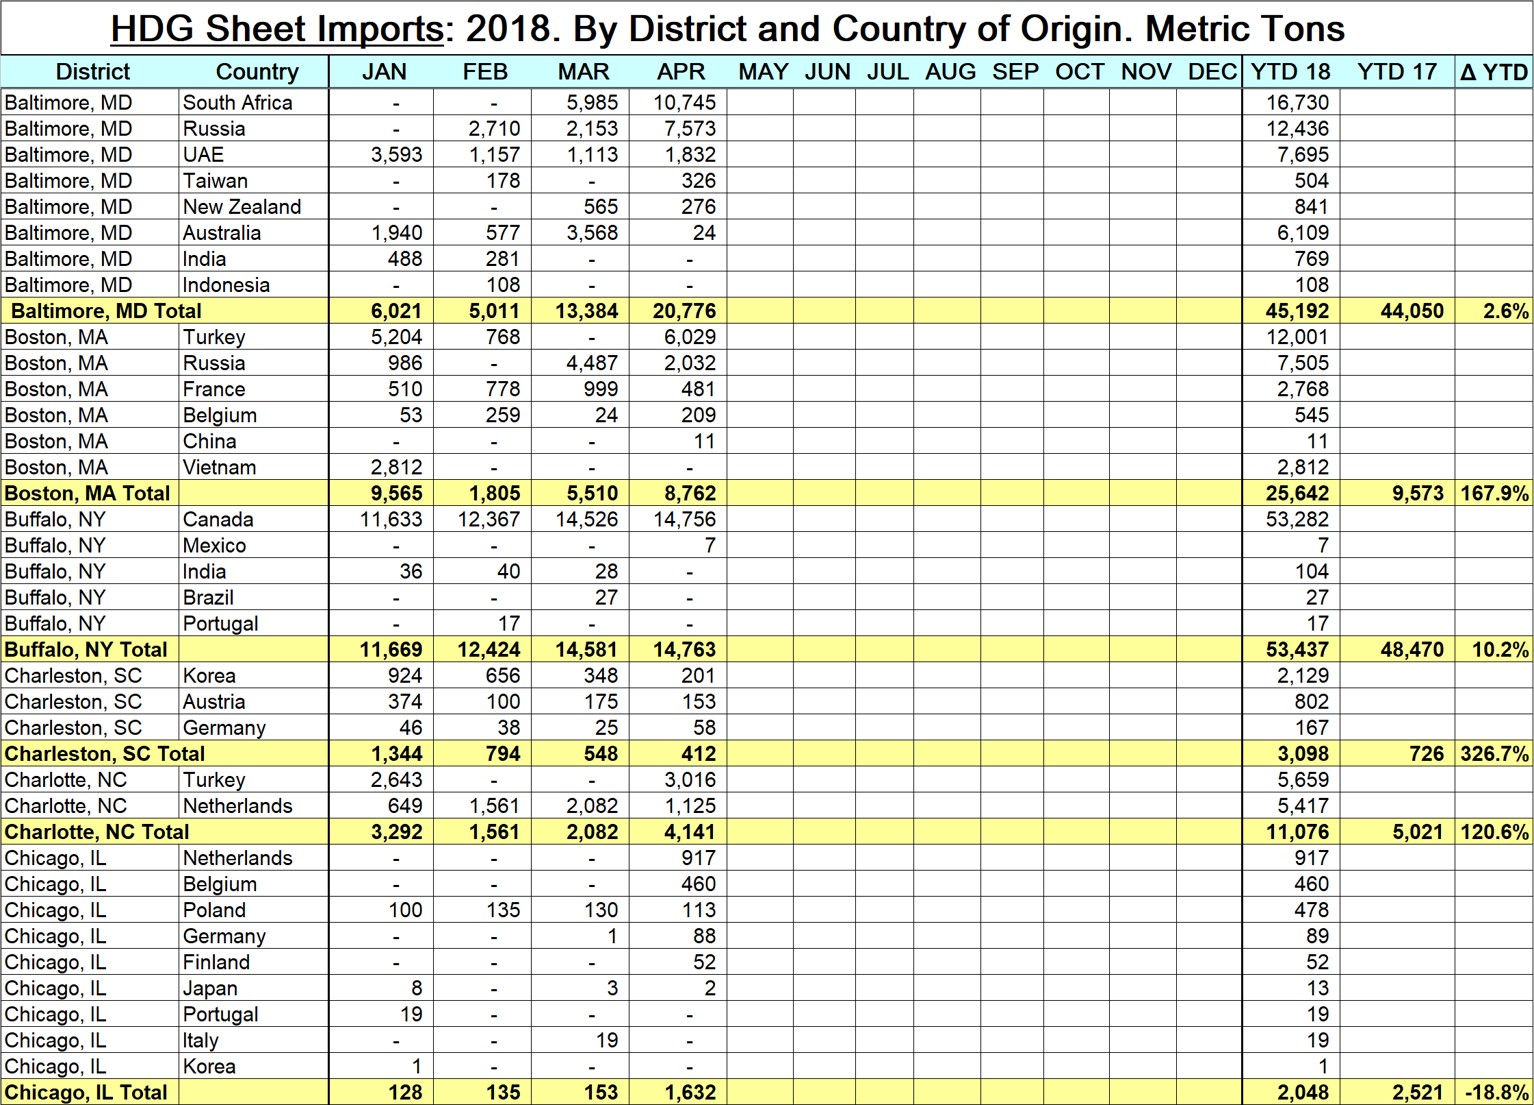
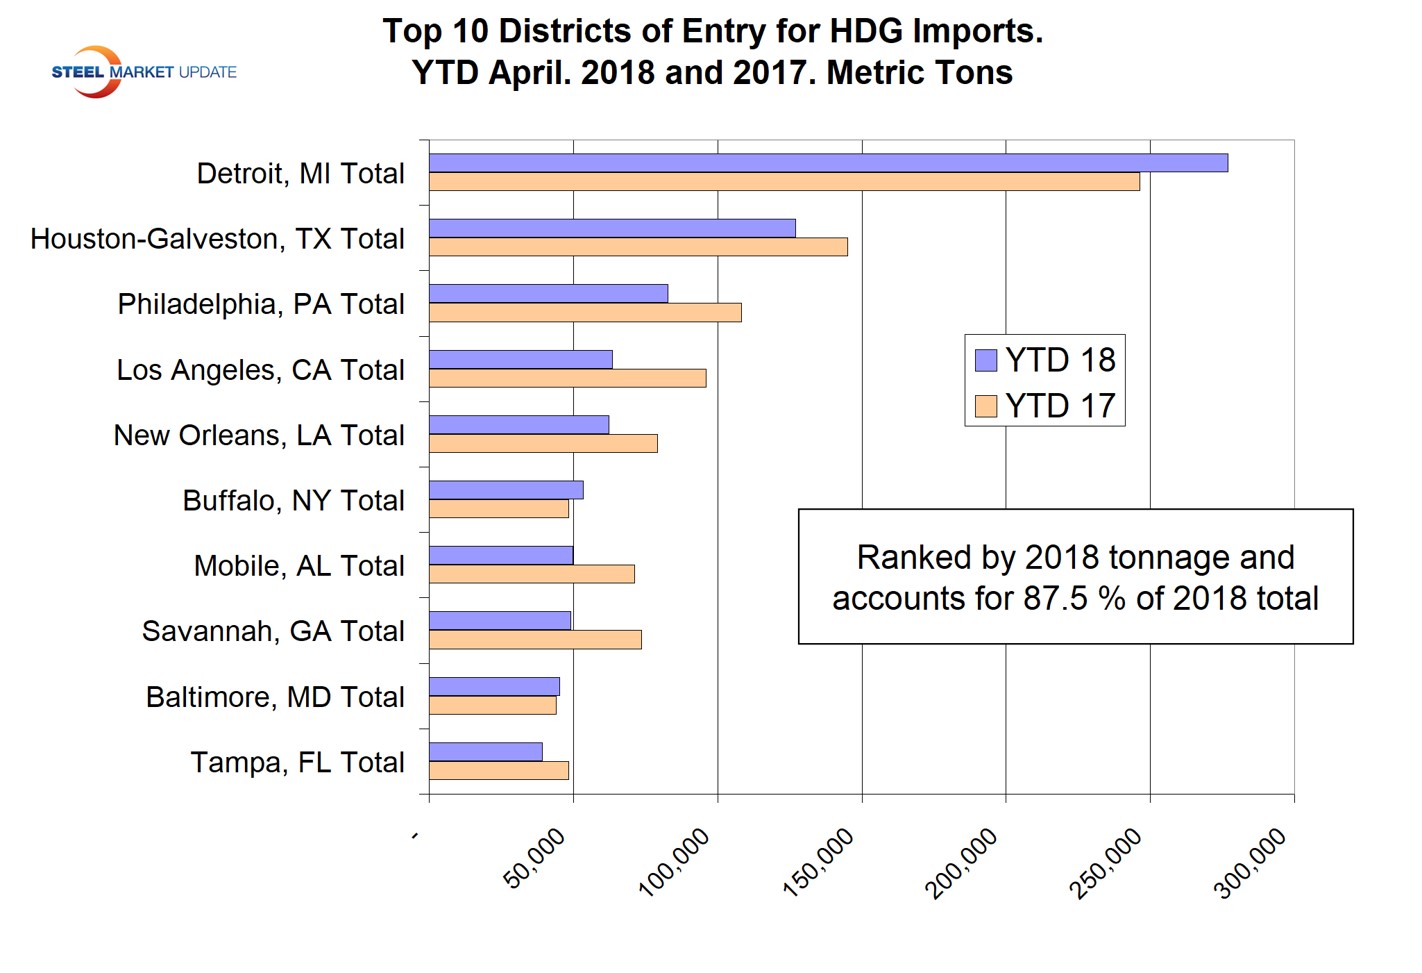
The table included here is a small part of the detailed analysis of the HDG rolled tonnage. The bar graph shows the tonnage of HDG that entered the top 10 districts in April year to date for 2017 and 2018 ranked by 2018 tonnage. Detroit had the most volume and was up by 12.4 percent for the year.
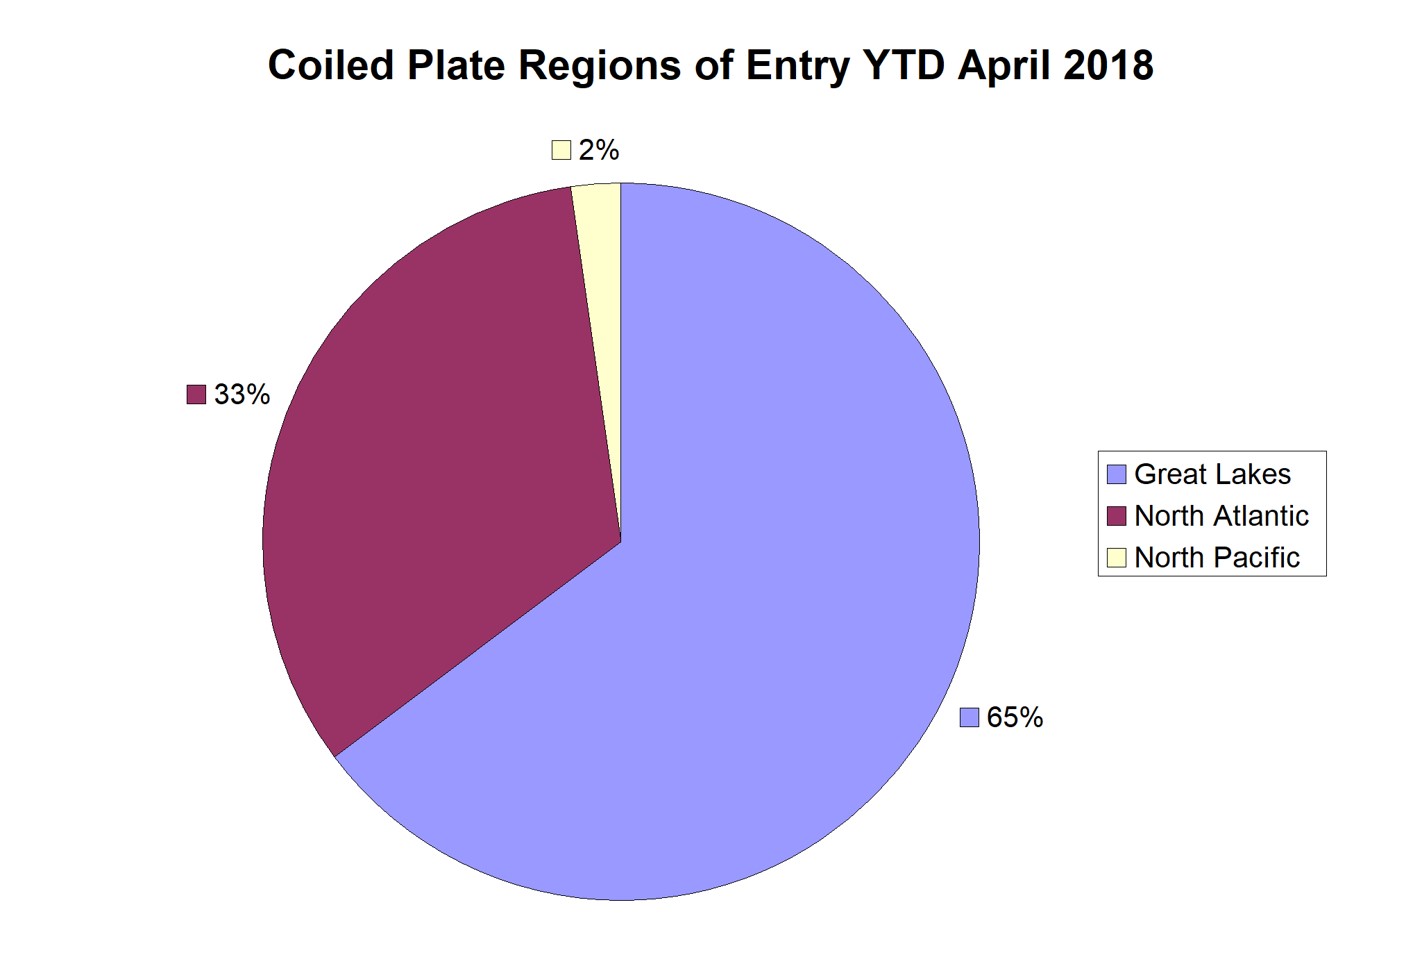
 We are still trying to improve the usefulness of this analysis and this month started to look at a broader picture to include seven regions: Pacific North and South, Rio Grande Valley, the Gulf, Atlantic North and South and the Great Lakes. The pie chart here is a regional analysis for coiled plate, which shows some interesting results. Of the total, 65 percent came in through the Great Lakes, 33 percent into the North Atlantic, and 2 percent into the North Pacific, while all other regions were 1 percent or less.
The data in these detailed reports is compiled from tariff and trade data published by the U.S. Department of Commerce and the U.S. International Trade Commission. Our other import reports are sourced from U.S. Department of Commerce, Enforcement and Compliance, aka the Steel Import Monitoring System. In the development of these reports by district and source country, we have discovered that the SIMA data for HRC and CRC contains some high-alloy steel such as stainless and tool steel, which have been misclassified at the ports. These alloy steels are not included in our detailed reports, which results in a small discrepancy between the two data sets.


