

Market Data

June 28, 2018
BLS: U.S. GDP Slows to 2.0 Percent in First Quarter
Written by Peter Wright
The growth of U.S. gross domestic product slowed in first-quarter 2018, but on a trailing 12-month basis has improved for the last seven quarters. The third estimate of U.S. GDP growth in the first quarter was 2.00 percent, down from 2.87 percent in Q4 2017, according to the June 28 report by the Bureau of Labor Statistics.
Christine Lagarde, Managing Director of the International Monetary Fund, made the following comments on June 14: “The context of this year’s consultation is a U.S. economy that is doing even better than last year. Growth is stronger, unemployment is near the lowest it has been since the 1960s, inflation is contained, and consumer and business confidence are high. Within the next few years, the U.S. economy is expected to enter its longest expansion in recorded history. The Tax Cuts and Jobs Act and the approved increase in spending are providing a significant boost to the economy. We forecast growth of close to 3 percent this year, but falling from that level over the medium-term. In my discussions with Secretary Mnuchin, he was clear that he regards our medium-term outlook as too pessimistic. Despite this good news and a bright near-term outlook, at a longer horizon the U.S. economy faces several risks. First, the planned expansion in the federal deficit at this stage of the cycle could trigger a faster-than-expected rise in inflation. That would be accompanied by a more rapid rise in interest rates that could increase market volatility both in the U.S. and abroad. We are already starting to see symptoms of such negative effects in some emerging market countries, and this might not be the end of it. An important role of the IMF is to warn against these risks and cross-border effects. Second, the fiscal boost is likely to translate into faster import growth and a larger trade and current account deficit in the U.S. This will be matched by growing surpluses in other systemic economies. It may also lead to a stronger U.S. dollar. All of this could lead to a growth in global imbalances, an issue that we at the Fund have long been concerned about.”
GDP is measured and reported in chained 2009 dollars, and on an annualized basis in the first quarter totaled $17.372 trillion. The growth calculation is misleading because it takes the quarter-over-quarter change and multiplies by four to get an annualized rate. This makes the high quarters higher and the low quarters lower. Figure 1 clearly shows this effect. The blue line is the trailing 12-month growth and the black line is the headline quarterly result. On a trailing 12-month basis, GDP was up by 2.77 percent in Q1, which was the best result since Q2 2015 and better than the 2.17 percent average in 33 quarters since Q1 2010. Therefore, we conclude that the current growth of U.S. GDP is better than its average for the last nine years. The blue line in Figure 1 shows the slow but steady progress since Q2 2016.
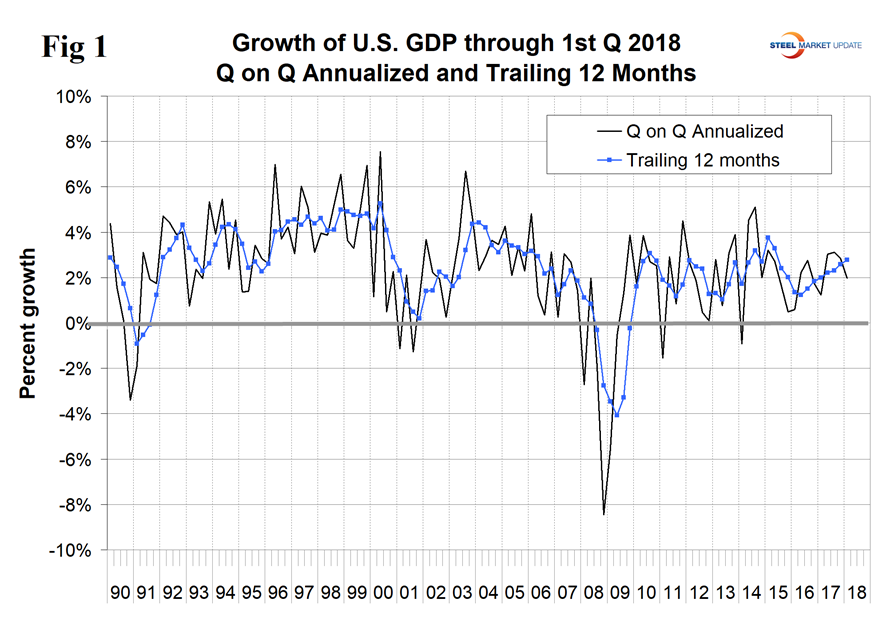
Figure 2 shows the headline quarterly results since 1990 and the April 2018 Congressional Budget Office forecast through 2022. The CBO is forecasting a 3.5 percent growth rate in Q2 2018 and that 2018 as a whole will be boosted by the tax break before falling back in 2019. The IMF forecasts global and national economic growth each April and October. In April’s update, the forecast of U.S. economic growth in 2018 was revised up for the years 2018 through 2020, then revised down for 2021 and 2022. The IMF growth forecast for 2018 was revised up from 2.3 percent to 2.9 percent, and the 2019 forecast was adjusted from 1.9 percent to 2.7 percent.
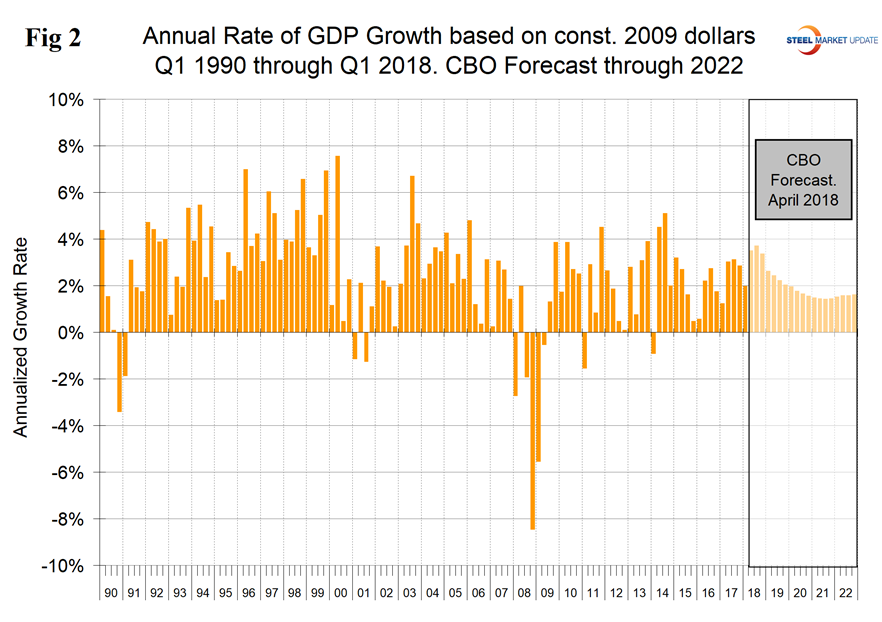
Figure 3 shows the change in the six major subcomponents of GDP in Q1 2018. Normally, personal consumption is the dominant growth driver, but in the first quarter this component declined to 0.60 percent, which was the lowest since Q2 2013. Personal consumption includes goods and services, the goods portion of which includes both durable and non-durables. The contribution of inventories improved from negative 0.53 percent in Q4 2017 to negative 0.01 percent in Q1 2018. Rising inventories are entered as a positive in the GDP calculation. Note that in the definitions at the end of this piece, inventories are not mentioned. Over the long run, inventory changes are a wash and simply move growth from one period to another. In the first three quarters of 2017, net exports made a positive contribution, influenced by the decline in the value of the dollar that continued through early September 2017. In Q4 2017, net exports made a negative contribution of 1.16 percent, improving to negative 0.04 percent in Q1 2018. The contribution of government expenditures was almost zero in the period Q2 2016 through Q2 2017, but made a 0.22 percent contribution in Q1 2018.
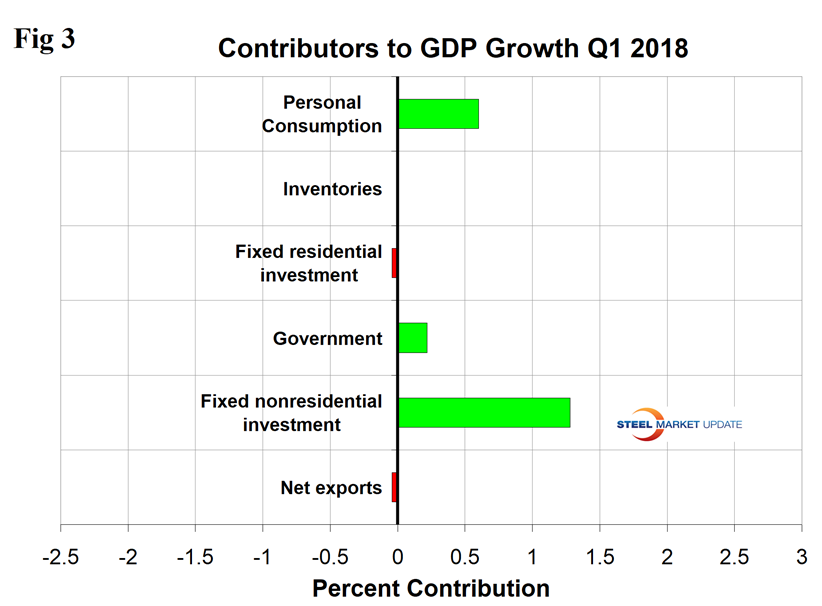
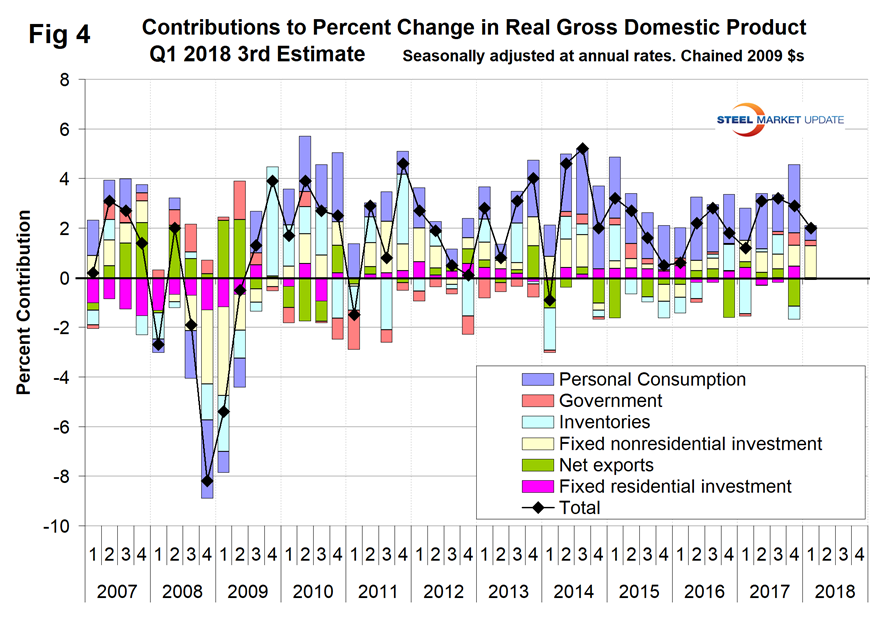
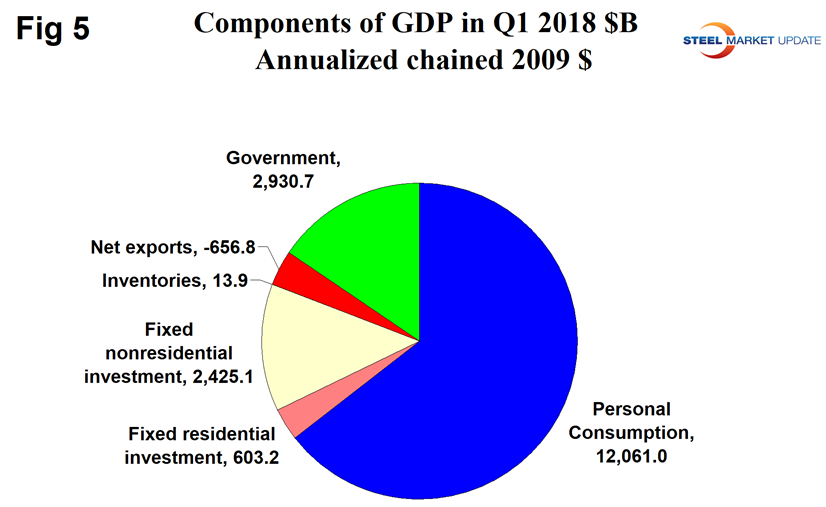
Figure 4 shows the quarterly contributors of the six major subcomponents of GDP since Q1 2007. The negative contributions of fixed residential investment, inventories and net exports were so small that they aren’t visible in this graph. Figure 4 clearly shows the whipsaw effect of inventory changes. Figure 5 shows the breakdown of the $17.4 trillion economy.
SMU Comment: This was a rather subdued result with the biggest change being a decline in personal consumption compared to Q4 2017. The trailing 12-month growth rate has improved for each of the last seven quarters and in Q1 reached 2.77 percent. This is high enough to stimulate future steel consumption, which requires a 2.2 percent growth to break even.
Definition of GDP: Gross domestic product (GDP) is the value of the goods and services produced by the nation’s economy less the value of the goods and services used up in production.
GDP is defined as Consumption (C) plus Investment (I) plus Government Spending (G) plus [Exports (E) minus Imports (I)] or: GDP = C + I + G + (E-I)
National savings is GDP minus (consumption plus government spending). That means that investment equals savings plus net exports. If there are no net exports, then money must come back into the U.S. from outside the country to finance investments, along with savings. Thus, if there is a government deficit, there must be savings by both consumers and businesses, plus capital flows from outside the country, to offset that deficit in order for there to be any money left over for investments.
Another definition of GDP states that it equals the growth in working population multiplied by their productivity.

