

Market Data

June 28, 2018
SMU Currency Analysis: U.S. Dollar Strengthens
Written by Peter Wright
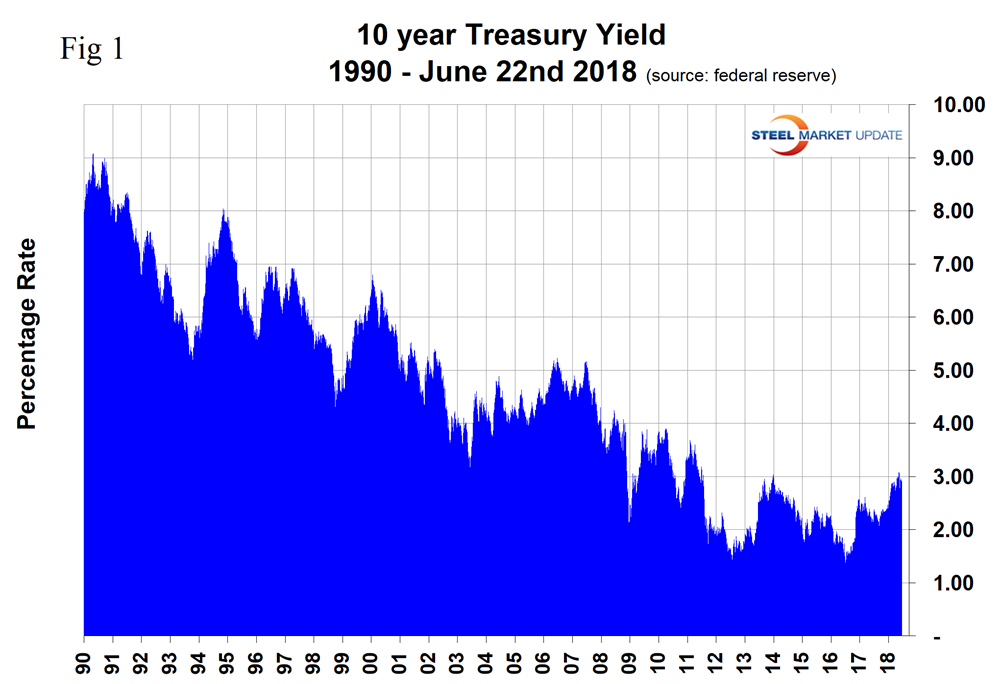
U.S. treasury yields are surging and this is contributing to the recent advance in the value of the dollar on foreign exchange markets. The dollar has strengthened by 4.5 percent in the last three months and also by 4.5 percent since Jan. 2.
Please see the end of this report for an explanation of data sources. The analysis of currency trends is a highly technical undertaking. Therefore, in this monthly SMU update, we sometimes incorporate the opinions of other analysts to add color to our own data analysis.
On June 13, the Fed raised interest rates by a further 0.25 percent and is expected to implement two more increases this year. The Bank of Japan is maintaining its easy monetary policy, keeping its short-term interest rate target at minus 0.1 percent, as inflation isn’t getting close to the central bank’s 2 percent target. The move contrasts with the European Central Bank’s decision to end its asset-purchase program this year and the Federal Reserve’s steady rate increases.
Figure 1 shows the 10-year treasury interest rate through June 22. The 10-year yield exceeded 3 percent in May 2018 for the first time since July 28, 2011.
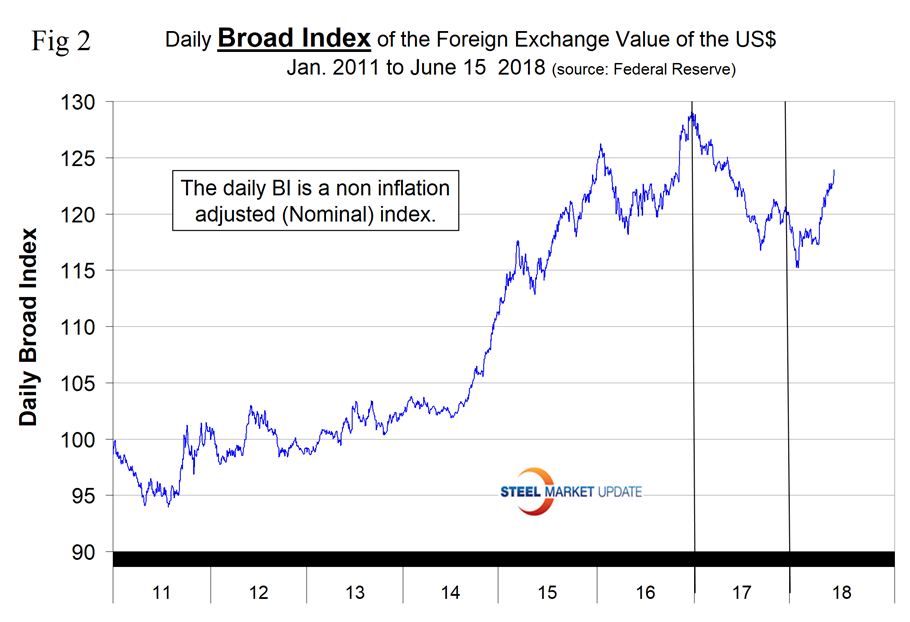
The Broad Index value of the U.S. dollar is reported several days in arrears by the Federal Reserve; the latest value published was for June 15. Figure 2 shows the index value since January 2011. The dollar had a recent peak of 128.96 on Jan. 3, 2017, which was the highest value in almost 15 years; the recent low point was Feb. 1, 2018, at 115.21. On June 15, the dollar had recovered to 123.92.
Each month, SMU publishes an update of Table 1, which shows the value of the U.S. dollar against the currencies of 16 major global steel and iron ore trading nations. The table shows the change in value in one year, three months, one month and seven days through June 24.
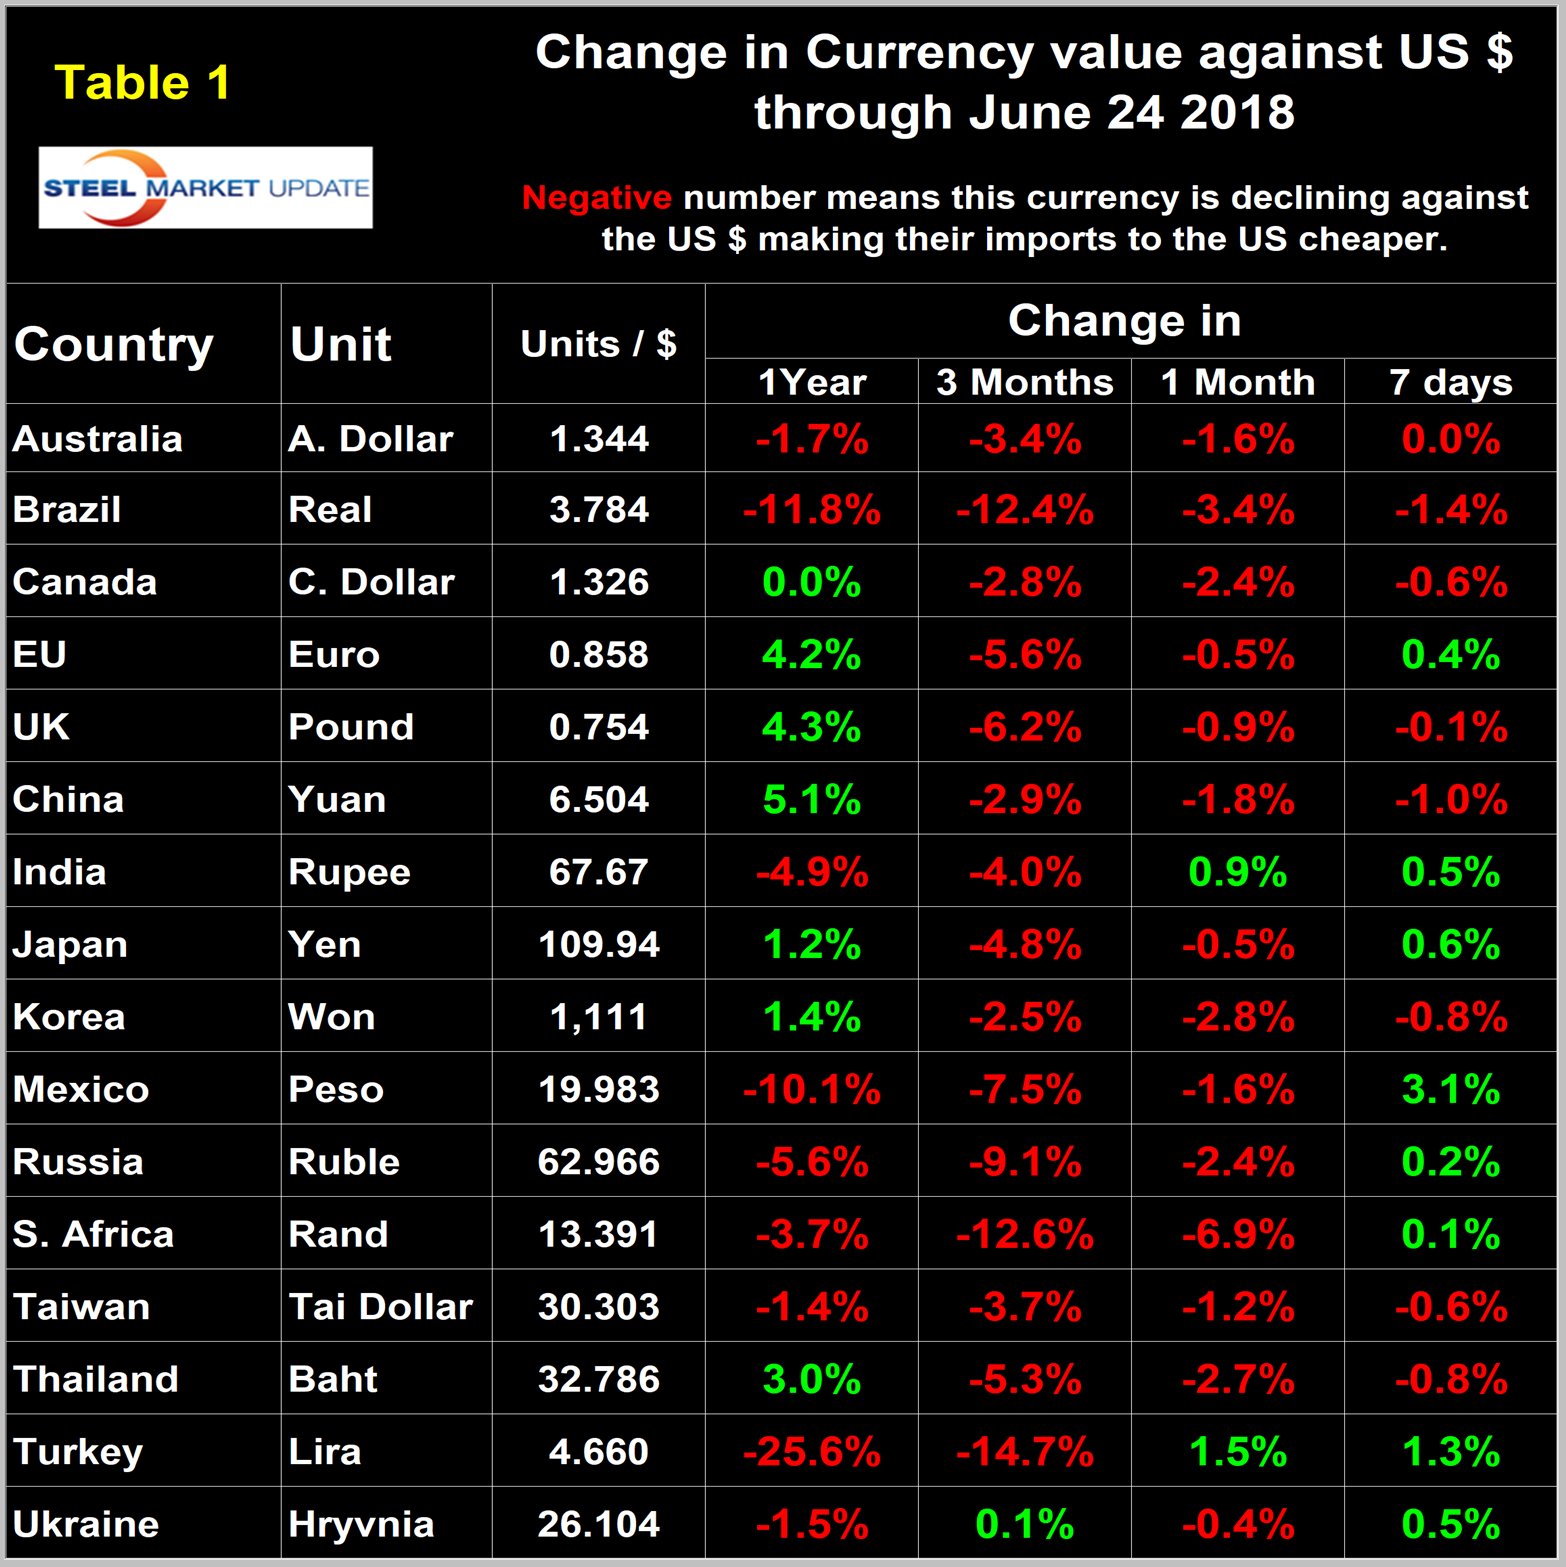
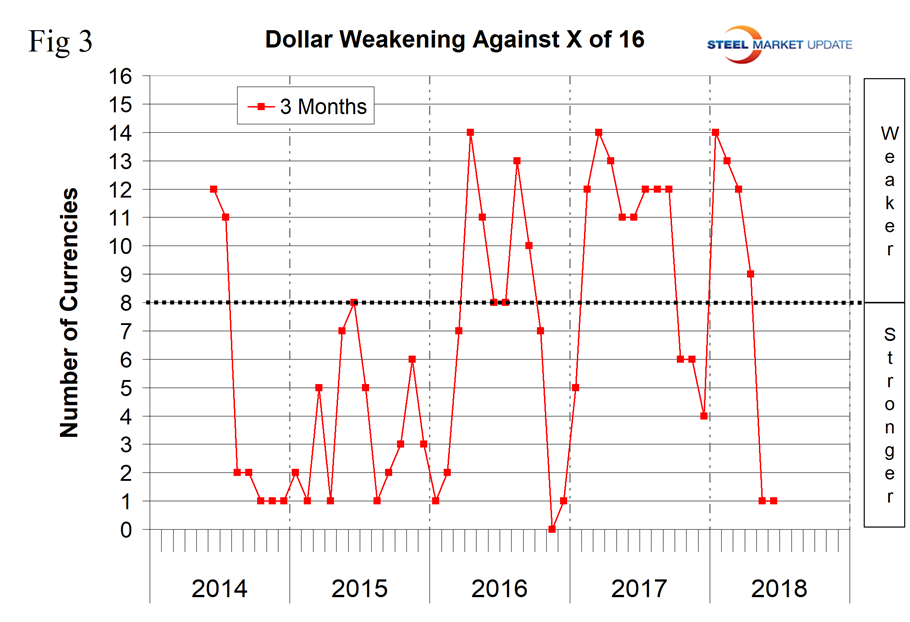
Figure 3 gives a longer-range perspective and shows the extreme gyrations that have occurred in the last three years. The dollar strengthened against 15 of the 16 in the last three months and against 14 in the last month. Quite often the change in value of these 16 currencies does not accord with the broad index, but this is not one of those times.
A falling dollar puts upward pressure on all commodity prices that are greenback denominated. Table 1 is color coded to indicate strengthening of the dollar in red and weakening in green. We regard strengthening of the U.S. dollar as negative and weakening as positive because of the effect on the trade balance of all commodities and on the total national trade deficit.
In each of these reports, we comment on several of the 16 steel and iron ore trading currencies listed in Table 1, and over a period of several months will describe the history of all of them. Charts for each of the 16 currencies are available through June 24 for any premium subscriber who requests them.
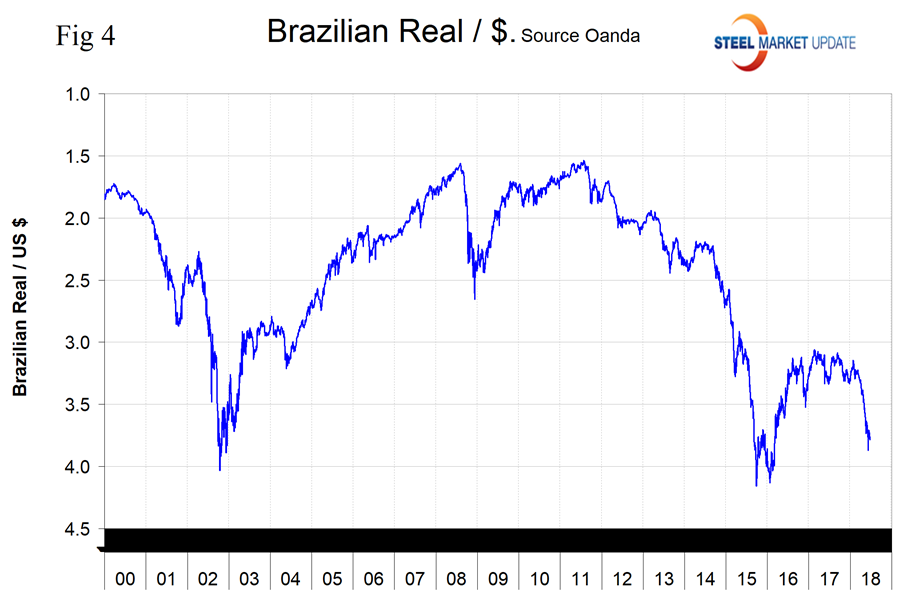
The Brazilian Real
Brazil’s real has weakened by 12.4 percent in the last three months of which 3.4 percent occurred in the last month. In 12 months through May 31, Brazil exported 4,431,000 tons to the U.S. of which 3,474,000 was semi-finished. Brazil’s total volume in 12 months was second only to Canada. On May 25, the IMF summarized Brazil’s situation: “A mild recovery supported by accommodative monetary and fiscal policies is underway. But the output gap is large, public debt is high and increasing, and, more importantly, medium-term growth prospects remain uninspiring, absent further reforms. Against the backdrop of tightening global financial conditions, placing Brazil on a path of strong, balanced and durable growth requires an earnest pursuit of fiscal consolidation, ambitious structural reforms, and a strengthening of the financial sector architecture. This will require strong leadership and resolve. Recent measures, notably the ceiling on federal expenditures and reforms of the labor and subsidized credit markets, are welcome and should help boost confidence, but much more is needed. Over the near term, since inflation is below target and expectations are anchored, monetary policy should remain accommodative to facilitate a durable recovery, while fiscal consolidation should accelerate. The exchange rate should remain flexible to absorb external shocks.”
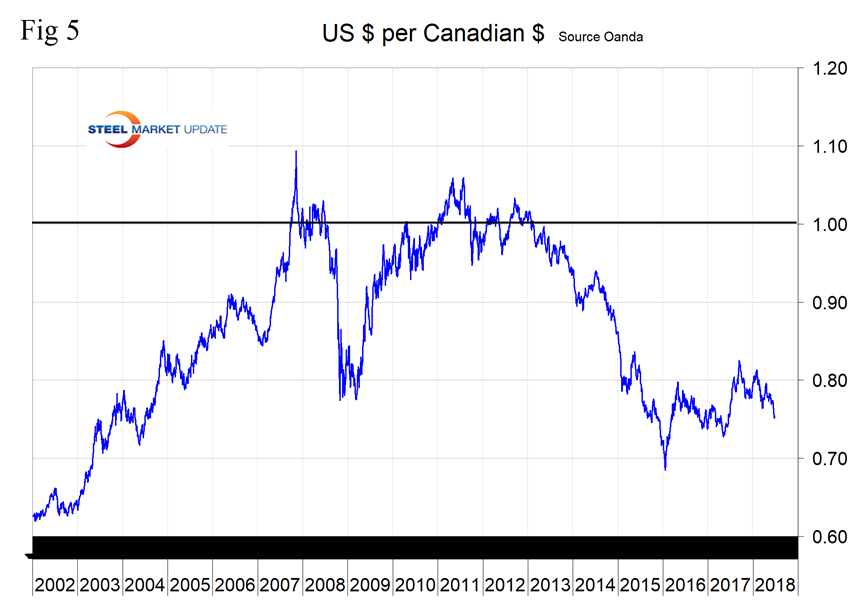
The Canadian Dollar
Canada’s dollar has declined by 2.8 percent in the last three months. Canada is the nation with the largest steel export volume to the U.S. and in 12 months through May 31 shipped 6,084,000 tons across our northern border, 18 percent of total U.S. steel imports. Hot rolled and HDG sheet are the primary products coming out of Canada; others are shown in Table 2. On June 4, the IMF in a concluding statement wrote: “Economic anxiety in Canada is high due to trade tensions, uncertainty about the outcome of NAFTA negotiations, and the impact of the U.S Tax Cuts and Jobs Act on Canada’s medium-term competitiveness. Near-term growth will be supported by higher oil prices and strong U.S. growth, but weak productivity continues to weigh on longer-term prospects. The current favorable economic environment presents an opportunity to rebuild policy buffers and forge ahead with structural reforms to boost Canada’s global competitiveness.”
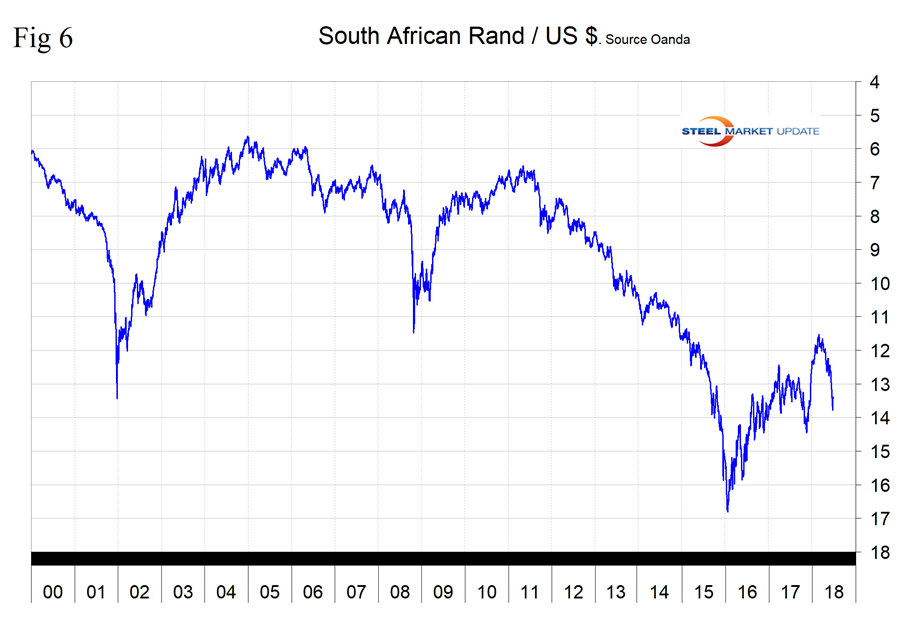
The South African Rand
South Africa’s rand has declined by 6.9 percent in the last month and over a three-month period is down by 12.6 percent. South Africa is the 15th ranked importer of steel into the U.S. with a total of 273,000 tons in 12 months through May 31. Forty-five percent of South Africa’s shipments into the U.S. is HDG sheet, 18 percent is line pipe, 13 percent is cold rolled sheet and 11 percent is OCTG.
The Thai Baht
Thailand’s baht has lost 5.3 percent in the last three months and in the last month is down by 2.7 percent. Thailand is the 13th ranked importer of steel products into the U.S. with a total of 363,000 tons in 12 months through May 31. Major imported products included standard pipe, 33 percent; HDG sheet, 22 percent; cold rolled sheet, 20 percent; and OCTG 19 percent.
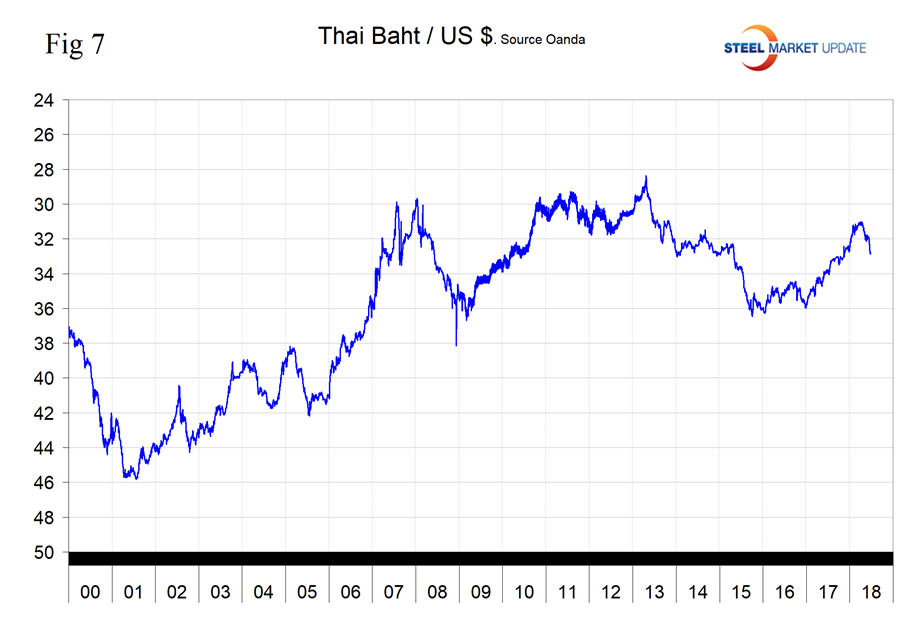
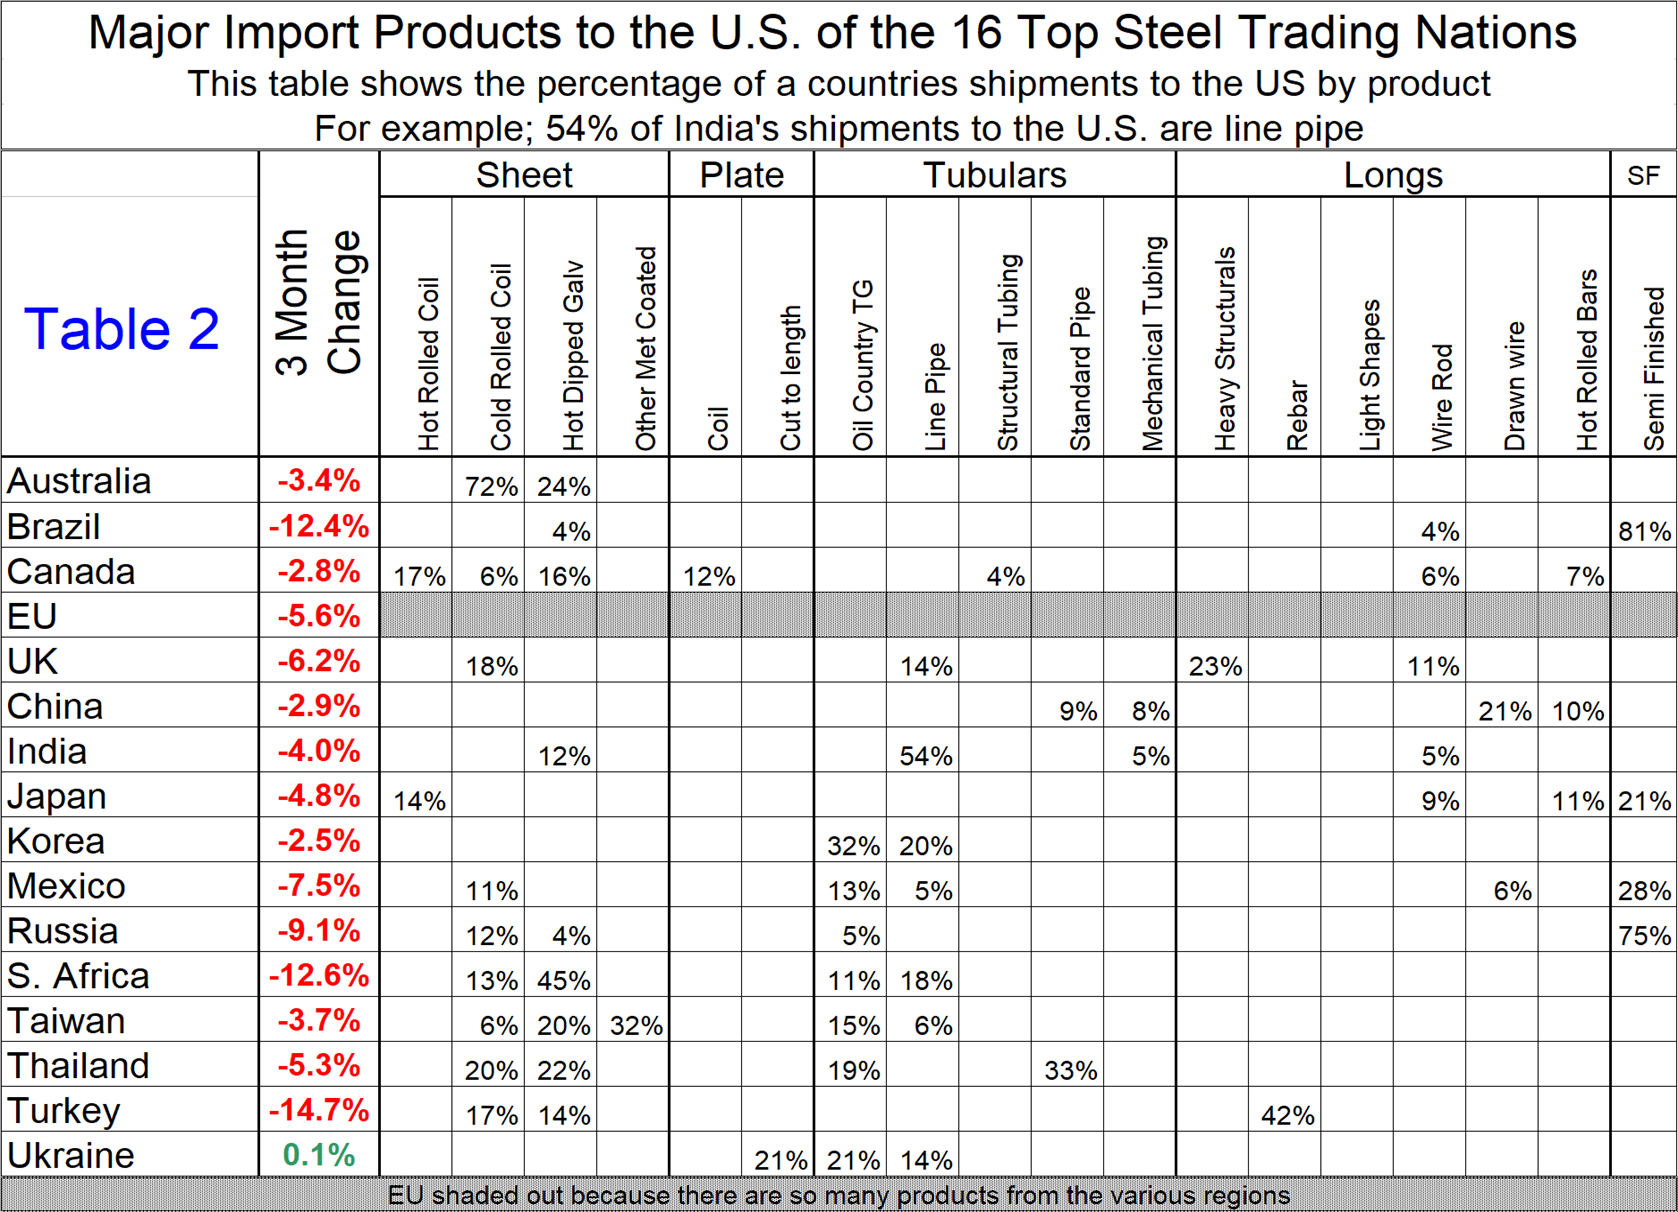
Table 2 shows the major products in the portfolio of the 16 nations and the three-month change in currency value. Something to think about as buyers of offshore steel work to minimize their input materials costs.
Explanation of Data Sources: The broad index is published by the Federal Reserve on both a daily and monthly basis. It is a weighted average of the foreign exchange values of the U.S. dollar against the currencies of a large group of major U.S. trading partners. The index weights, which change over time, are derived from U.S. export shares and from U.S. and foreign import shares. The data are noon buying rates in New York for cable transfers payable in the listed currencies. At SMU, we use the historical exchange rates published in the Oanda Forex trading platform to track the currency value of the U.S. dollar against that of 16 steel and iron ore trading nations. Oanda operates within the guidelines of six major regulatory authorities around the world and provides access to over 70 currency pairs. Approximately $4 trillion U.S. dollars are traded every day on foreign exchange markets.


