

Prices

July 13, 2018
SMU Imports Report: OMC Down 17.6 Percent
Written by Peter Wright
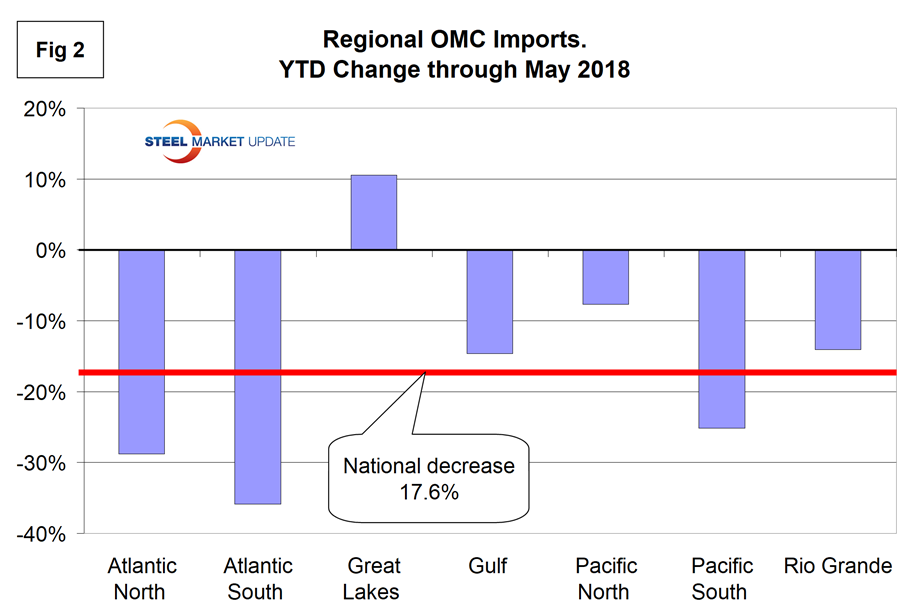
Imports of other metallic coated sheet (OMC) into the U.S. as a whole were down by 17.6 percent in May year to date, according to Steel Market Update’s latest analysis of federal data. The Great Lakes region was up by 10.5 percent and the South Atlantic was down by 35.8 percent.
SMU now has a comprehensive series of import reports ranging from the first look at license data to the very detailed look at volume by district of entry and source nation. The report you are reading now is designed to plug the gap between these two. Our intention is to report regional imports for two products each month. This month (July), we are reporting on coated products. Next month, we will report on HRC and CRC and in September on coiled and CTL plate.
![]() National level import reports do a good job of measuring the overall market pressure caused by the imports of individual products. The downside is that there are huge differences between regions.
National level import reports do a good job of measuring the overall market pressure caused by the imports of individual products. The downside is that there are huge differences between regions.
Figure 1 shows the year to date tonnage of OMC imports for each of seven regions. The Gulf has received more tonnage than all the other regions combined so far this year.
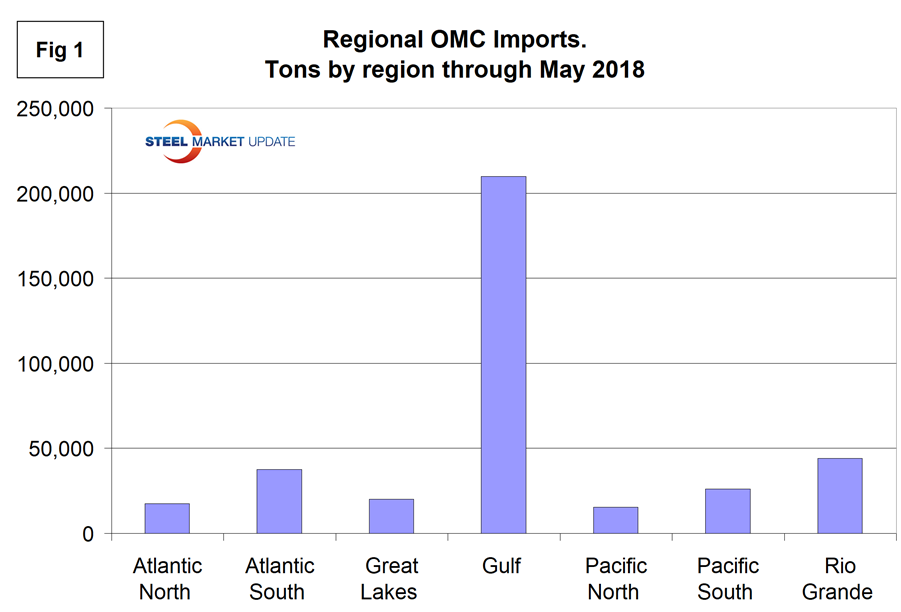
Figure 2 shows the percentage change in tonnage for each region compared to the same period last year and the change at the national level. All regions except the Great Lakes have experienced a decline this year.
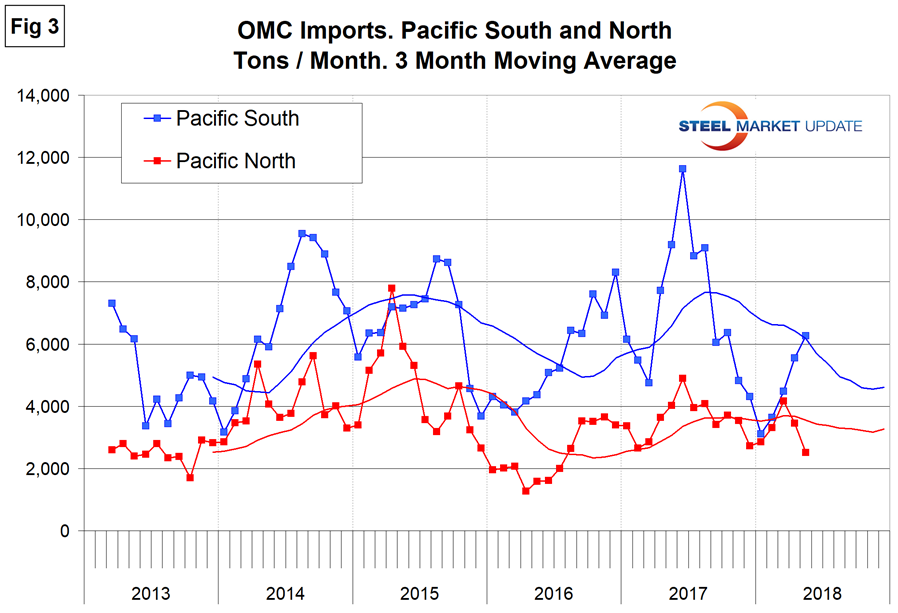
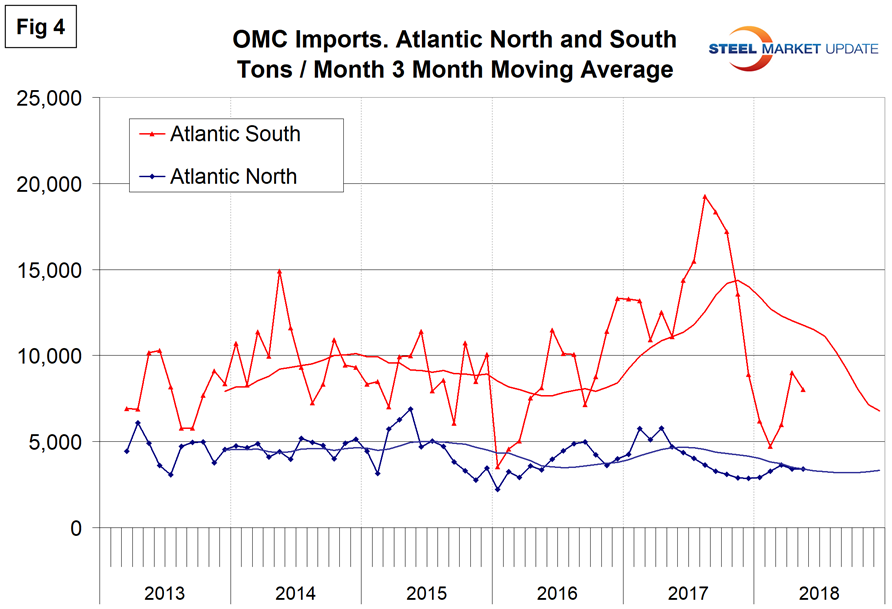
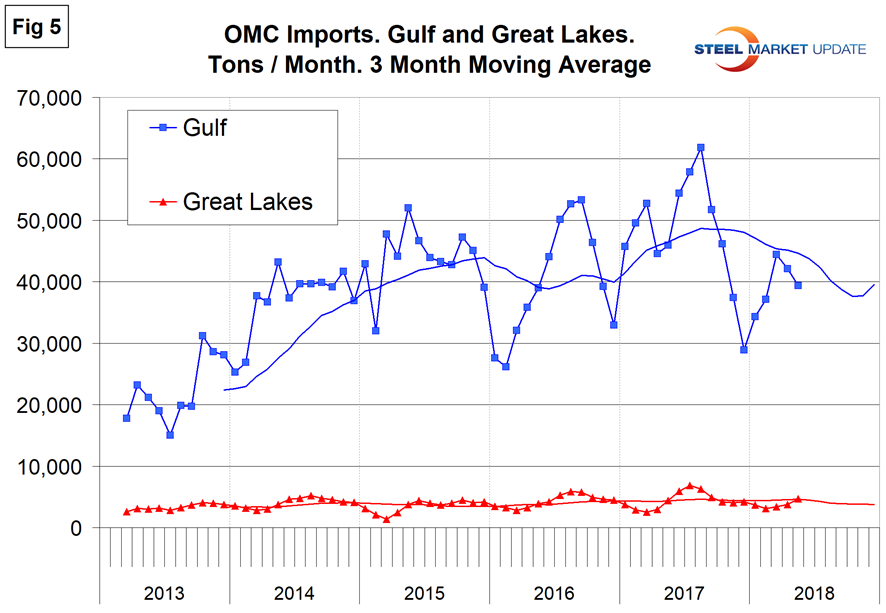
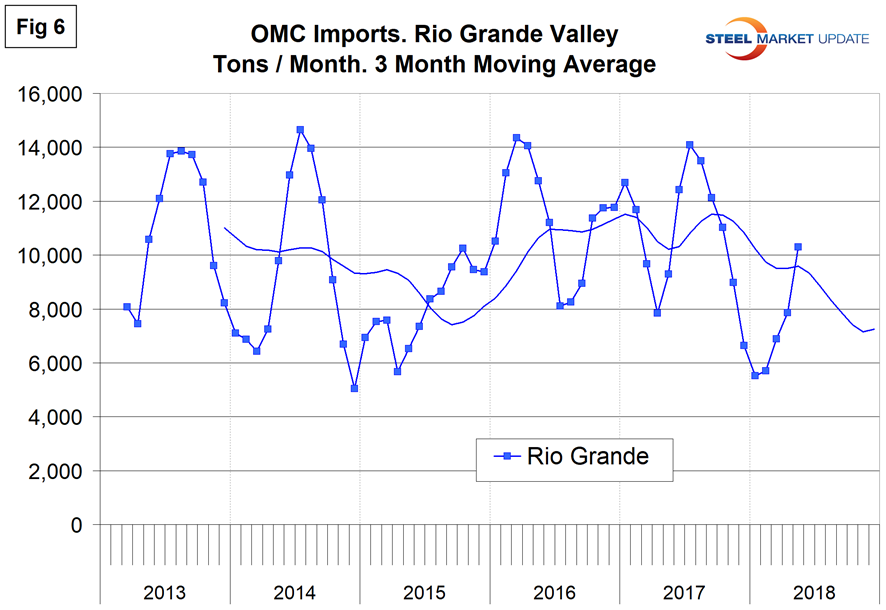
Figures 3, 4, 5 and 6 show the history of OMC sheet imports by region since March 2013 on a three-month moving average basis with a computer driven trend projection through the end of the year.
Volume into the South Pacific port of Los Angeles had huge spikes in April and June last year when shipments arrived from Taiwan in both months. This region bottomed out in January this year and has since then been increasing. Volume into the North Pacific ports has been much lower and more consistent for the last two years.
Volume into the Atlantic South collapsed through December last year, spiked again in April this year when a large shipment arrived from Taiwan, before declining again in May. Volume into the Atlantic North has been much lower and more consistent throughout the timeframe of this analysis.
Tonnage into the Great Lakes has been minimal and consistent since January 2003. Tonnage into the Gulf has been trending up with a spike in June last year when large shipments from Korea into Houston and New Orleans coincided. Tonnage into the Gulf bottomed out last December and since then has been erratic.
Tonnage crossing the Rio Grande has been very erratic throughout the timeframe of this analysis.
Sources: Information in this report was compiled from tariff and trade data from the U.S. Department of Commerce and the U.S. International Trade Commission.


