Market Data

July 15, 2018
Service Center Spot: Threat to Pricing Strength?
Written by John Packard
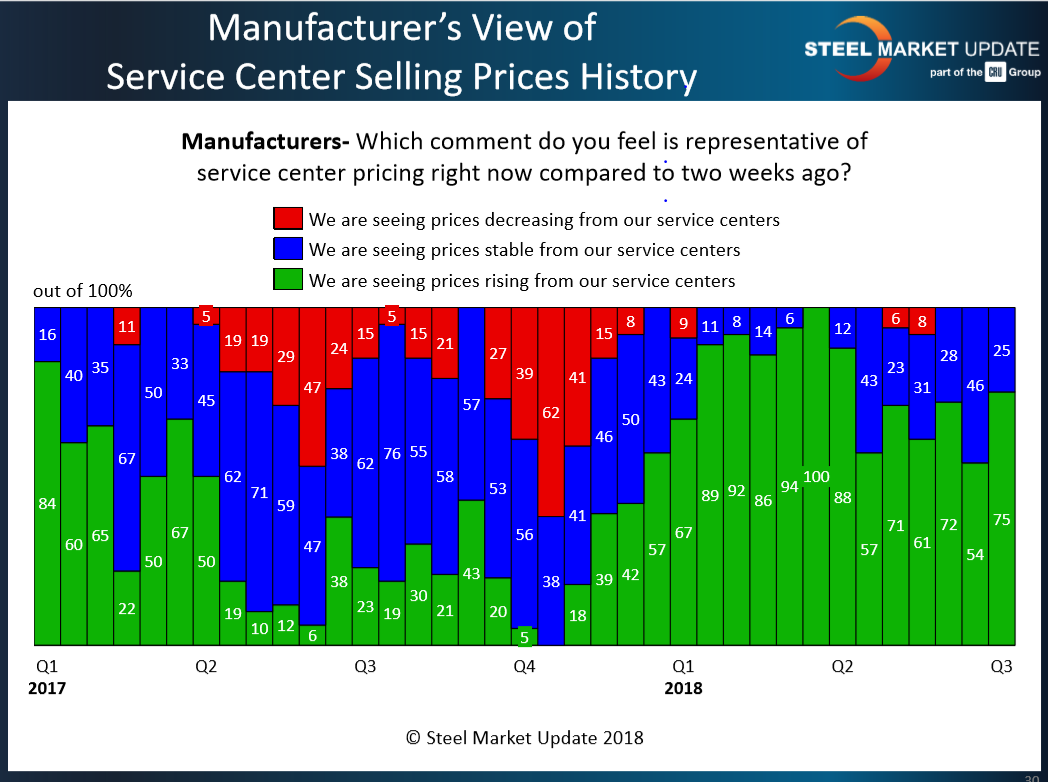
Manufacturing companies have a different perspective on service center spot pricing than what the service centers themselves reported to Steel Market Update during the first week of July.
We are about to survey steel buyers as we work on our mid-July flat rolled and plate steel market trends analysis. Prior to the new survey, we thought our readers might be interested in what we captured a little earlier this month.
Seventy-five percent of the manufacturing companies responding to our early July survey reported service center spot prices as rising compared to what they were seeing two weeks earlier. This was an increase in what we reported during the middle of June when 54 percent of the manufacturing companies reported service center prices as rising.
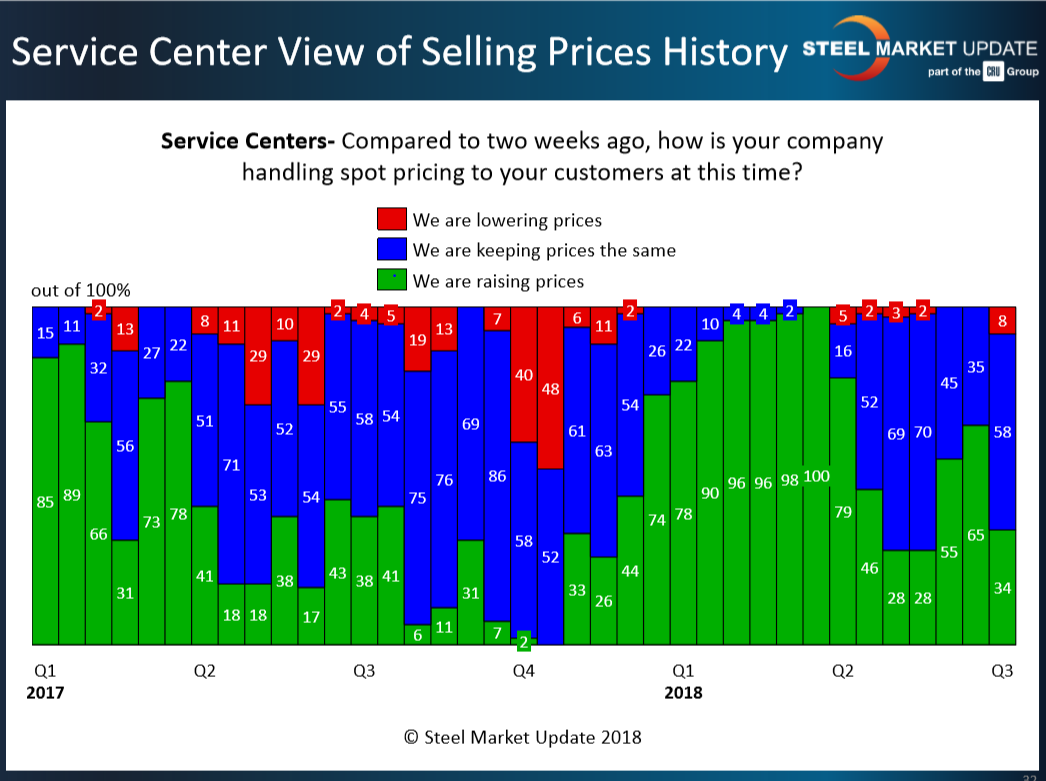
Service centers, on the other hand, were much more skeptical with only 34 percent of the responding distributors reporting their spot pricing to their customers as rising. This is down from 65 percent who reported spot prices as rising in the middle of June.
We have seen a significant amount of turmoil within the service center community as they report what their company is doing regarding spot pricing. Over this three-month time period, we have seen some erosion in mill pricing, depending on the product. Hot rolled and plate steels have been much more consistent, while cold rolled and coated products have seen mill average pricing seesawing with a combination of gains and losses depending on the week and the supplier.
The question we have to ask ourselves is, does the weakness in the service center response act as an early warning of weakness in mill pricing in the coming weeks?