Prices

July 25, 2018
Raw Material Prices: Scrap, Zinc, Iron Ore, Coke, Pig Iron
Written by Peter Wright
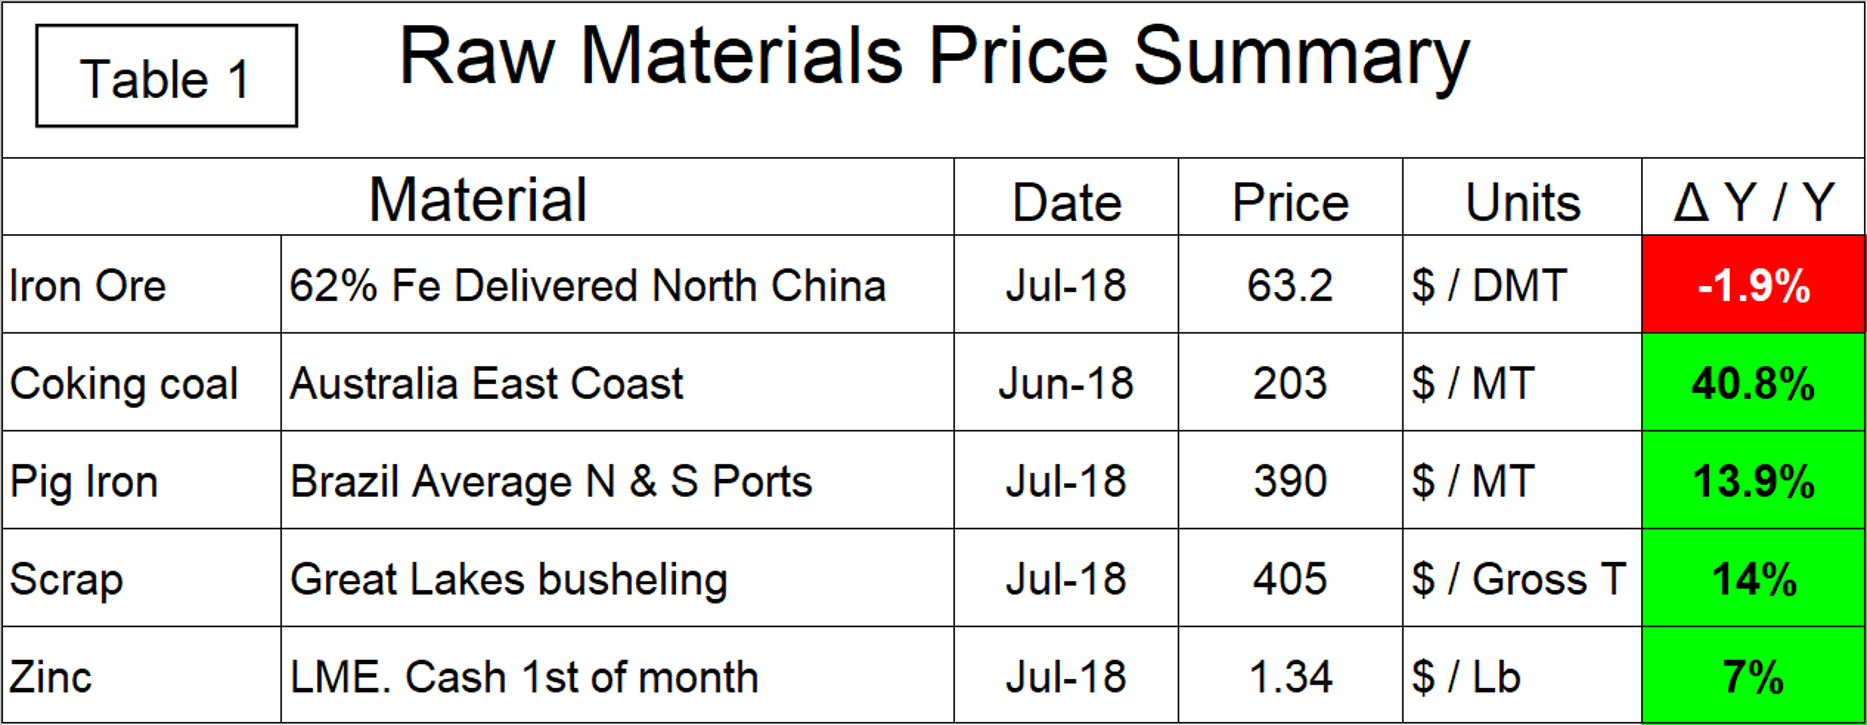
Steel Market Update’s latest look at commodity prices shows pig iron up, iron ore and zinc down, and coking coal and scrap stable in recent trading. Table 1 summarizes the current prices of the five materials considered in this report and the year-over-year change.
Iron Ore
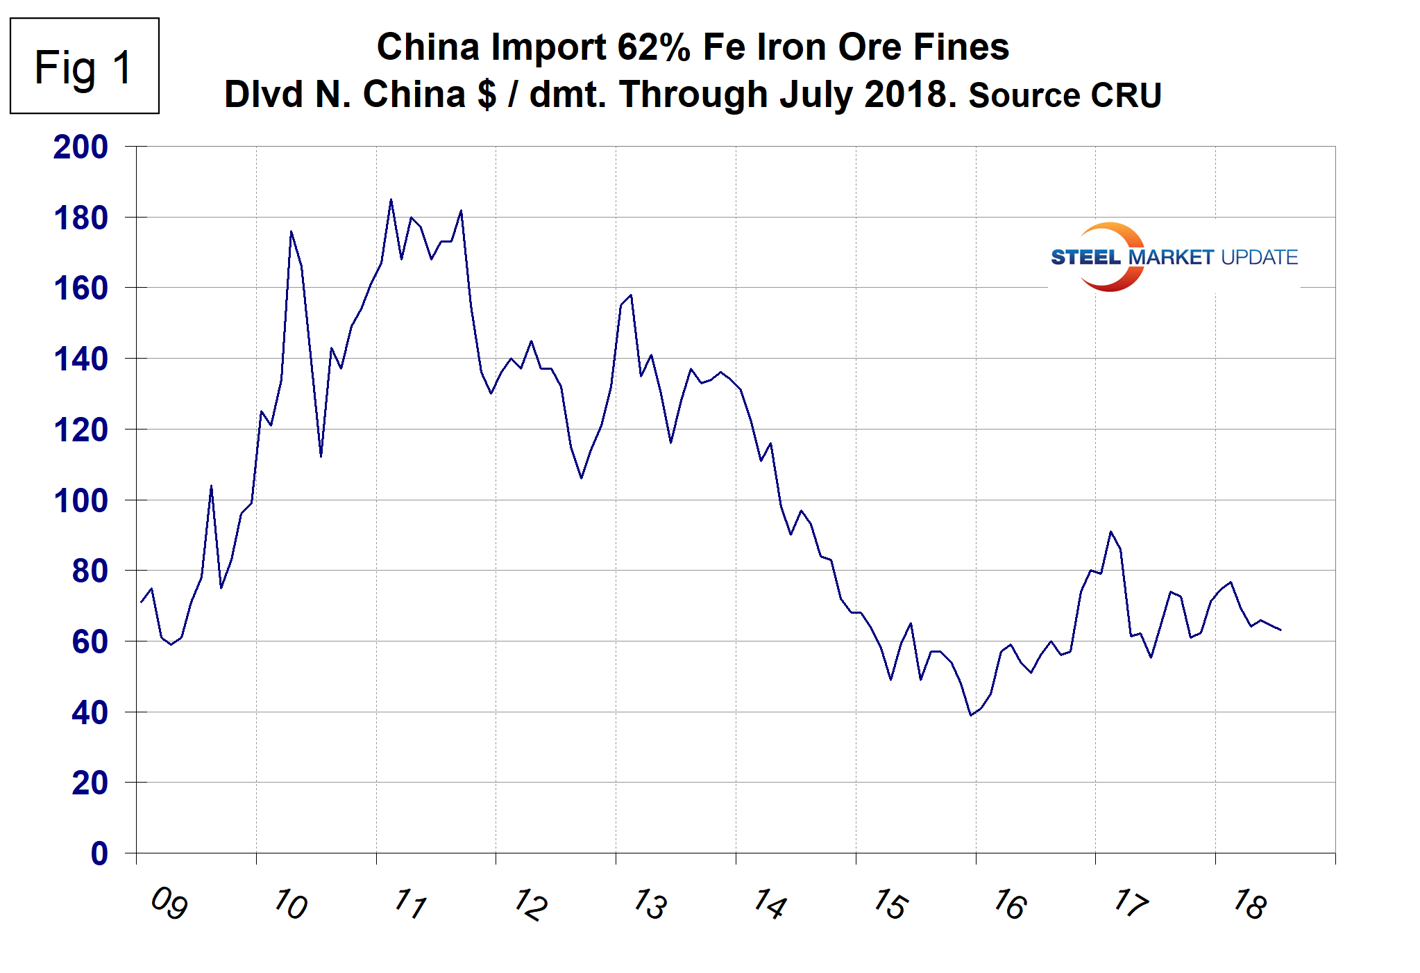
The price of 62% fines delivered North China was $63.20 per dry metric ton in early July. Year over year, the price was down by 1.9 percent. Ore is currently trading at the low end of a range that has predominated for almost two years.
Figure 1 shows the price of 62% Fe delivered North China since January 2009. The price recovered to $91.00 in February last year, but has been range bound since April 2017.
On July 13, Mining.com reported that Rio Tinto’s fully autonomous train, said to be the world’s largest robot, has completed its first delivery of 28,000 tons of iron ore between the company’s Mount Tom Price mine and the port of Cape Lambert. The trip was monitored remotely by operators at Rio’s Operations Centre in Perth more than 1,500 kilometers away. The average return distance of these trains is about 800 kilometers with the average journey cycle, including loading and dumping, taking 40 hours.
Coking Coal
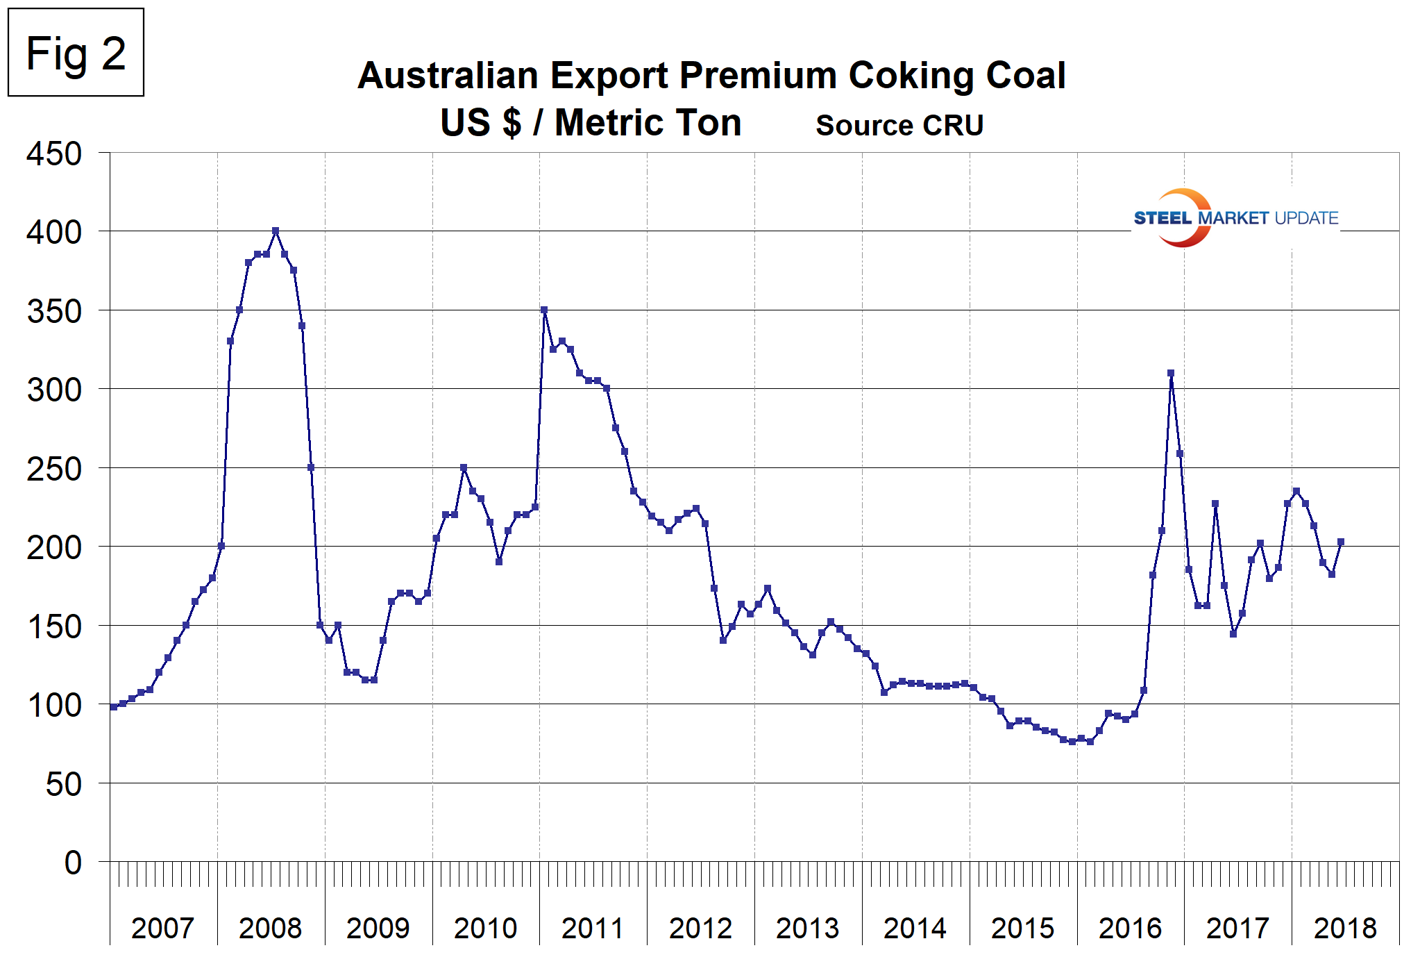
Coking coal prices have been erratic in the last two years. From February 2016 to November 2016, the price of premium low volatile coking coal more than quadrupled from $76 to $310 per metric ton. Since then the price has stabilized in the $200 range and in June stood at $203 (Figure 2).
Pig Iron
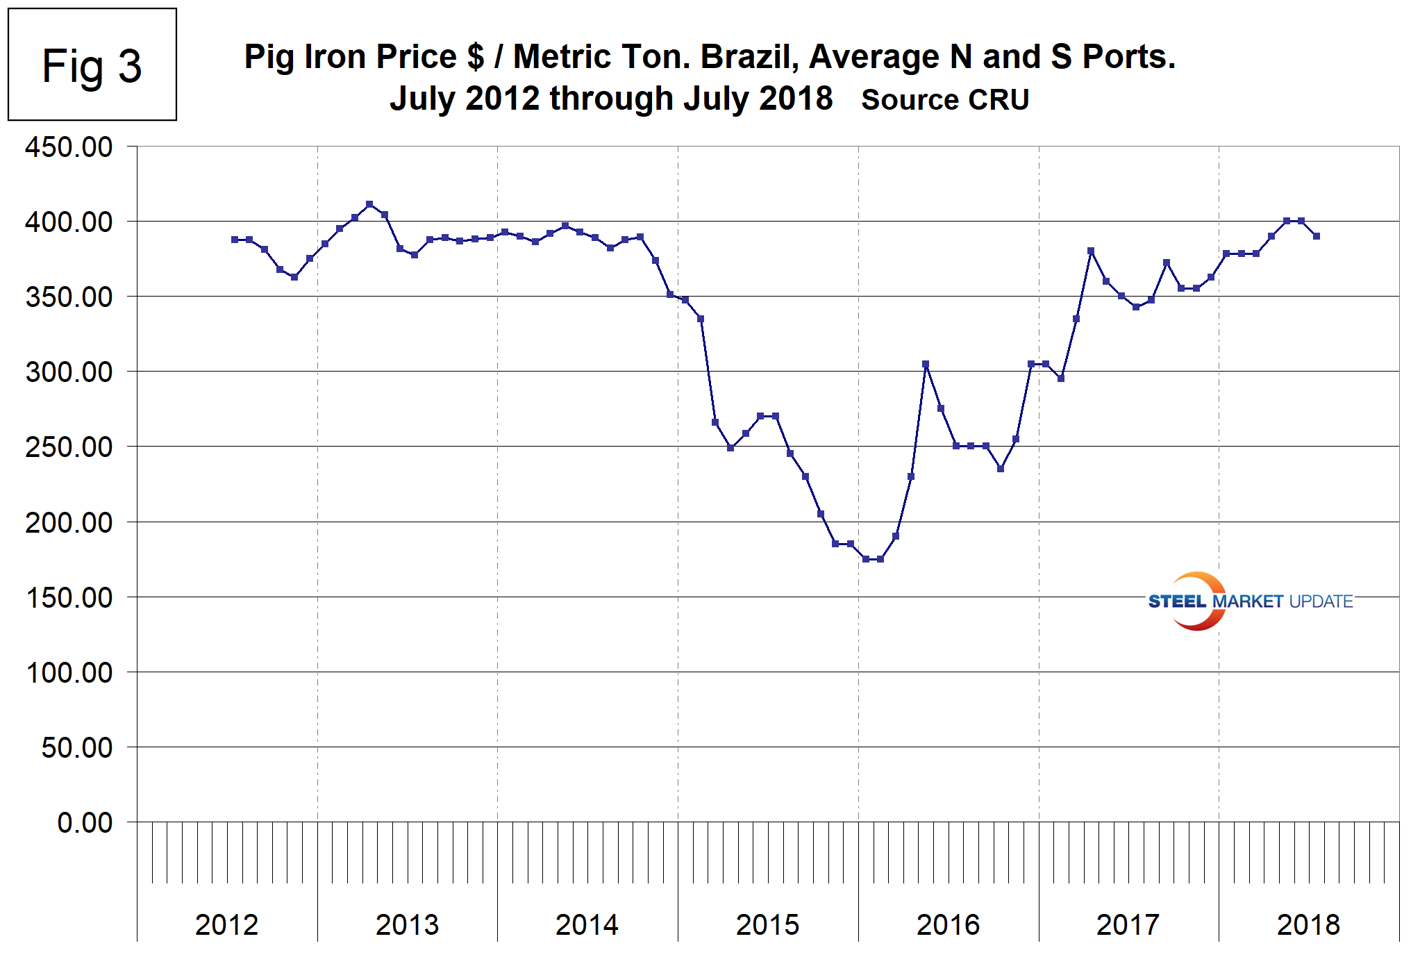
Most of the pig iron imported to the U.S. currently comes from Russia, Ukraine and Brazil with additional material from South Africa and Latvia. In this report, we summarize prices out of Brazil and average the FOB value from the north and south ports. The price steadily increased from the $175 low point in January and February 2016 to $400 in May and June 2018 before declining to $390 in July. Year over year, the price of Brazilian pig iron has increased by 13.9 percent (Figure 3).
Scrap
To put this raw materials commentary into perspective, we include here Figure 4, which shows the spread between busheling in the Great Lakes region and hot rolled coil Midwest U.S. through early July 2018, both in dollars per net ton. The spread at $558.39 is now higher than at any time since the bubble of Q3 2008 and has increased every month since September 2017 when it stood at $278.48.
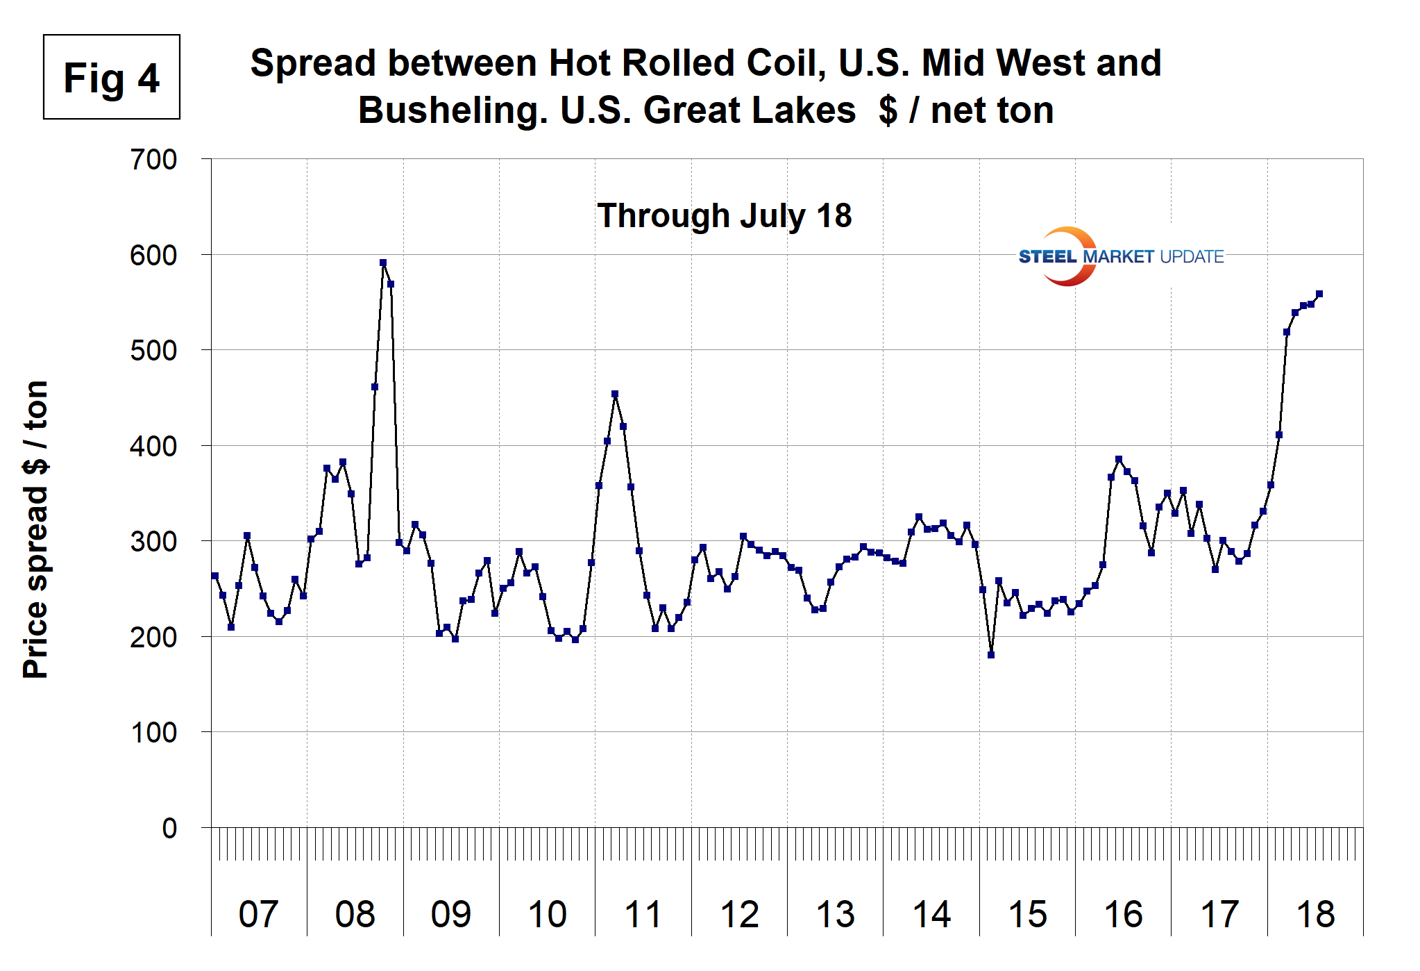
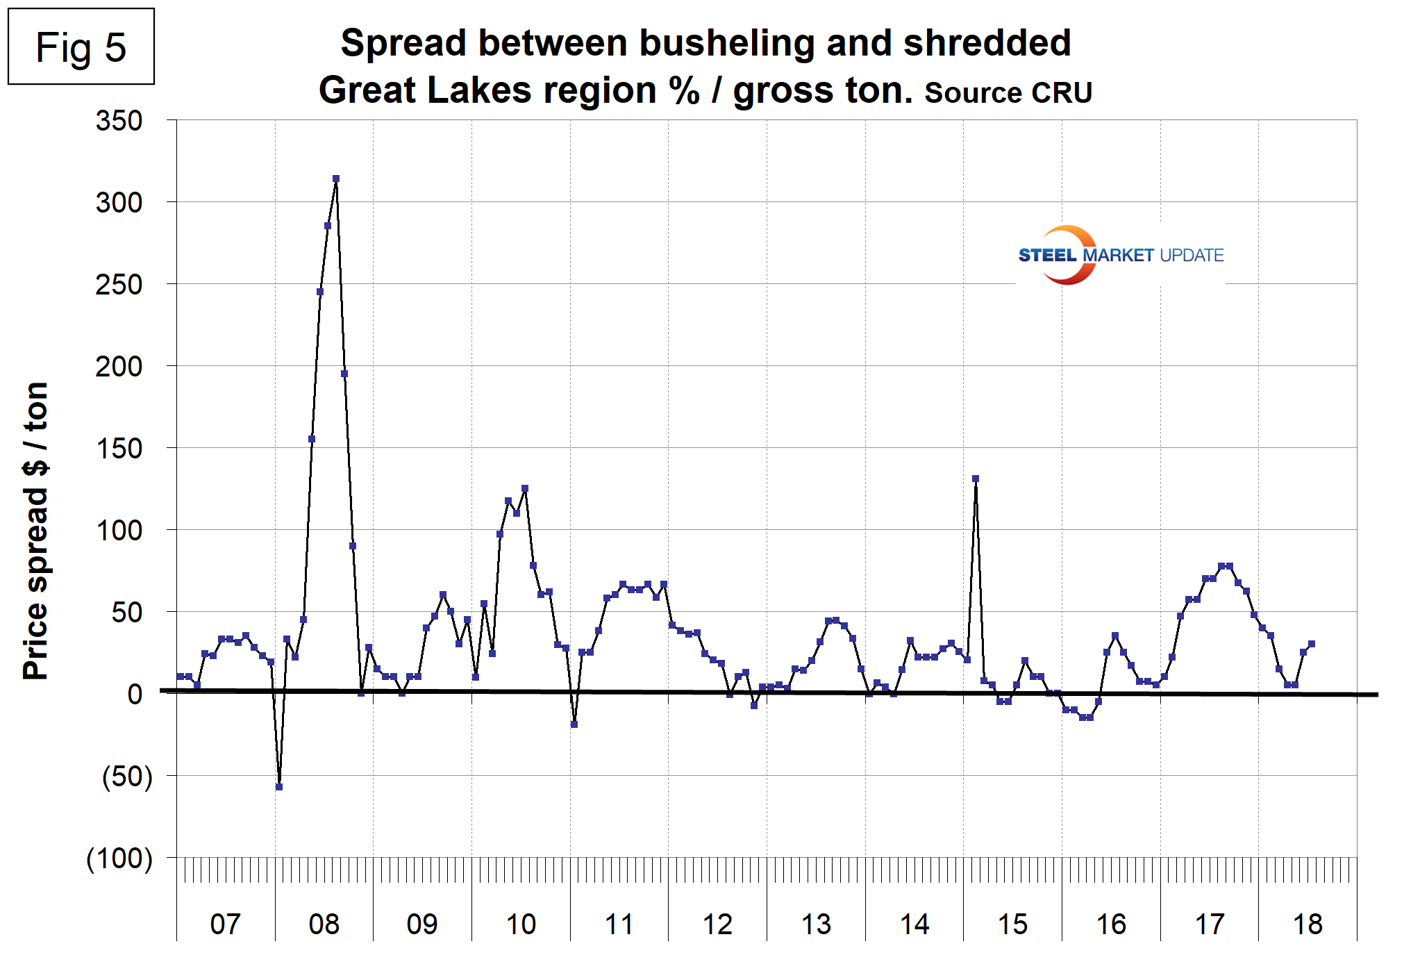
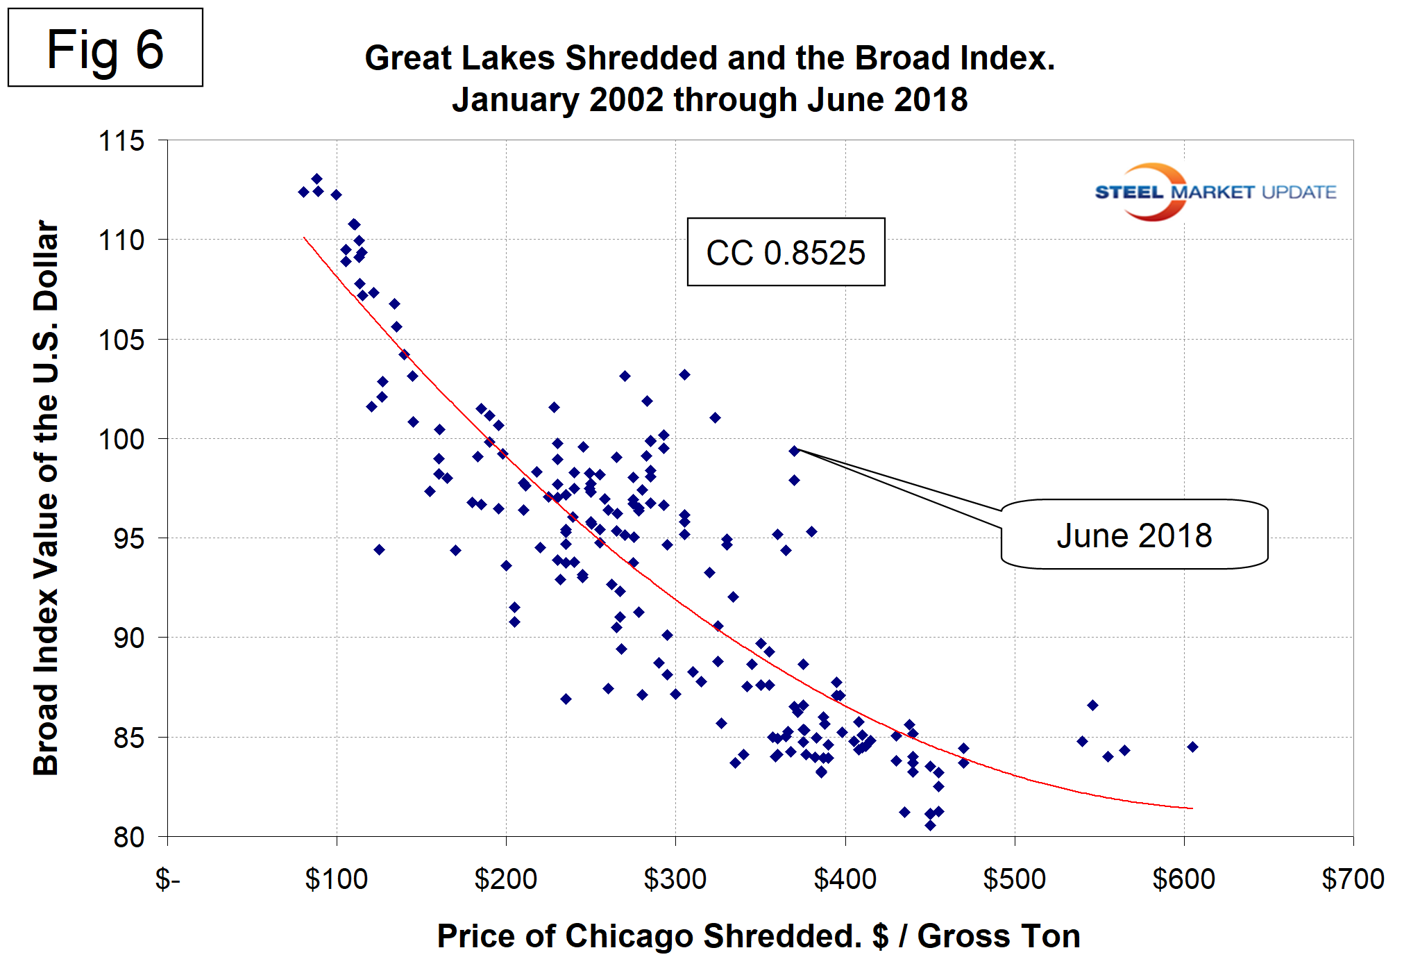
Figure 5 shows the relationship between shredded and busheling, both priced in dollars per gross ton in the Great Lakes region. In June and July, shredded was unchanged at $370 per gross ton, up from $265 in October 2017. Busheling was unchanged in May at $390 per gross ton, rose $5 in June and $10 in July. The busheling premium over shredded rose from $10 in April to $35 in July. Figure 6 is a scatter gram of the price of Chicago shredded and the Broad Index value of the U.S. dollar as reported by the Federal Reserve. The latest data for the Broad Index was June. This is a causal relationship with a correlation of over 85 percent.
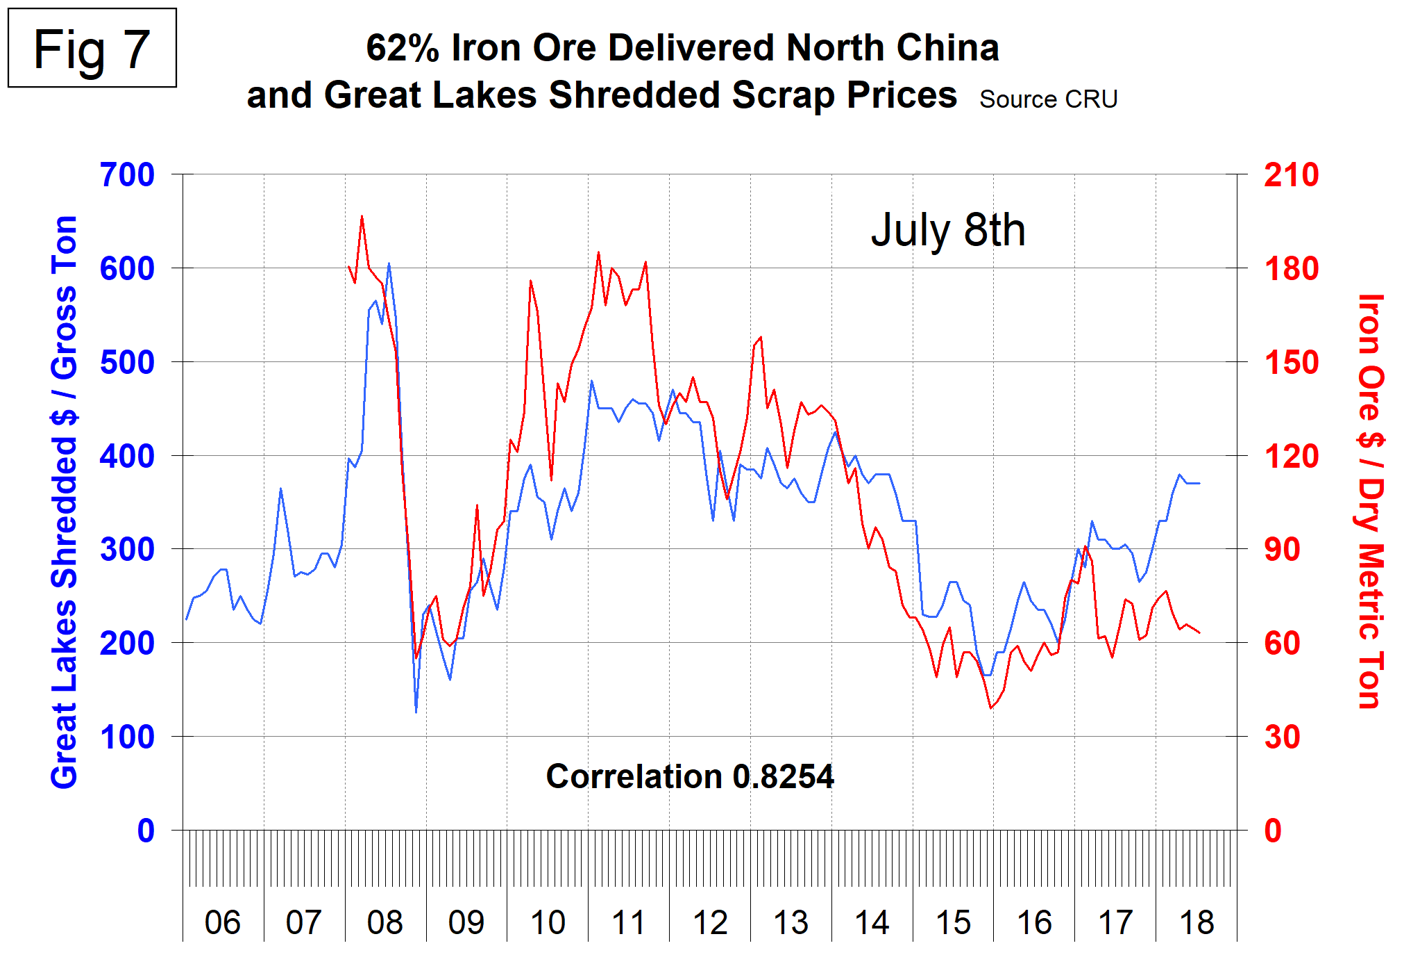
There is a long-term relationship between the prices of iron ore and scrap. Figure 7 shows the prices of 62% iron ore fines delivered N. China and the price of shredded scrap in the Great Lakes region through early July 2018. The correlation since January 2006 has been 82.54 percent.
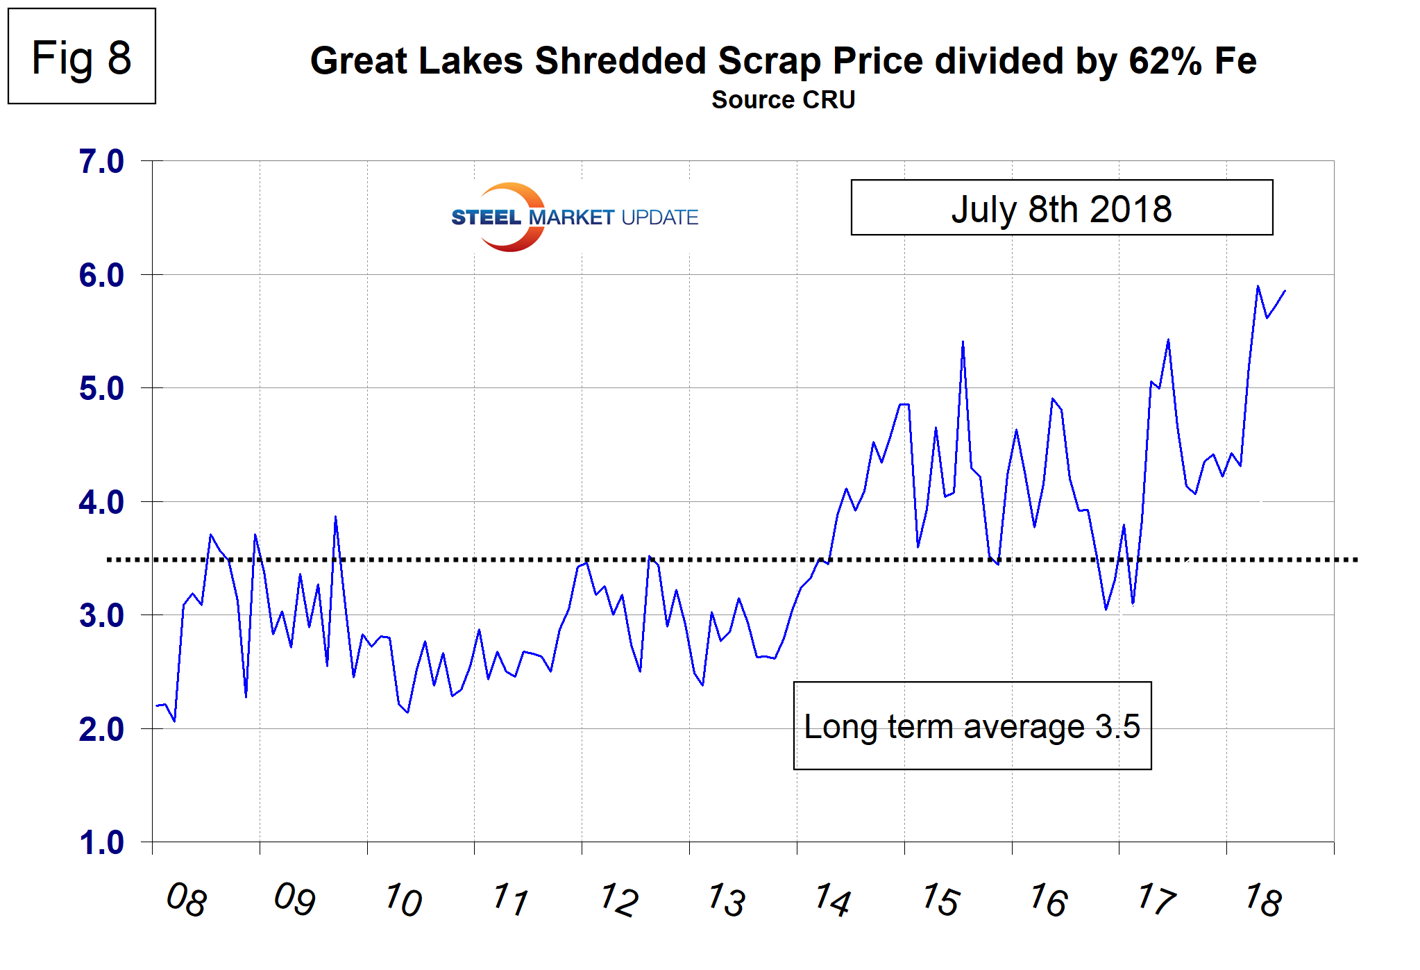
In the last 10 years, scrap in dollars per gross ton has been on average 3.4 times as expensive as ore in dollars per dry metric ton (dmt). The ratio has been erratic since mid-2014, but overall since then has benefited the integrated producers. In July, the ratio at 5.9 is the highest since our data stream began in January 2006 and equal to April 2018 (Figure 8). Since Chinese steel manufacture is 95 percent BOF, this ratio has allowed them to be more competitive on the global steel market. In the last four years, there have been times when China could supply semi-finished to the global market at prices competitive with scrap.
Zinc
The LME cash price for zinc on the first of each month is shown in Figure 9. The price of zinc on July 1 was $1.34 per pound, down from a high of $1.63 on Feb. 1.
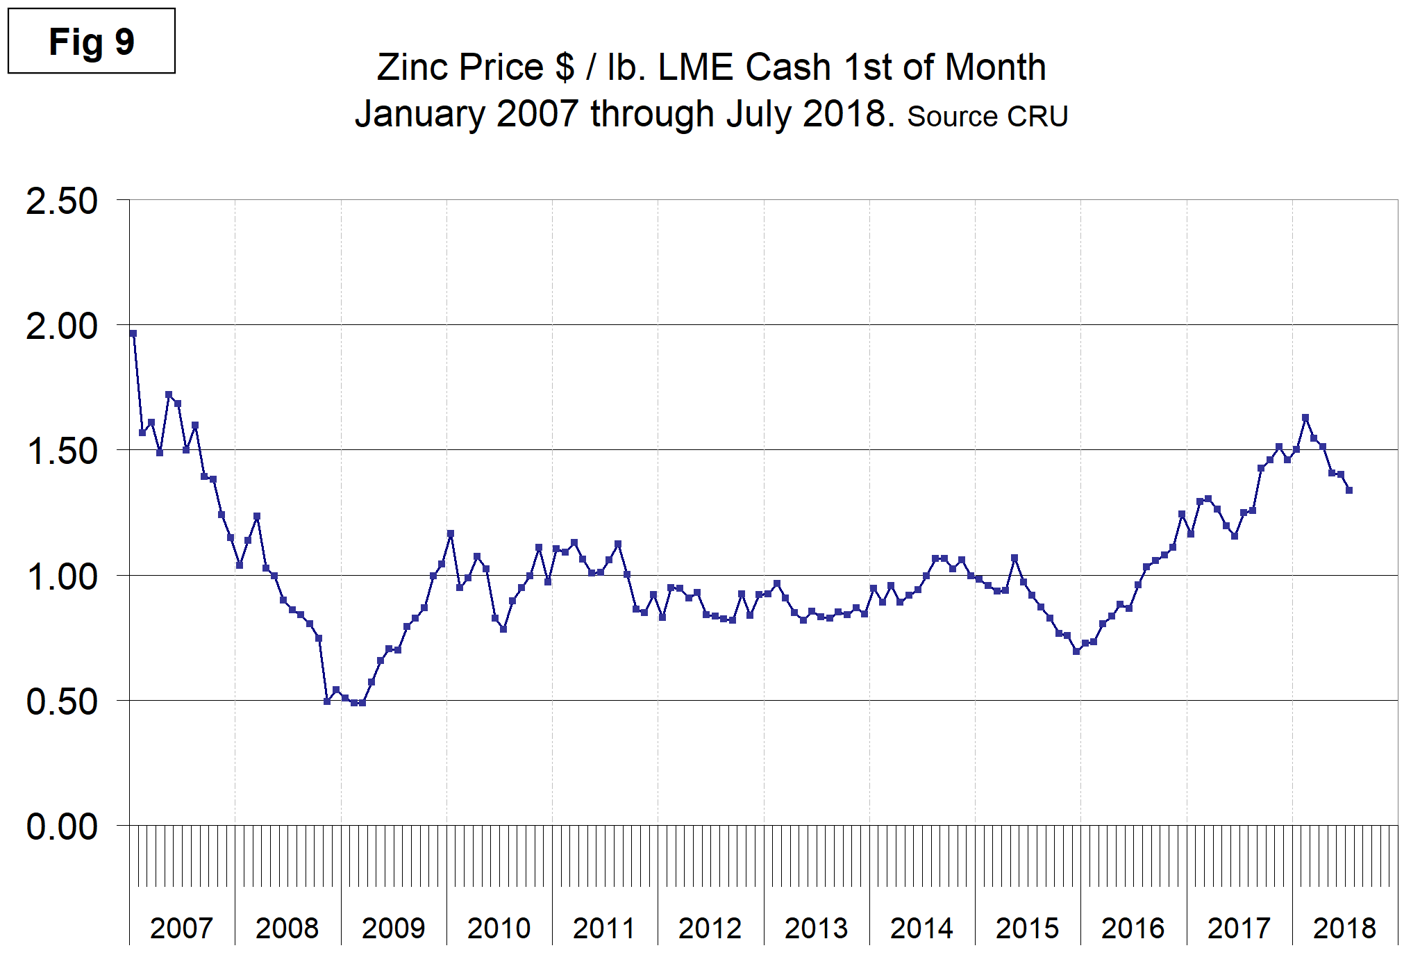
As Bloomberg reported June 28, zinc continued to slide after entering a bear market amid concern about increased supply and declining demand. The industrial metal fell for a ninth straight session, its longest losing streak in more than three years, to trade at $2,815 a metric ton, the lowest in 10 months. It’s the worst-performing base metal this year on the London Metal Exchange. “Continuously increasing LME inventories and weak Chinese demand added to worsening zinc fundamentals,” said Casper Burgering, an economist at ABN Amro Bank NV. “Supplies of zinc concentrates will continue rising. As a result, zinc prices will weaken further.”
Zinc is the fourth most widely used metal in the world after iron, aluminum and copper. Its primary uses are 60 percent for galvanizing steel, 15 percent for zinc-based die castings and about 14 percent in the production of brass and bronze alloys.
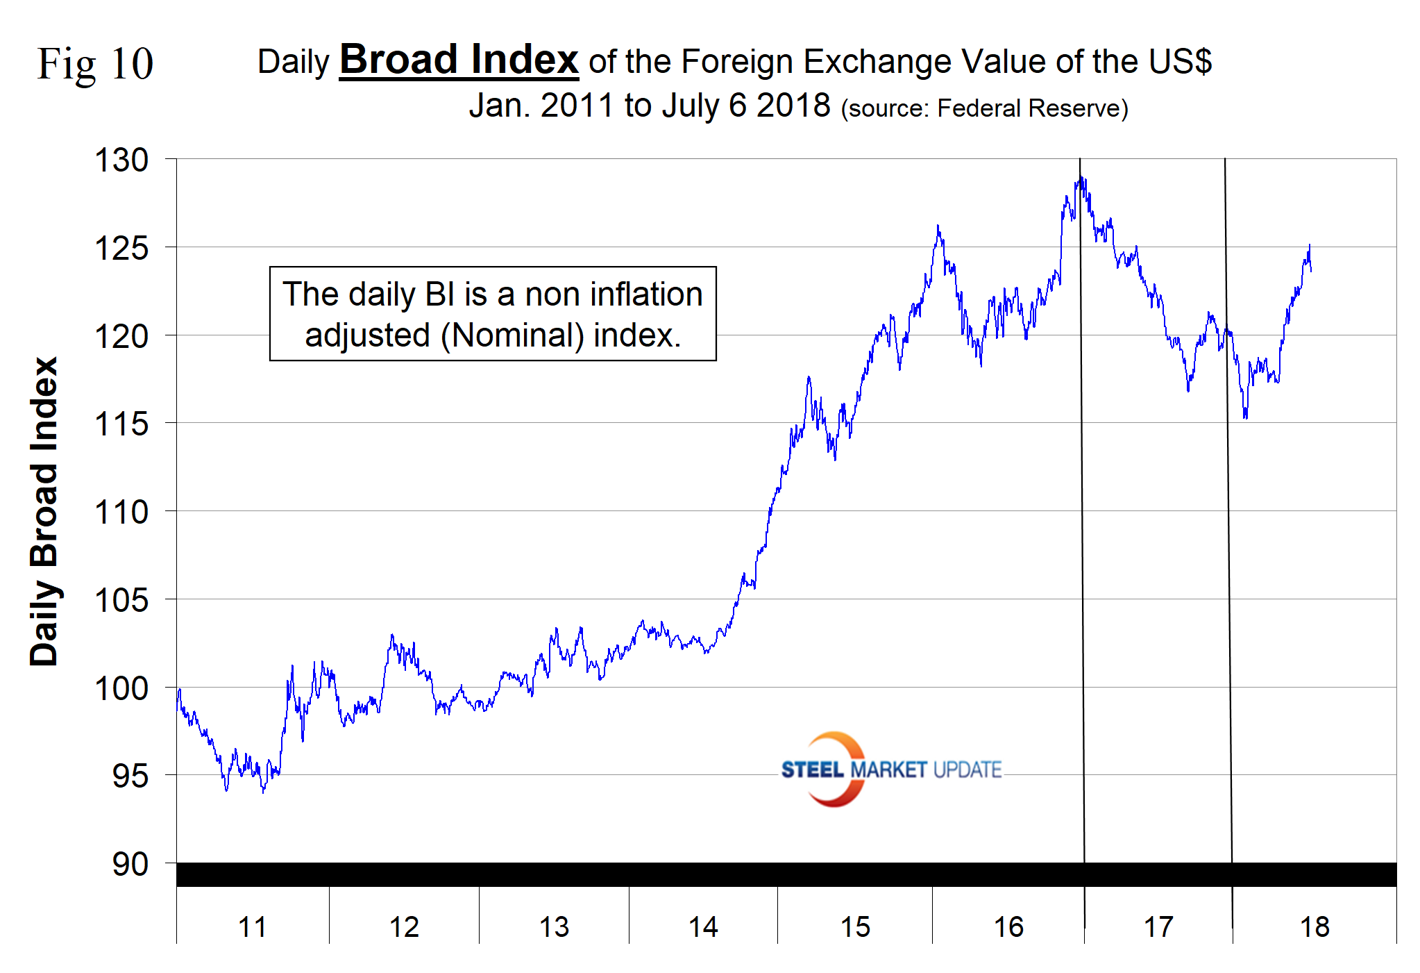
SMU Comment: There is an inverse relationship between commodity prices and the value of the U.S. dollar on the global currency markets. After falling for most of 2017 and through Feb 1, 2018, the dollar has experienced a sharp upward reversal and through July 6 was up by 7.2 percent (Figure 10). Supply and demand fundamentals are the primary drivers of raw materials prices, but a rising dollar puts downward pressure on the price of those global commodities that are priced in dollars, as is clearly shown by the relationship between scrap and the dollar index described above in Figure 6.