

Market Data

August 7, 2018
BLS: Strong Hiring in Manufacturing, Construction
Written by Peter Wright
In June 2018, 12,751,000 people were employed in manufacturing and 7,242,000 in construction. Construction employment has grown by 4.4 percent in the last 12 months, while jobs in manufacturing have increased by 2.6 percent. In the last three months, however, manufacturing employment has gained almost twice the number of jobs as construction, according to Steel Market Update’s latest analysis of Bureau of Labor Statistics (BLS) data. Strong hiring in both construction and manufacturing are positive indicators of future steel sales.
Table 1 breaks total employment down into service and goods-producing industries and then into private and government employees. Most of the goods-producing employees work in manufacturing and construction and the components of these two sectors of most relevance to steel people are broken out in Table 1.
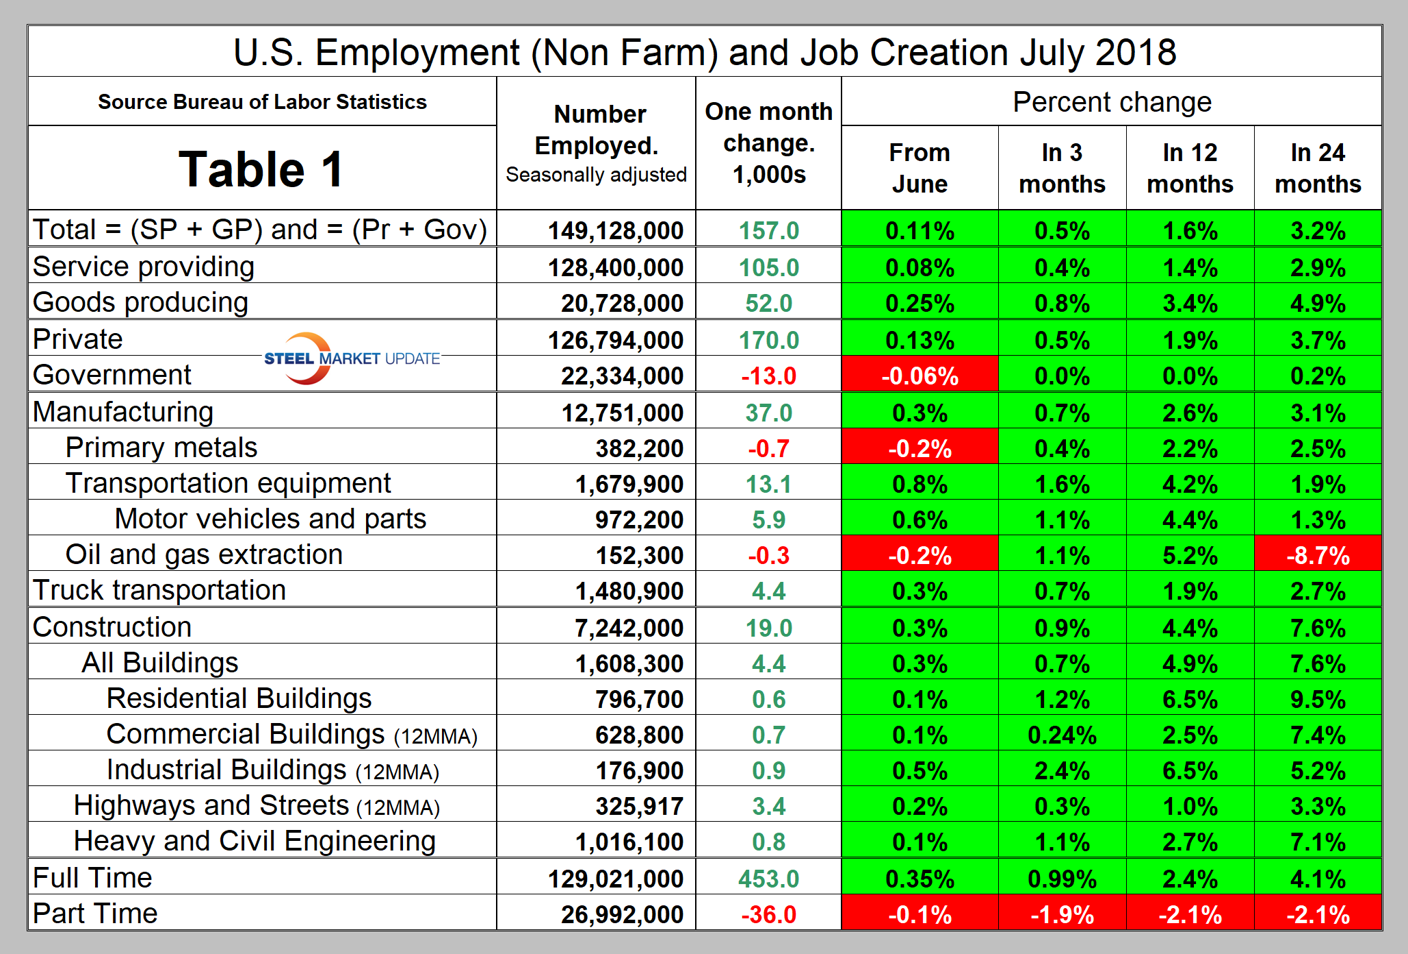
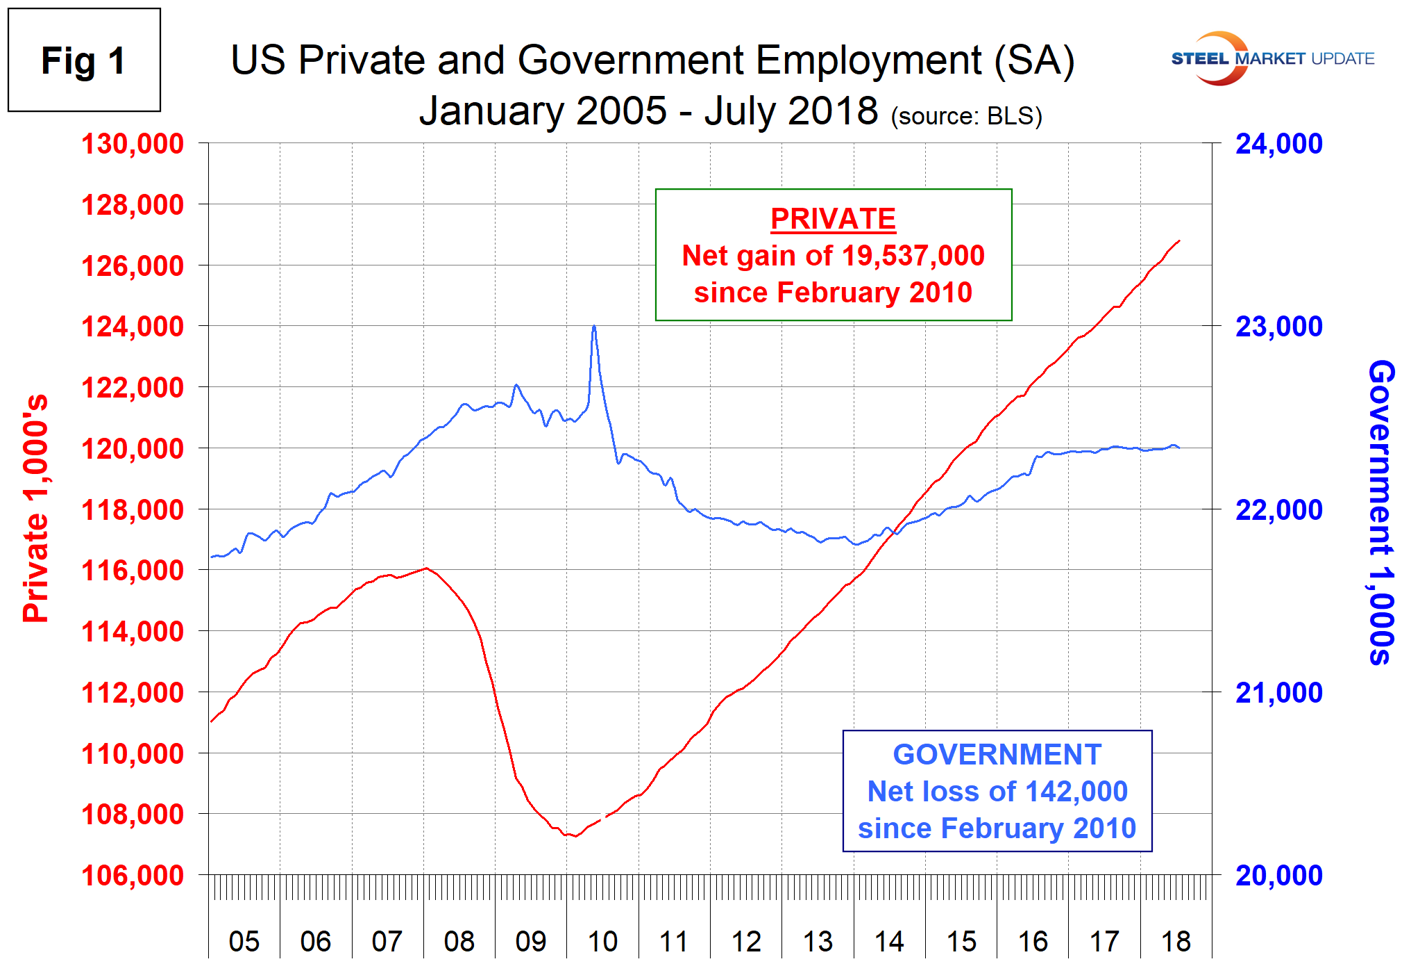
In July, 170,000 jobs were created in the private sector and government lost 13,000 jobs. The number employed by the federal government increased by 2,000 to 2.8 million, state governments gained 5,000 positions for a total of 5.1 million and local governments lost 20,000 to reach a total of 14.41 million. Since February 2010, the employment low point, private employers have added 19,537,000 jobs as government has lost 142,000 (Figure 1).
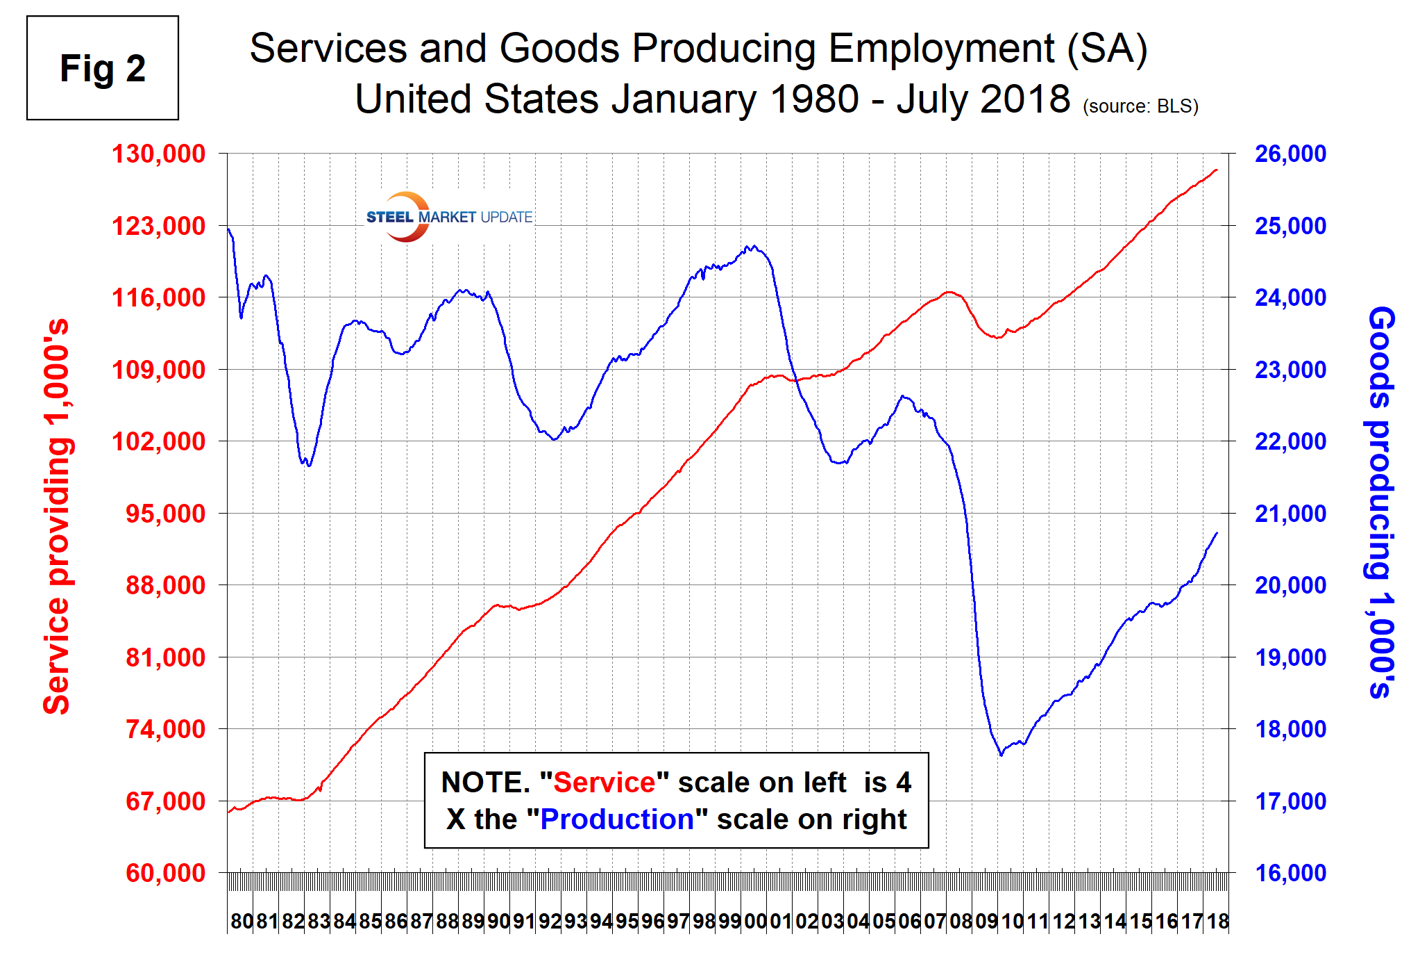
In July, service industries expanded by 105,000 jobs as goods-producing industries, driven mainly by construction and manufacturing, expanded by 52,000 (Figure 2). Since February 2010, service industries have added 16,294,000 and goods-producing 3,101,000 positions. This has been a drag on wage growth since the recession as service industries on average pay less than goods-producing industries such as manufacturing.
Construction was reported to have gained 19,000 jobs in July after a 13,000 gain in June. Year to date, construction has added 170,000 jobs. According to the Associated General Contractors of America, construction employment is at a 10-year high, construction continues to add jobs faster than the economy as a whole and the industry is paying premium wages to attract and retain workers. Hourly wages in the industry averaged $29.86, an increase of 2.7 percent year over year.
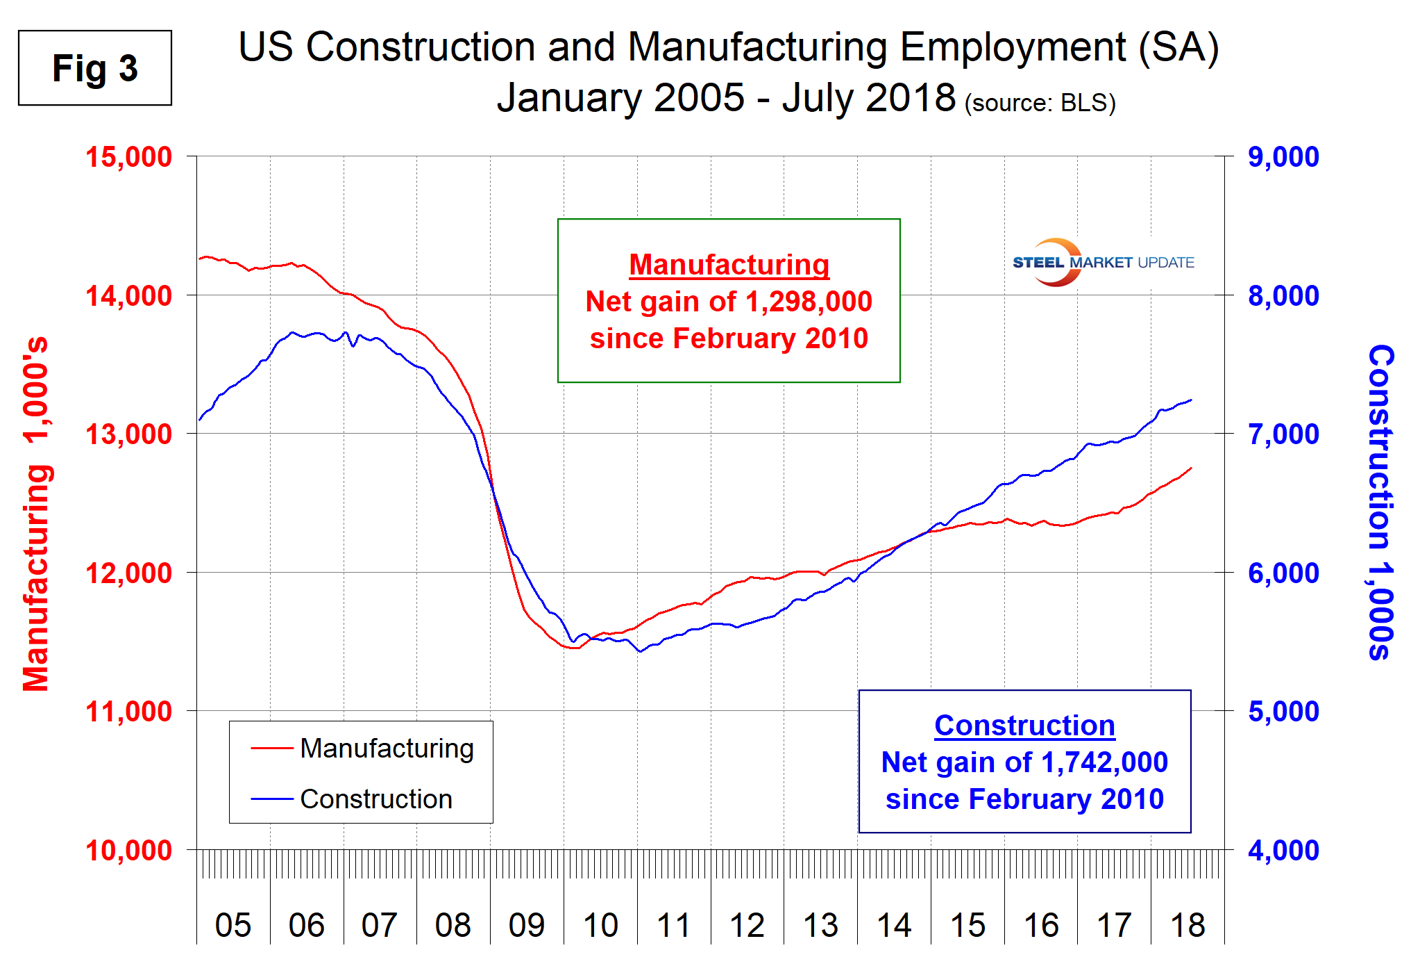
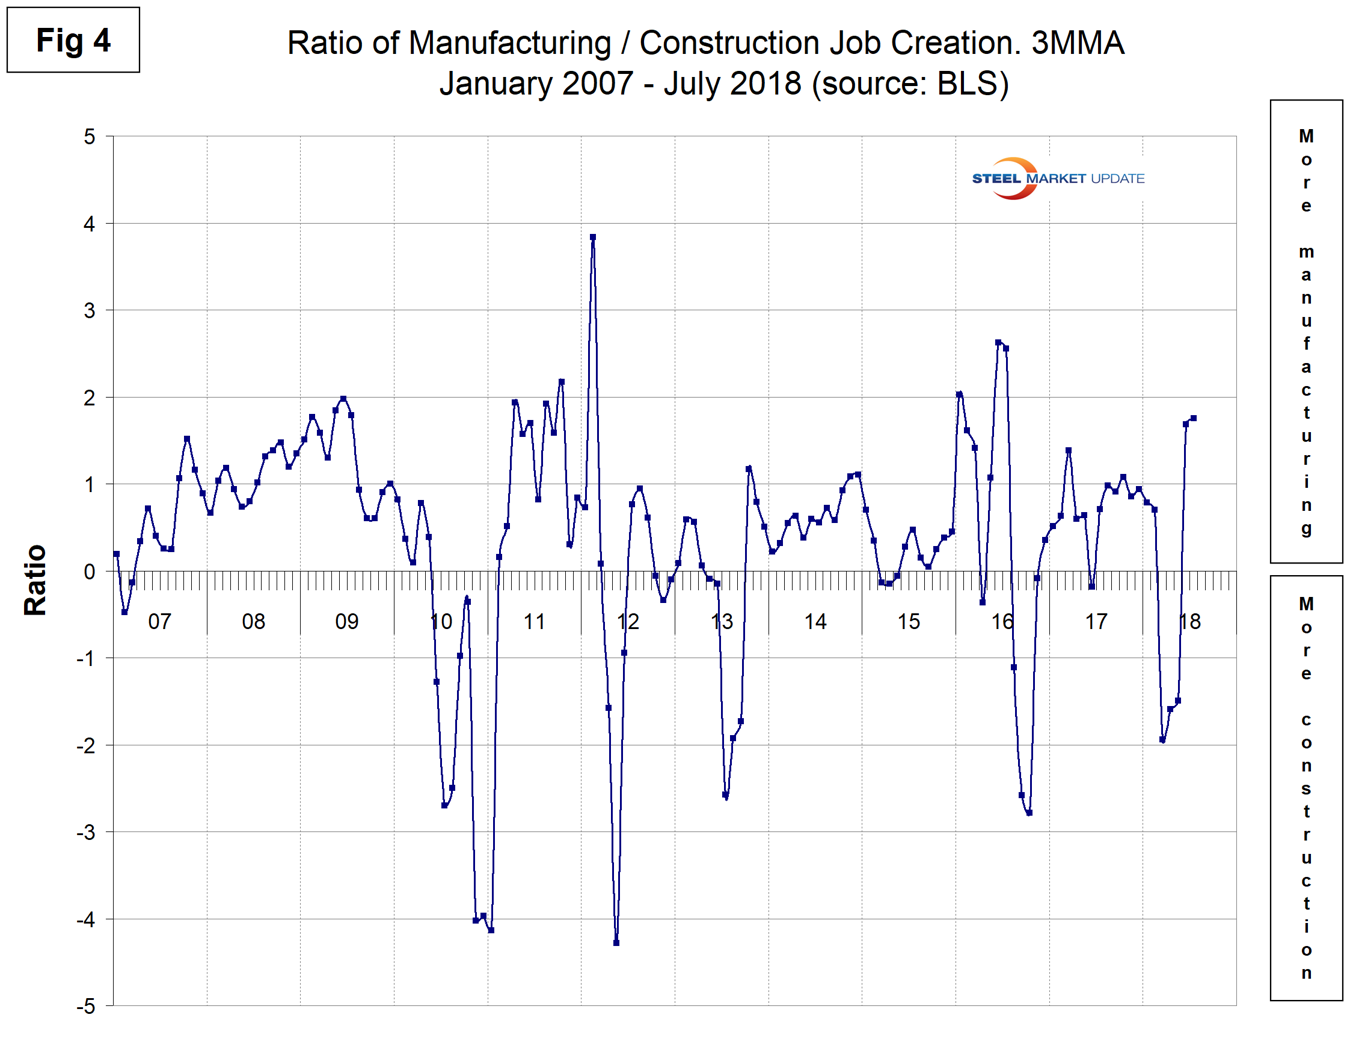
Manufacturing added 37,000 jobs in July following a 33,000 gain in June and has added 193,000 jobs year to date. Figure 3 shows the history of construction and manufacturing employment since January 2005. Construction has added 1,742,000 jobs and manufacturing 1,298,000 since the recessionary employment low point in February 2010 (Figure 3). In the last three months, manufacturing has added jobs at almost twice the rate of construction as shown by the ratio in Figure 4.
Note, the subcomponents of both manufacturing and construction shown in Table 1 don’t add up to the total because we have only included those with the most relevance to the steel industry.
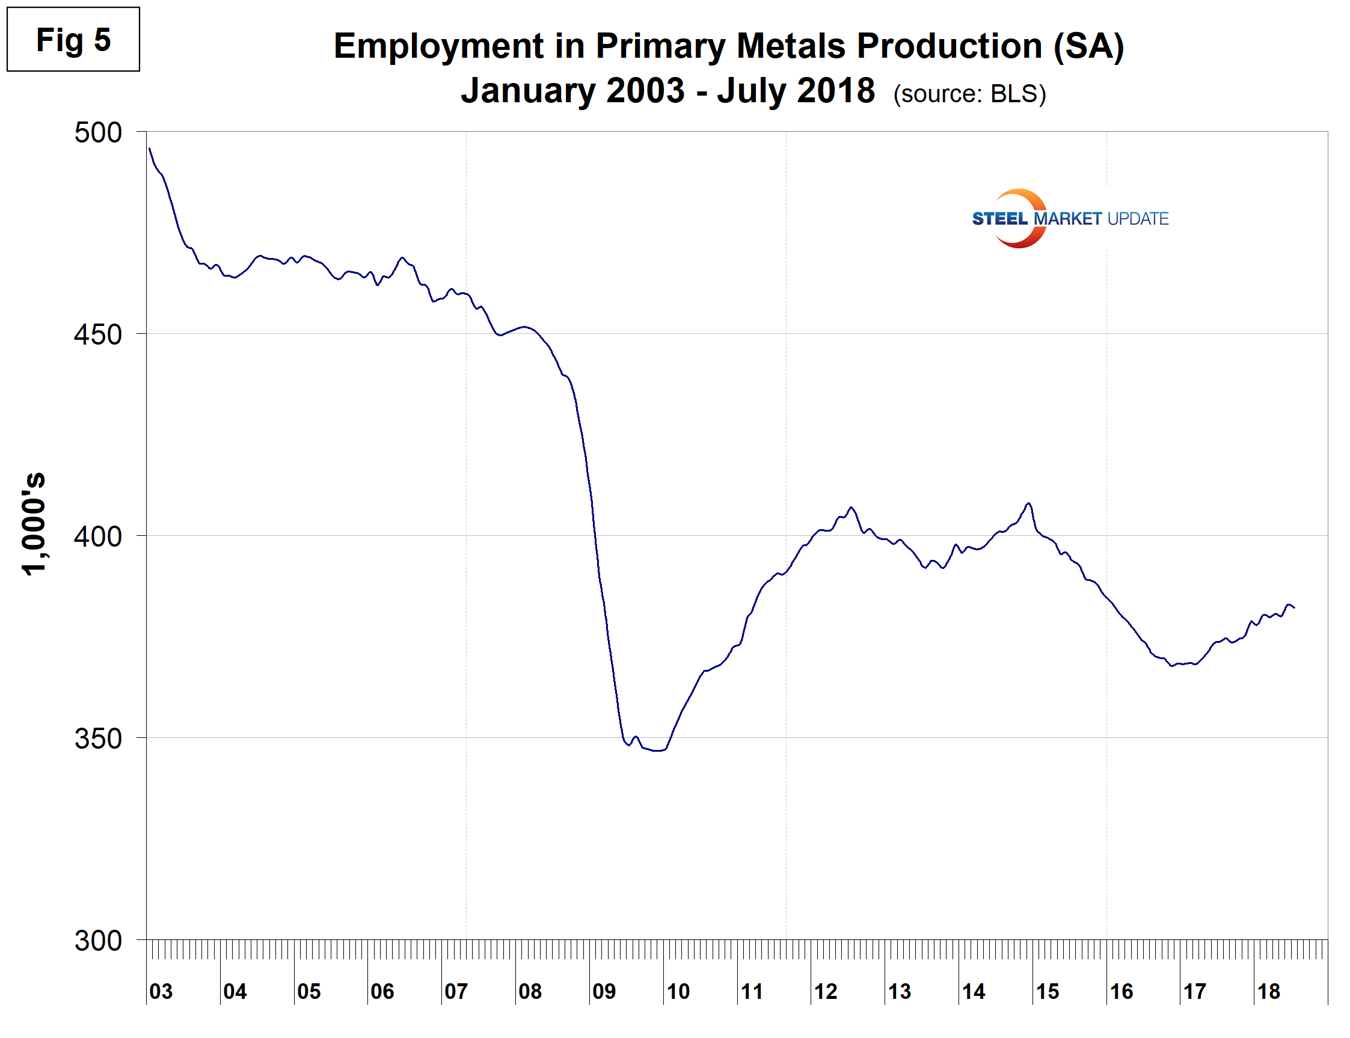
Table 1 shows that primary metals lost 700 jobs in July, and in the last 12 months on a percentage basis was up by slightly less than total manufacturing. Figure 5 shows the history of primary metals employment since January 2003.
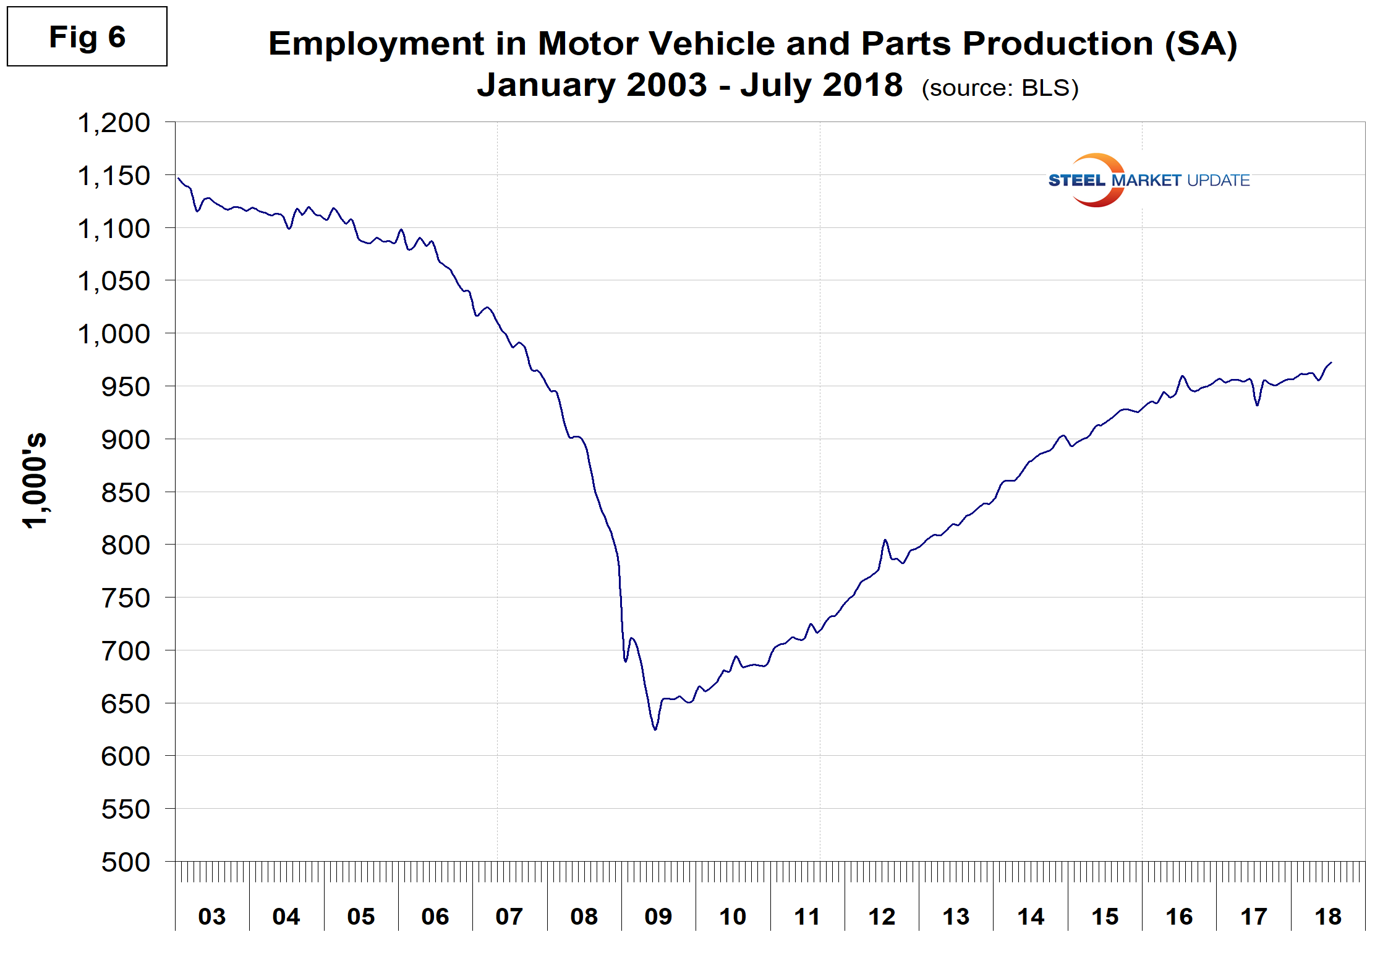
Motor vehicles and parts industries were reported to have gained 5,900 jobs in July. Figure 6 shows the history of motor vehicles and parts employment. The flattening in the last two years is a reflection of U.S. light vehicle sales.
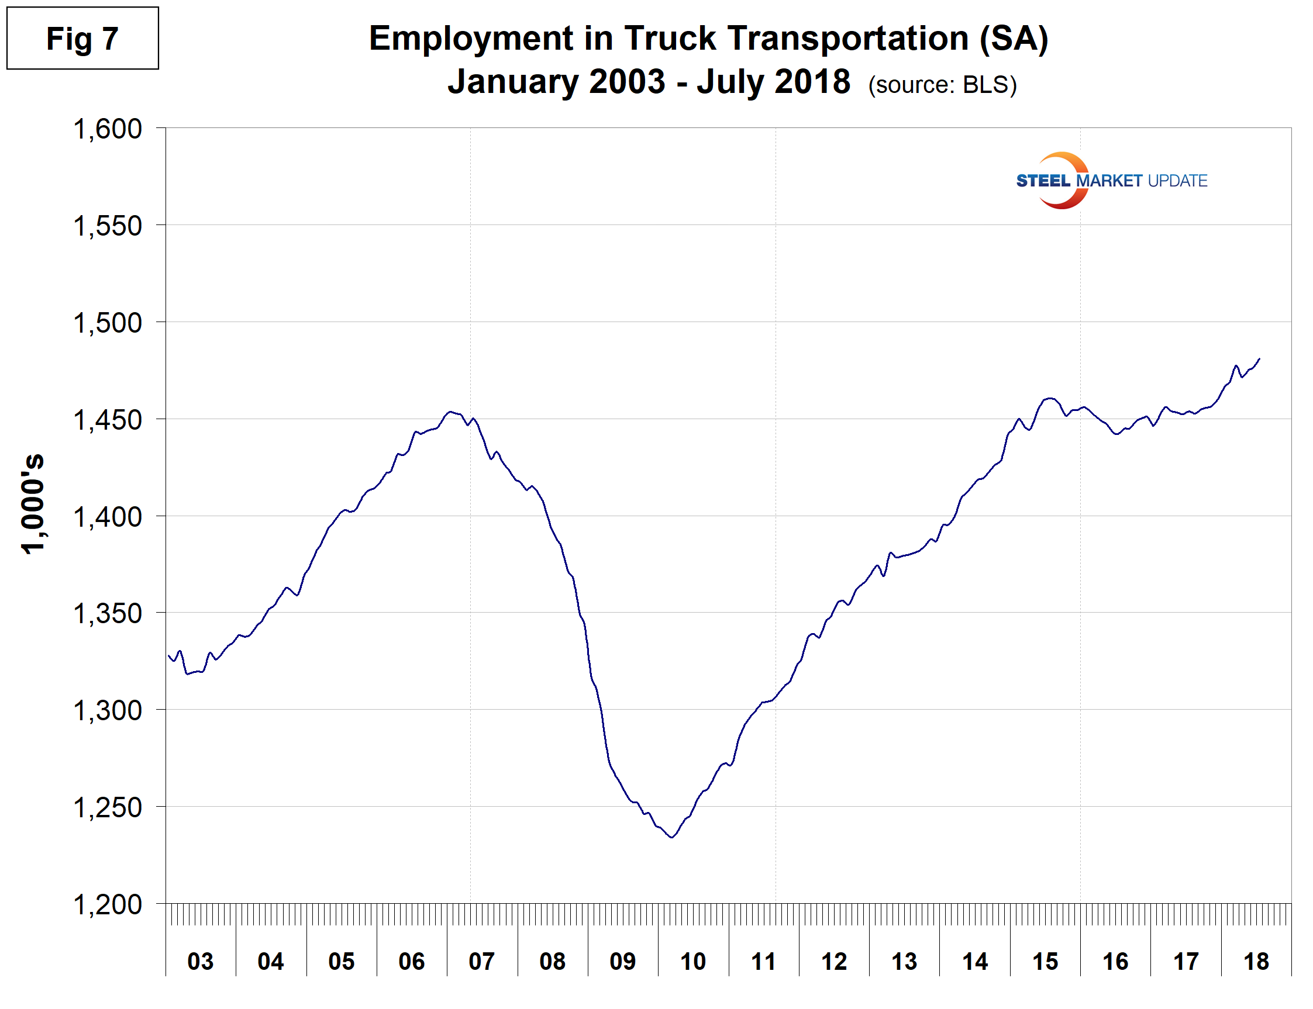
Trucking gained 4,400 jobs in July, 20,600 jobs year to date, and is the highest since our data stream began in January 2003 (Figure 7).
SMU Comment: Employment growth in manufacturing and construction are signposts for steel sales activity and at present look good.
Explanation: On the first Friday of each month, the Bureau of Labor Statistics releases the employment data for the previous month. Data is available at www.bls.gov. The BLS employment database is a reality check for other economic data streams such as manufacturing and construction. It is easy to drill down into the BLS database to obtain employment data for many subsectors of the economy. The important point about all these data streams is the direction in which they are headed.


