

Market Data

September 13, 2018
BLS: Employment by Industry for August
Written by Peter Wright
Net job creation in August totaled 201,000 positions. Manufacturing took a small step back, but year to date the results are good, according to Steel Market Update’s latest analysis of Bureau of Labor Statistics (BLS) data.
Table 1 breaks total employment down into service and goods-producing industries and then into private and government employees. Most of the goods-producing employees work in manufacturing and construction, and the components of these two sectors of most relevance to steel people are broken out in Table 1.
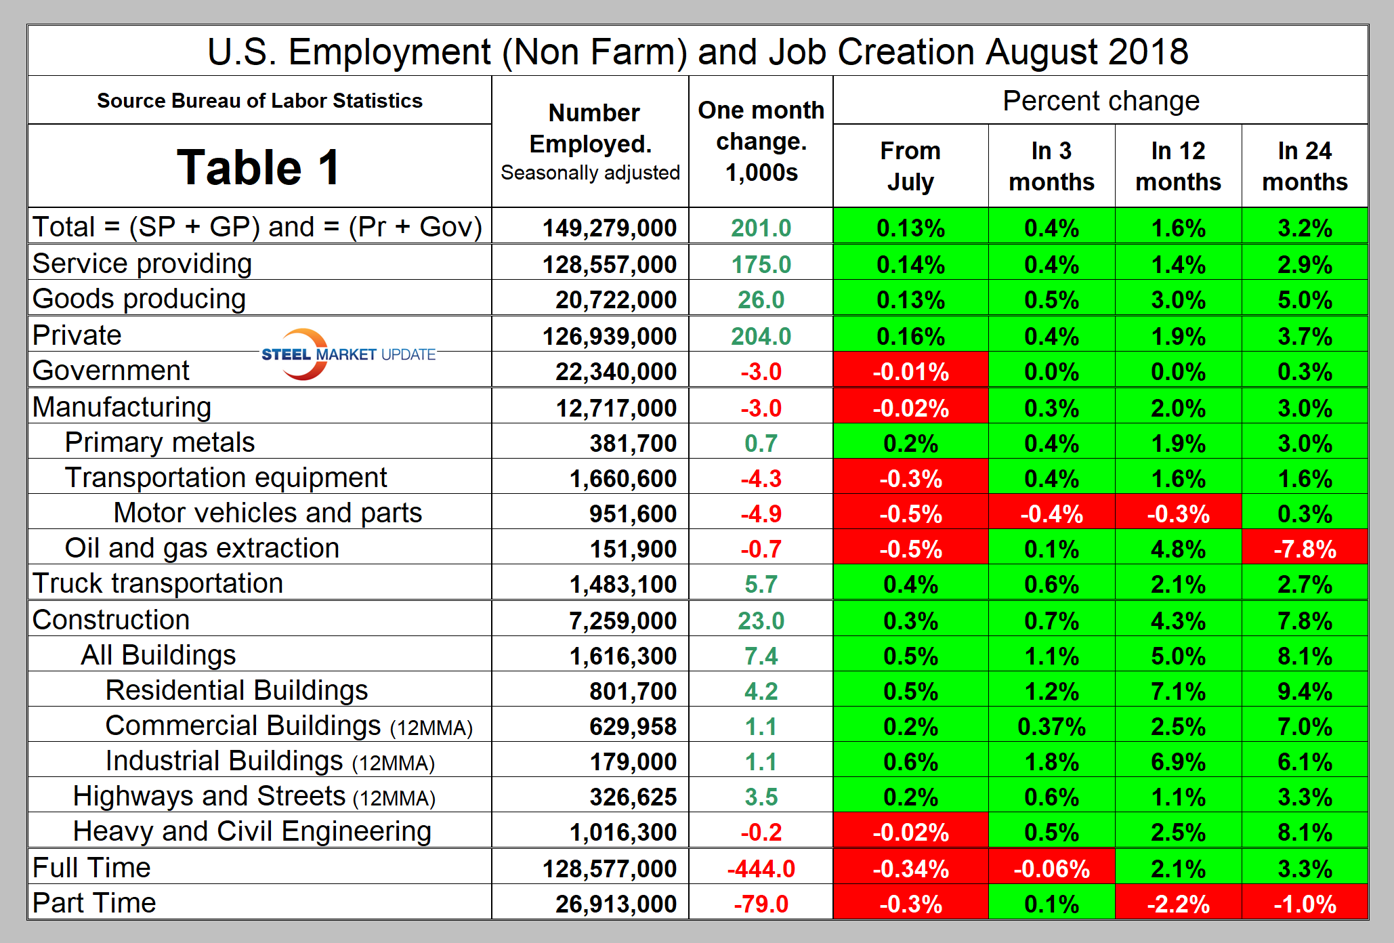
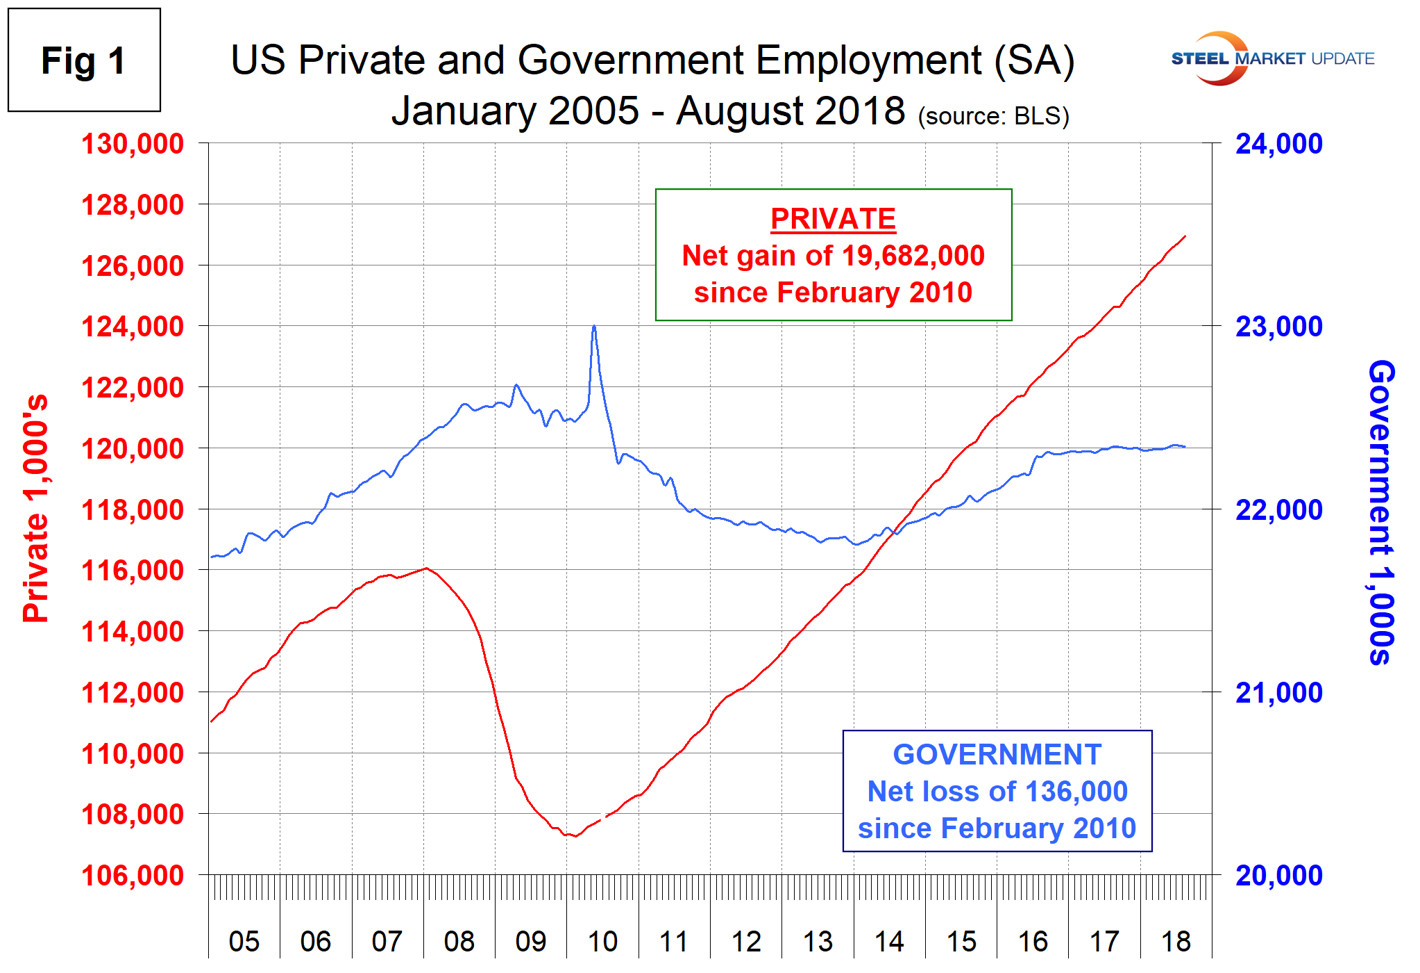
In August, 204,000 jobs were created in the private sector and government lost 3,000 jobs. The number employed by the federal government was unchanged at 2.8 million, state governments lost 1,000 positions for a total of approximately 5.1 million and local governments lost 2,000 for a total of 14.4 million. Since February 2010, the employment low point, private employers have added 19,682,000 jobs as government has lost 136,000 (Figure 1).
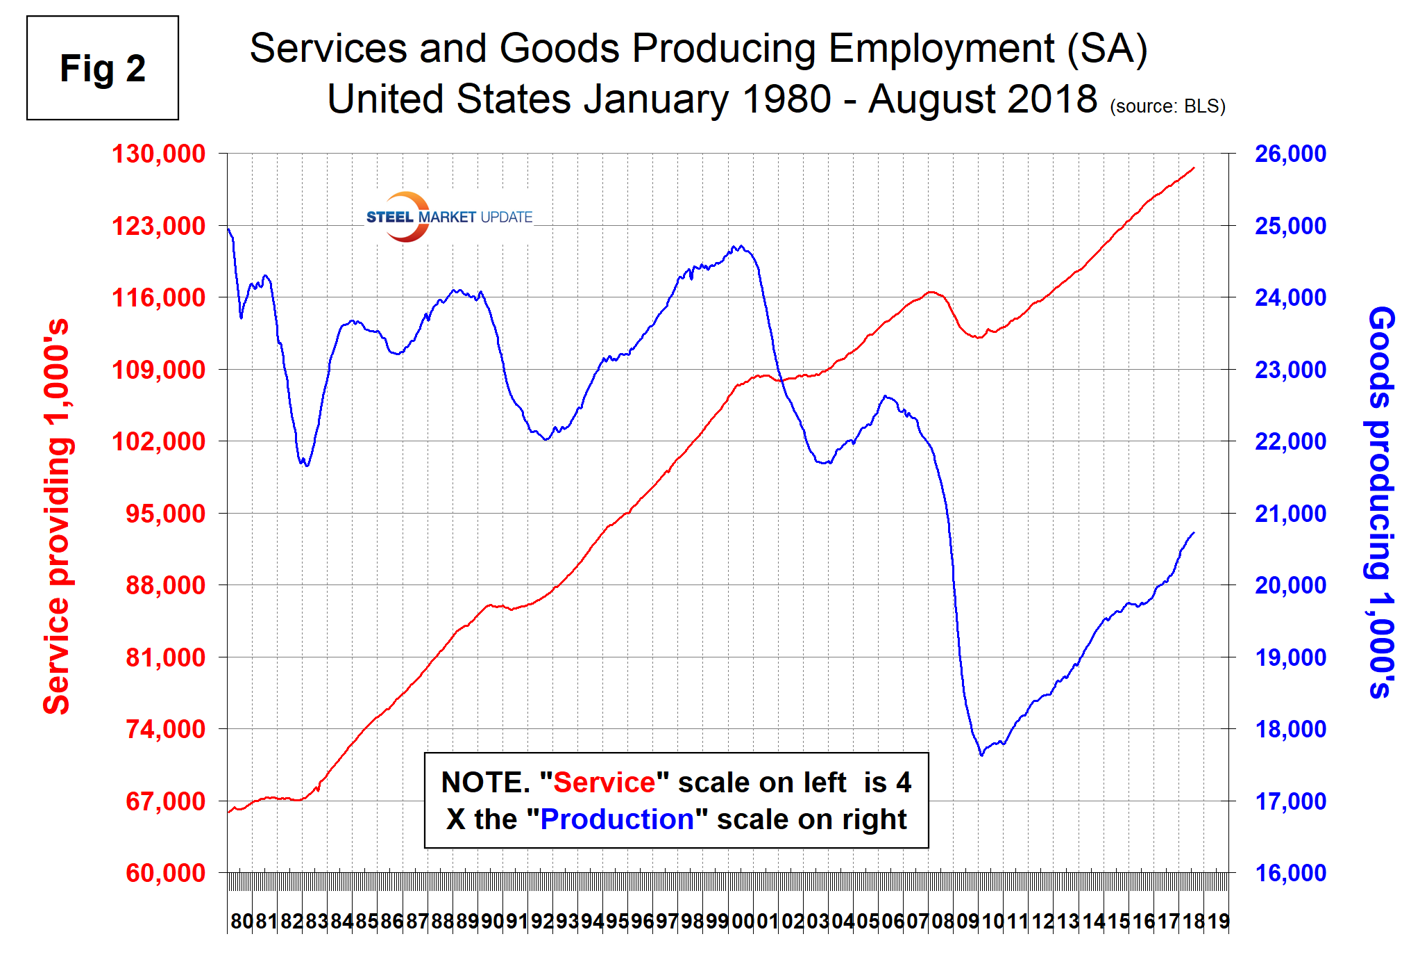
In August, service industries expanded by 175,000 as goods-producing industries, driven mainly by construction and manufacturing, expanded by 26,000 (Figure 2). Since February 2010, service industries have added 16,451,000 and goods-producing 3,095,000 positions. This has been a drag on wage growth since the recession as service industries on average pay less than goods-producing industries such as manufacturing.
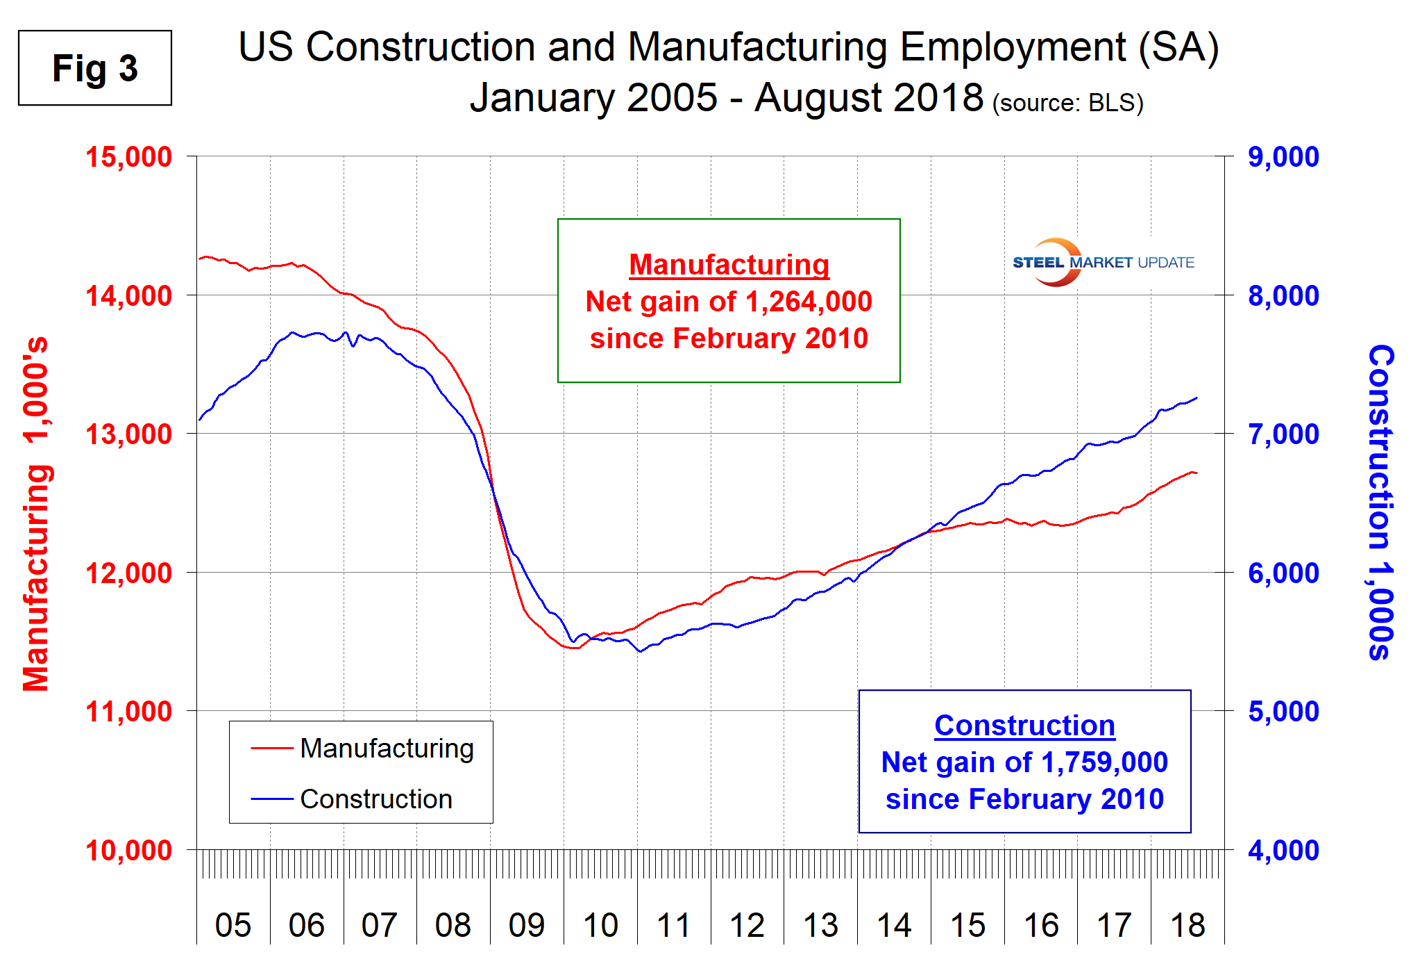
Construction was reported to have gained 23,000 jobs in August after an 18,000 gain in July. Year to date, construction has added 187,000 jobs. According to the Associated General Contractors of America, filling craft positions and some salaried positions is an even greater challenge for contractors than it was a year ago.
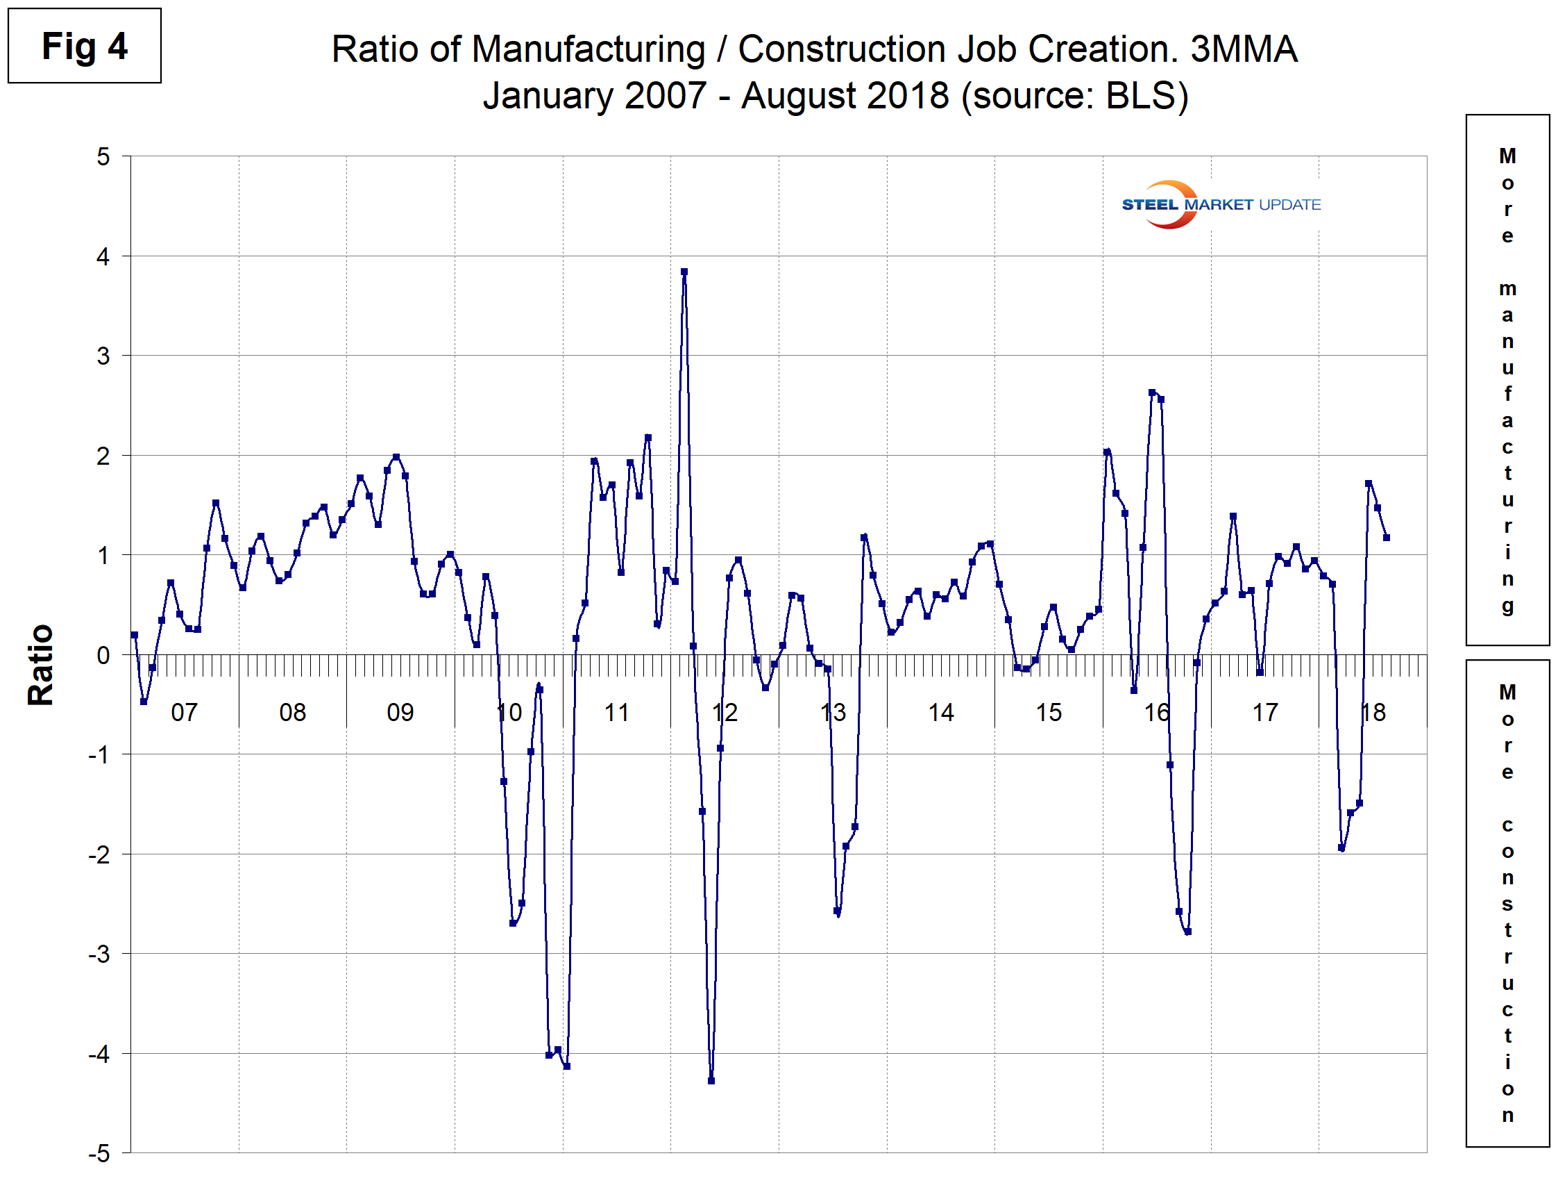
Manufacturing lost 3,000 jobs in August following an 18,000 gain in July. This was the first losing month since July last year. Year to date, manufacturing has added 159,000 jobs. Figure 3 shows the history of construction and manufacturing employment since January 2005. Construction has added 1,759,000 jobs and manufacturing 1,264,000 since the recessionary employment low point in February 2010 (Figure 3). In total for the last three months, manufacturing has added jobs faster than has construction as shown by the ratio in Figure 4.
Note, the subcomponents of both manufacturing and construction shown in Table 1 don’t add up to the total because we have only included those with the most relevance to the steel industry.
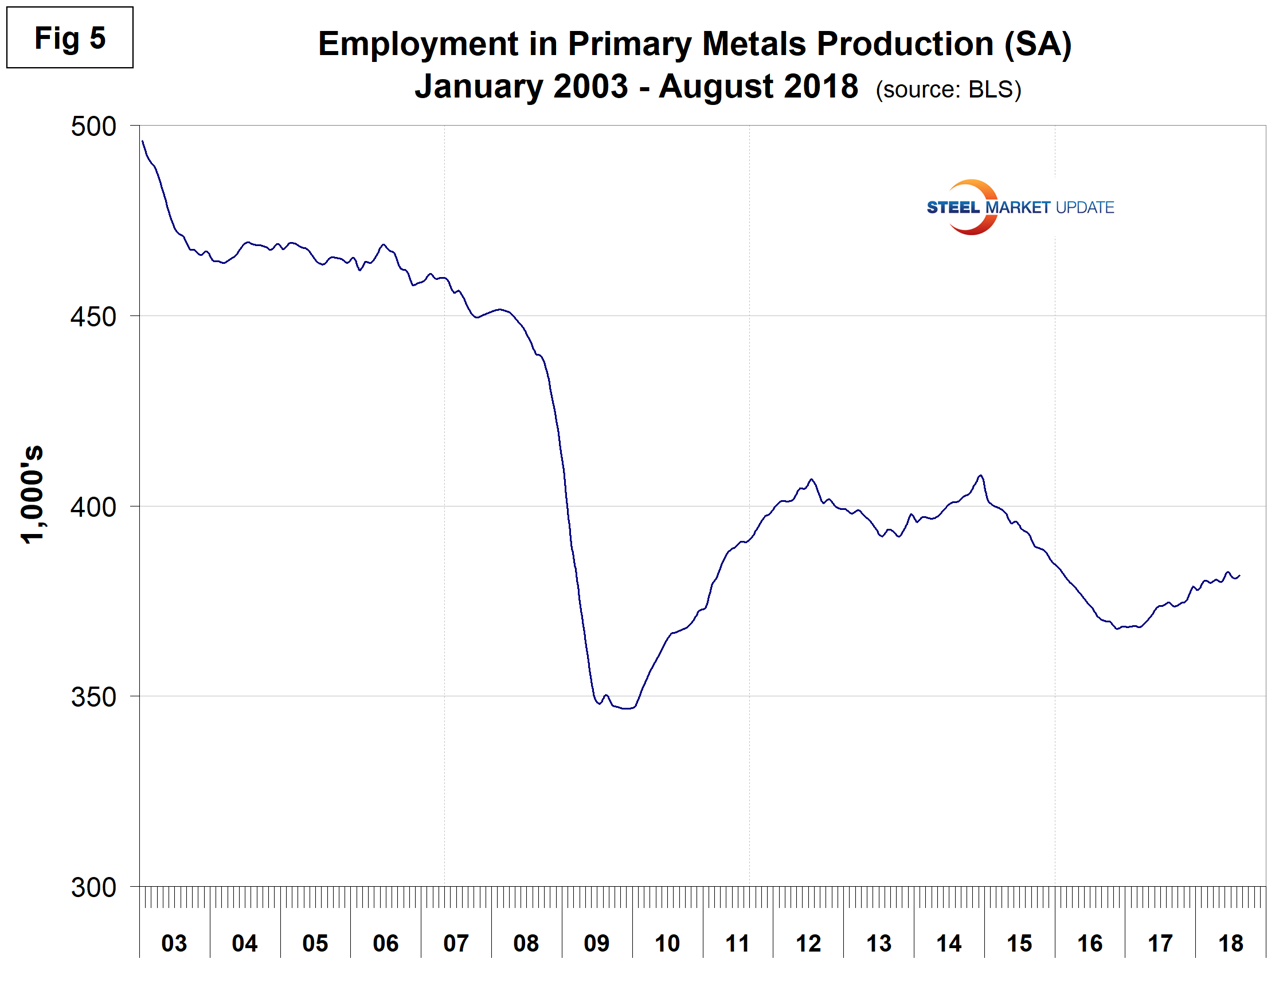
Table 1 shows that primary metals gained back the 700 jobs in August that were lost in July, and in the last 12 months on a percentage basis was up by slightly less than total manufacturing. Figure 5 shows the history of primary metals employment since January 2003.
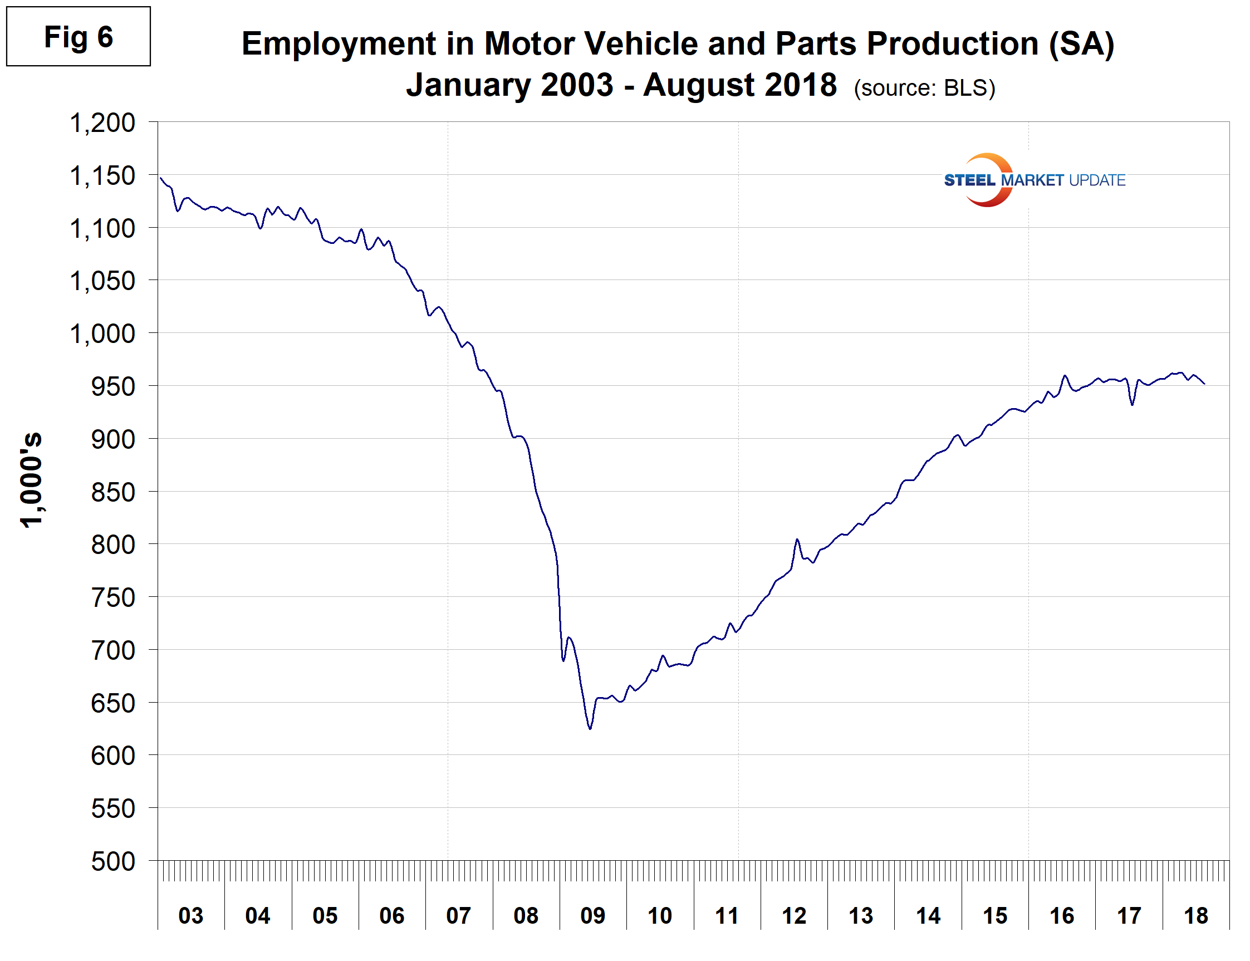
Motor vehicles and parts industries were reported to have lost 4,900 jobs in August. Figure 6 shows the history of motor vehicles and parts employment. The flattening in the last two years is a reflection of U.S. light vehicle sales.
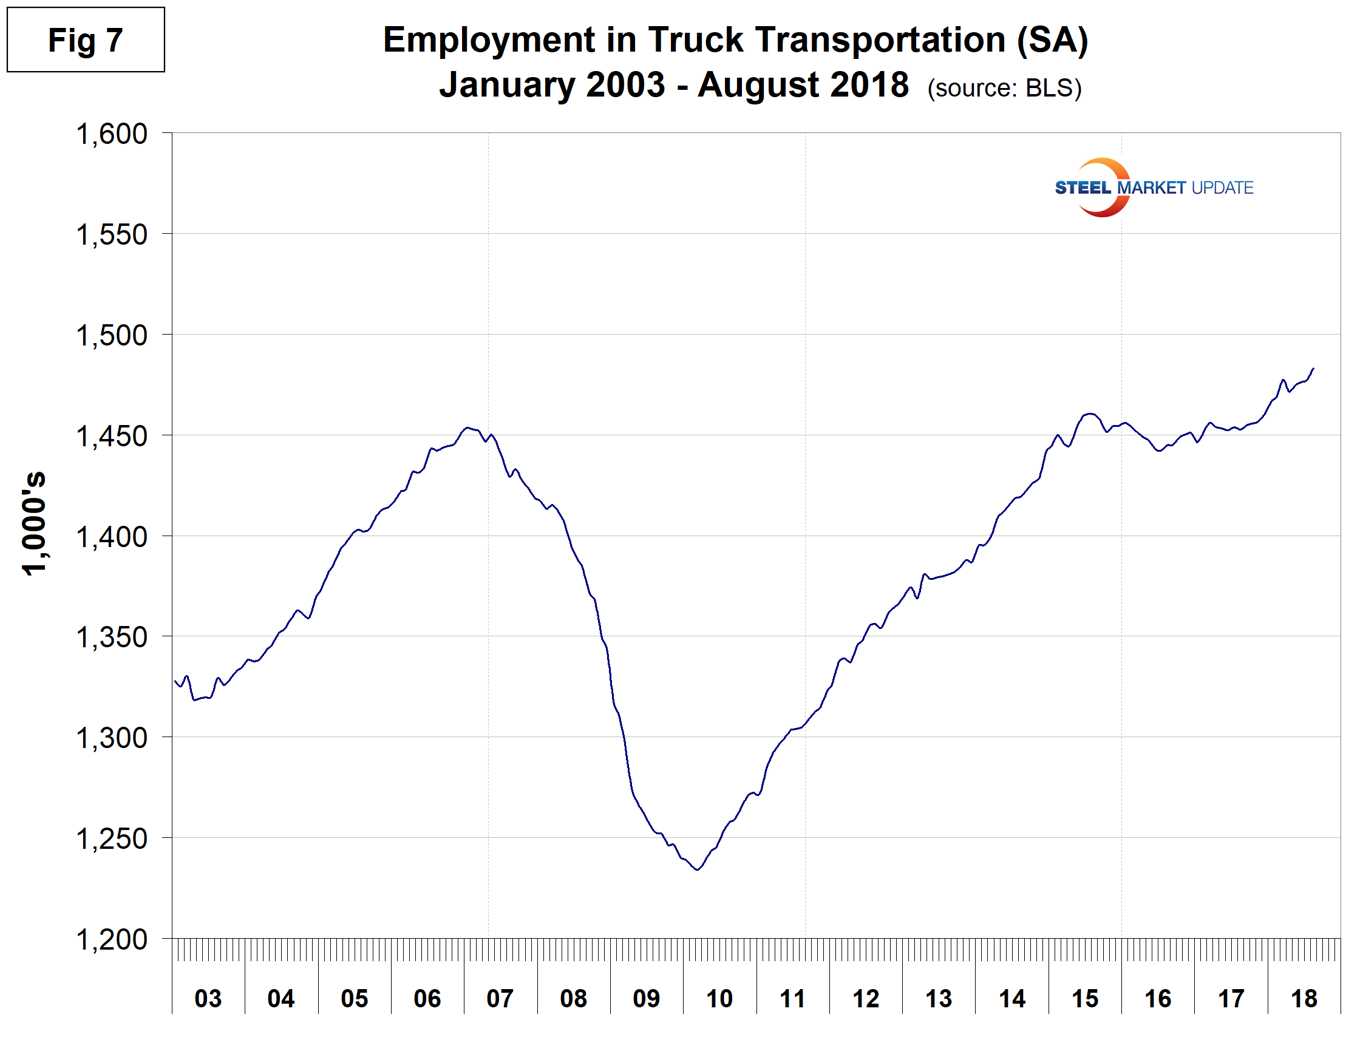
Trucking gained 5,700 jobs in August, for a total of 22,800 year to date (Figure 7).
SMU Comment: Manufacturing took a small step back in August, but in the longer term the results are good. Employment growth in manufacturing and construction are signposts for steel sales activity.
Explanation: On the first Friday of each month, the Bureau of Labor Statistics releases the employment data for the previous month. Data is available at www.bls.gov. The BLS employment database is a reality check for other economic data streams such as manufacturing and construction. It is easy to drill down into the BLS database to obtain employment data for many subsectors of the economy. The important point about all these data streams is the direction they are headed.


