

Market Data

November 7, 2018
BLS: Employment by Industry for October
Written by Peter Wright
Net job creation in October totaled 250,000 positions. Construction and manufacturing gains were both strong, according to Steel Market Update’s latest analysis of Bureau of Labor Statistics data.
Table 1 breaks total employment down into service and goods-producing industries and then into private and government employees. Most of the goods-producing employees work in manufacturing and construction, and the components of these two sectors of most relevance to steel people are broken out in Table 1.
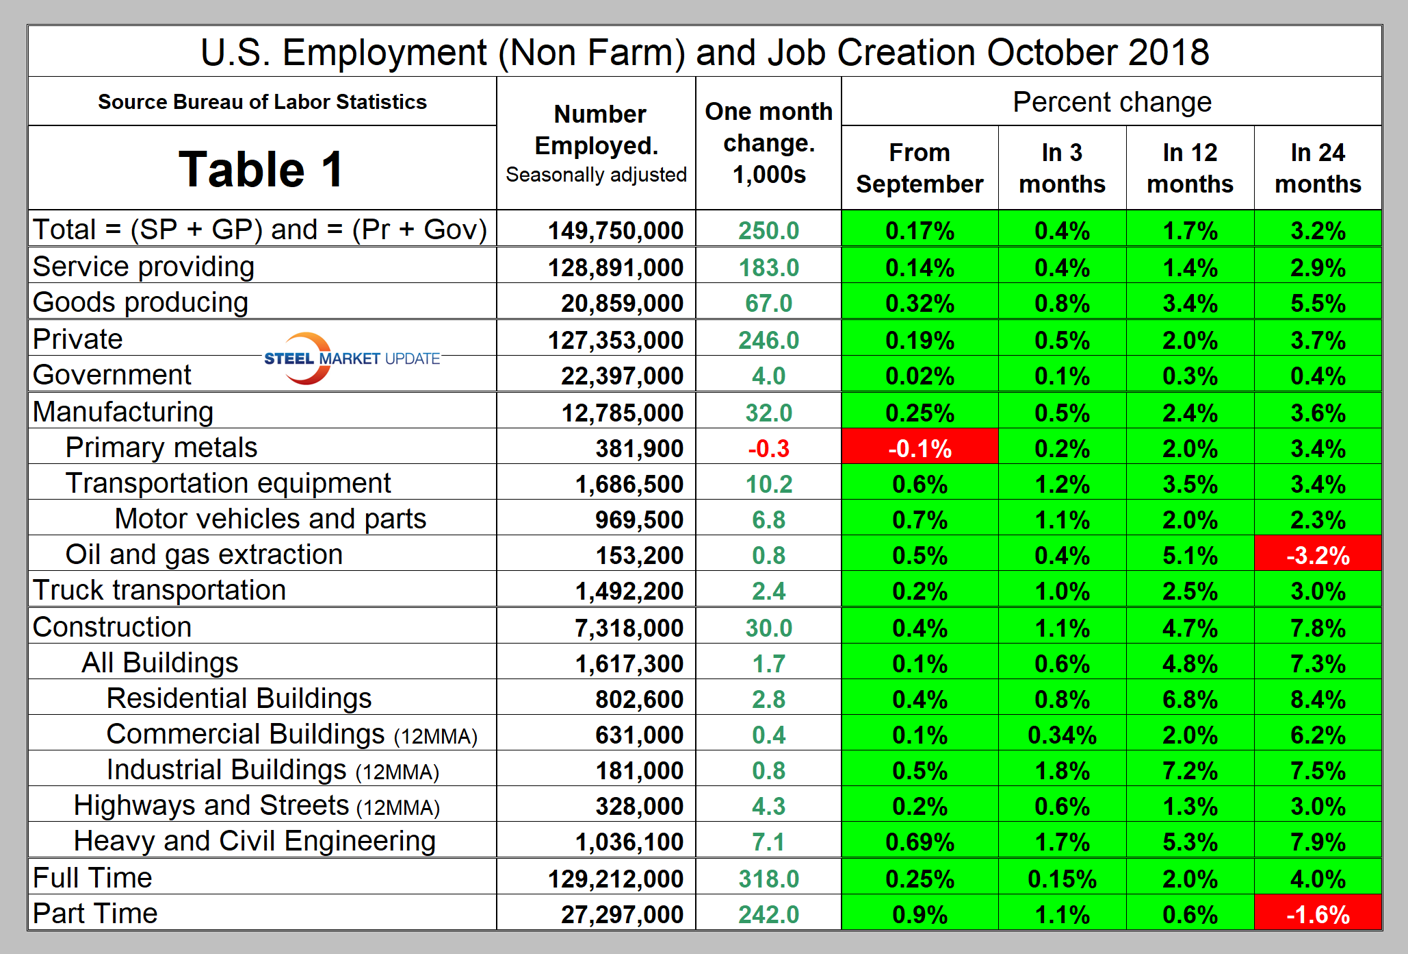
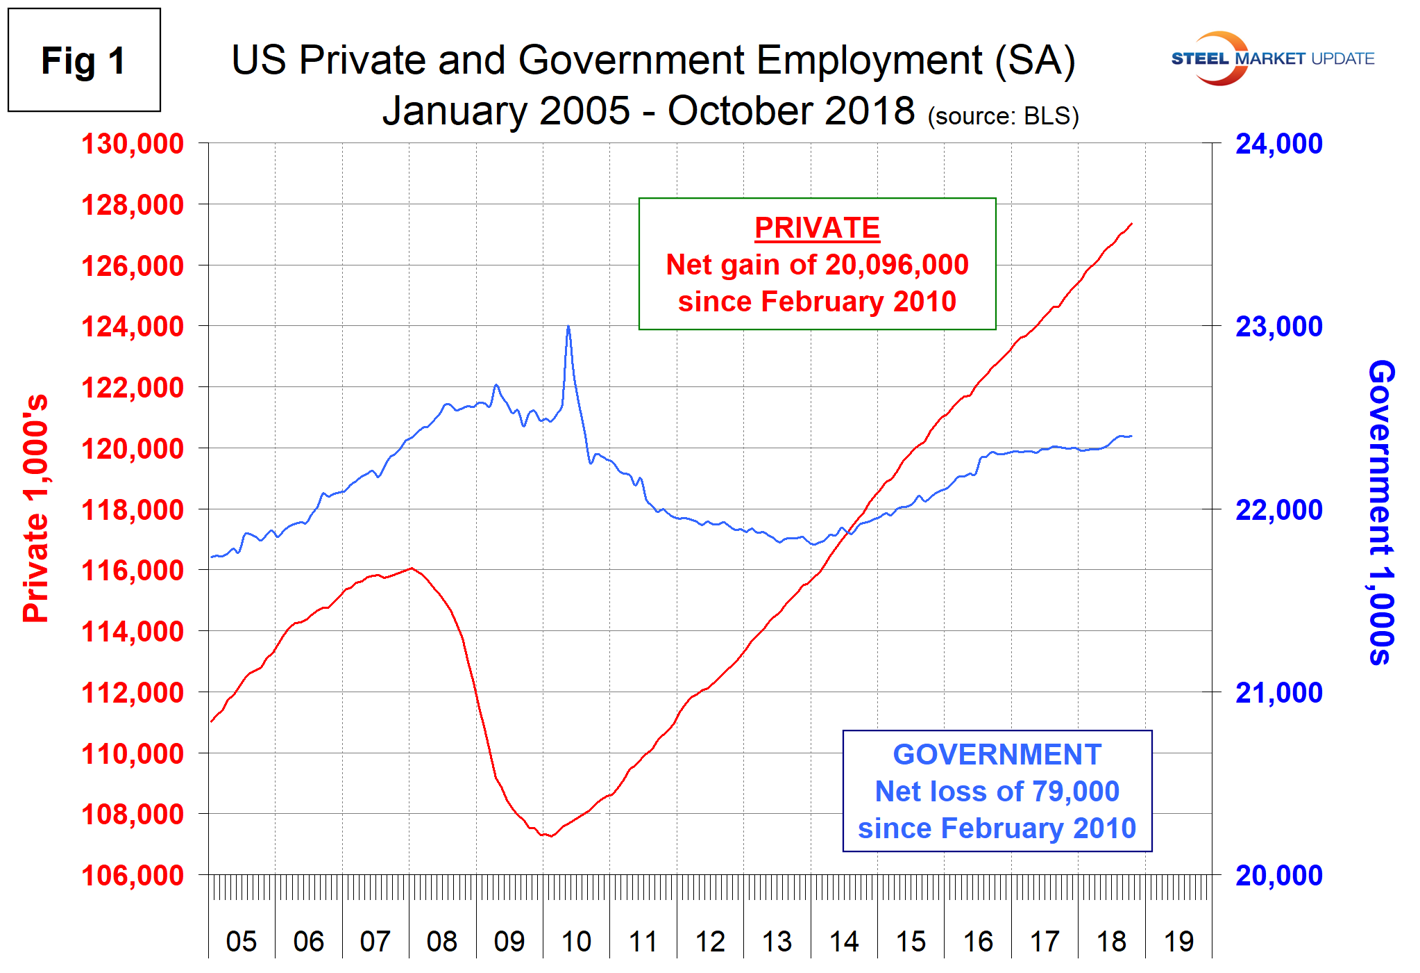
In October, 246,000 jobs were created in the private sector and government gained 4,000 jobs. The number employed by federal and state governments both increased by 1,000 and state governments picked up 2,000 jobs. Since February 2010, the employment low point, private employers have added 20,096,000 jobs as government has lost 79,000 (Figure 1).
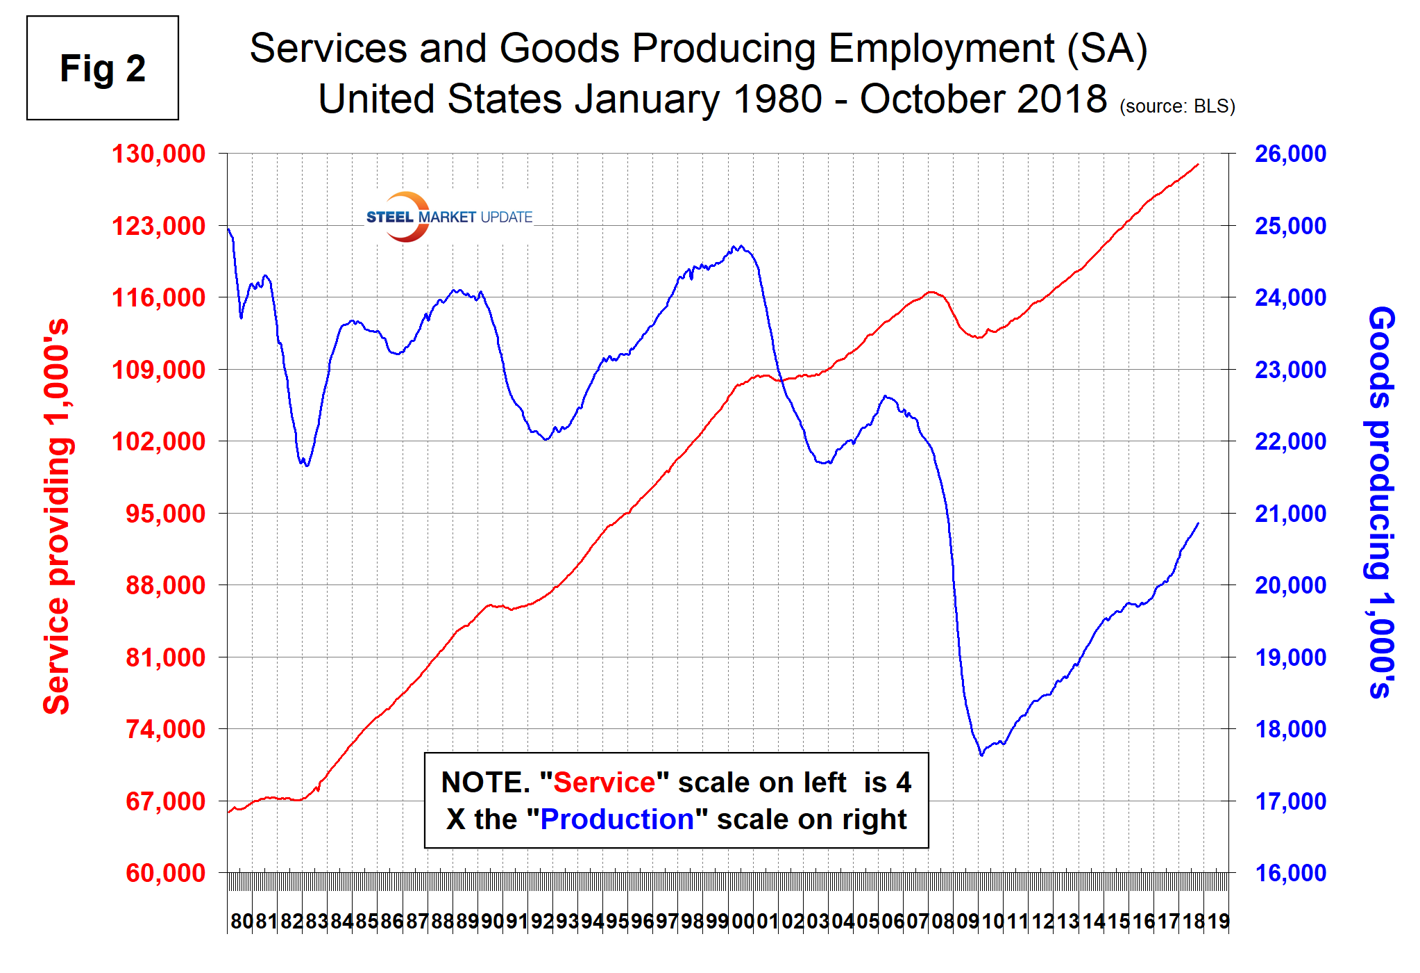
In October, service industries expanded by 183,000 as goods-producing industries, driven mainly by construction and manufacturing, expanded by 67,000 (Figure 2). Since February 2010, service industries have added 16,785,000 and goods-producing 3,232,000 positions. This has been a drag on wage growth since the recession as service industries on average pay less than goods-producing industries such as manufacturing.
Construction was reported to have gained 30,000 jobs in October making a total of 246,000 year to date. According to the Associated General Contractors of America, job gains remain strong and well balanced between residential and nonresidential construction. Contractors are raising pay faster than at any time since the recession to attract workers from other industries, yet many firms report difficulty in filling positions.
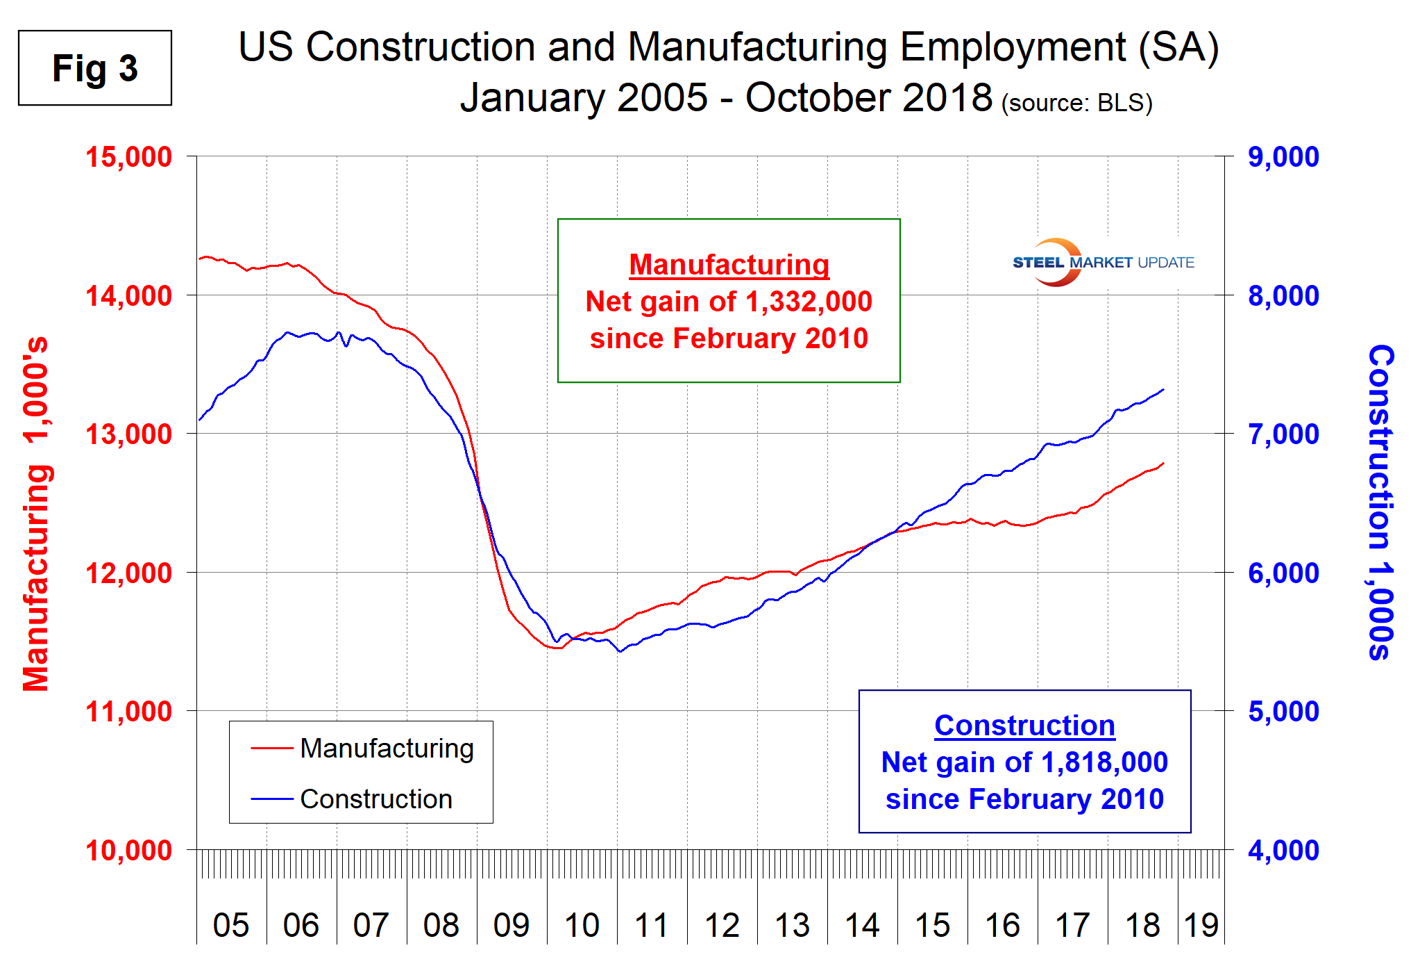
Manufacturing gained 32,000 jobs in October making a total of 227,000 year to date. Figure 3 shows the history of construction and manufacturing employment since January 2005. Construction has added 1,818,000 jobs and manufacturing 1,332,000 since the recessionary employment low point in February 2010. On a percentage basis, construction has added jobs at twice the rate of manufacturing in the last 12 and 24 months.
Note, the subcomponents of both manufacturing and construction shown in Table 1 don’t add up to the total because we have only included those with the most relevance to the steel industry.
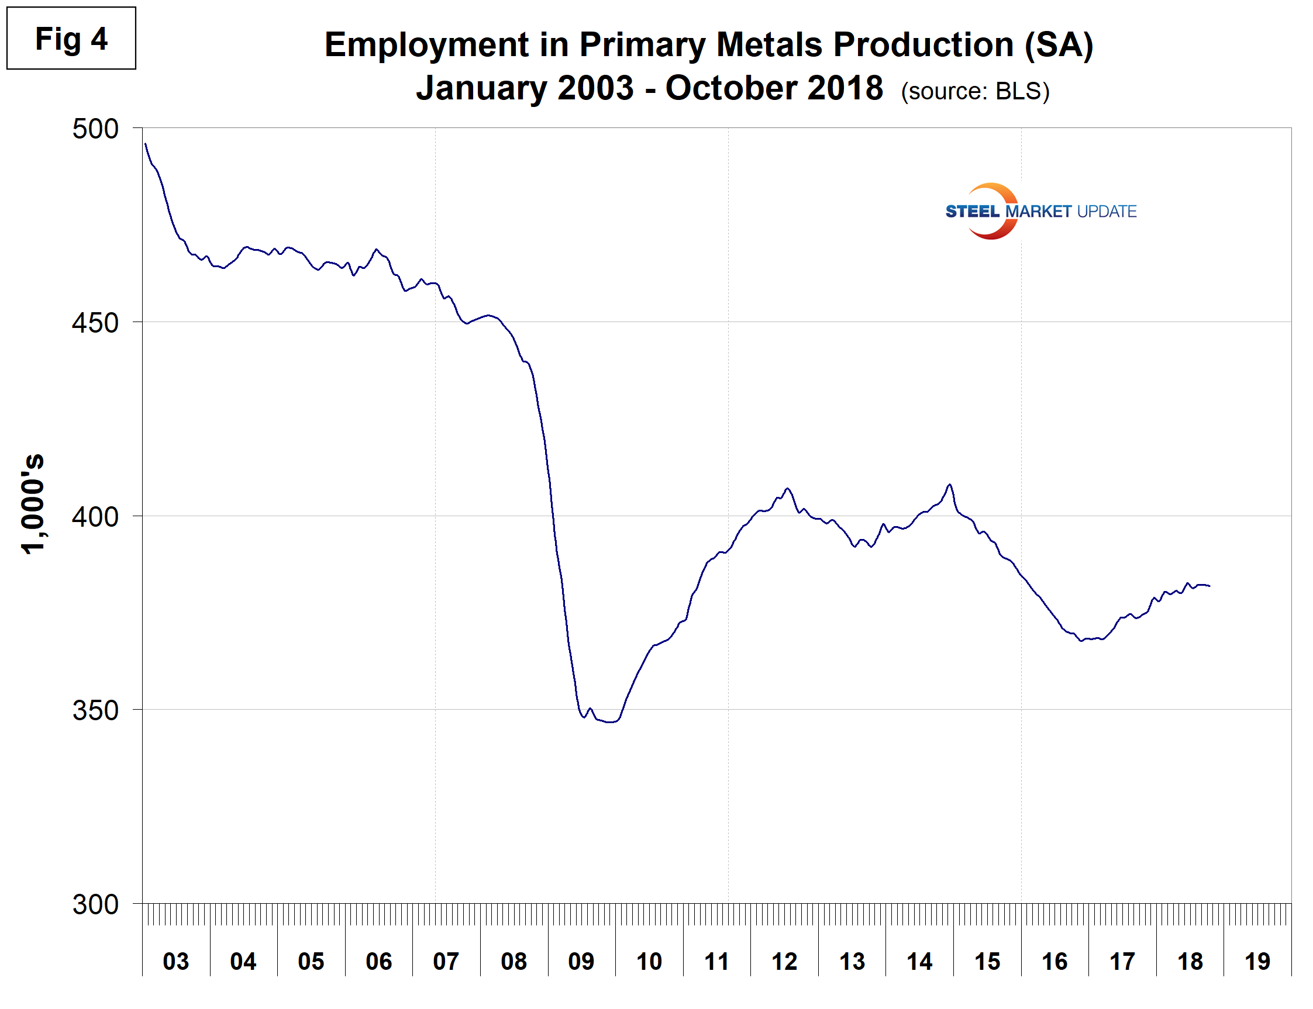
Table 1 shows that primary metals lost 300 jobs in October, and in the last 12 and 24 months gains on a percentage basis were about the same as for total manufacturing. Figure 4 shows the history of primary metals employment since January 2003.
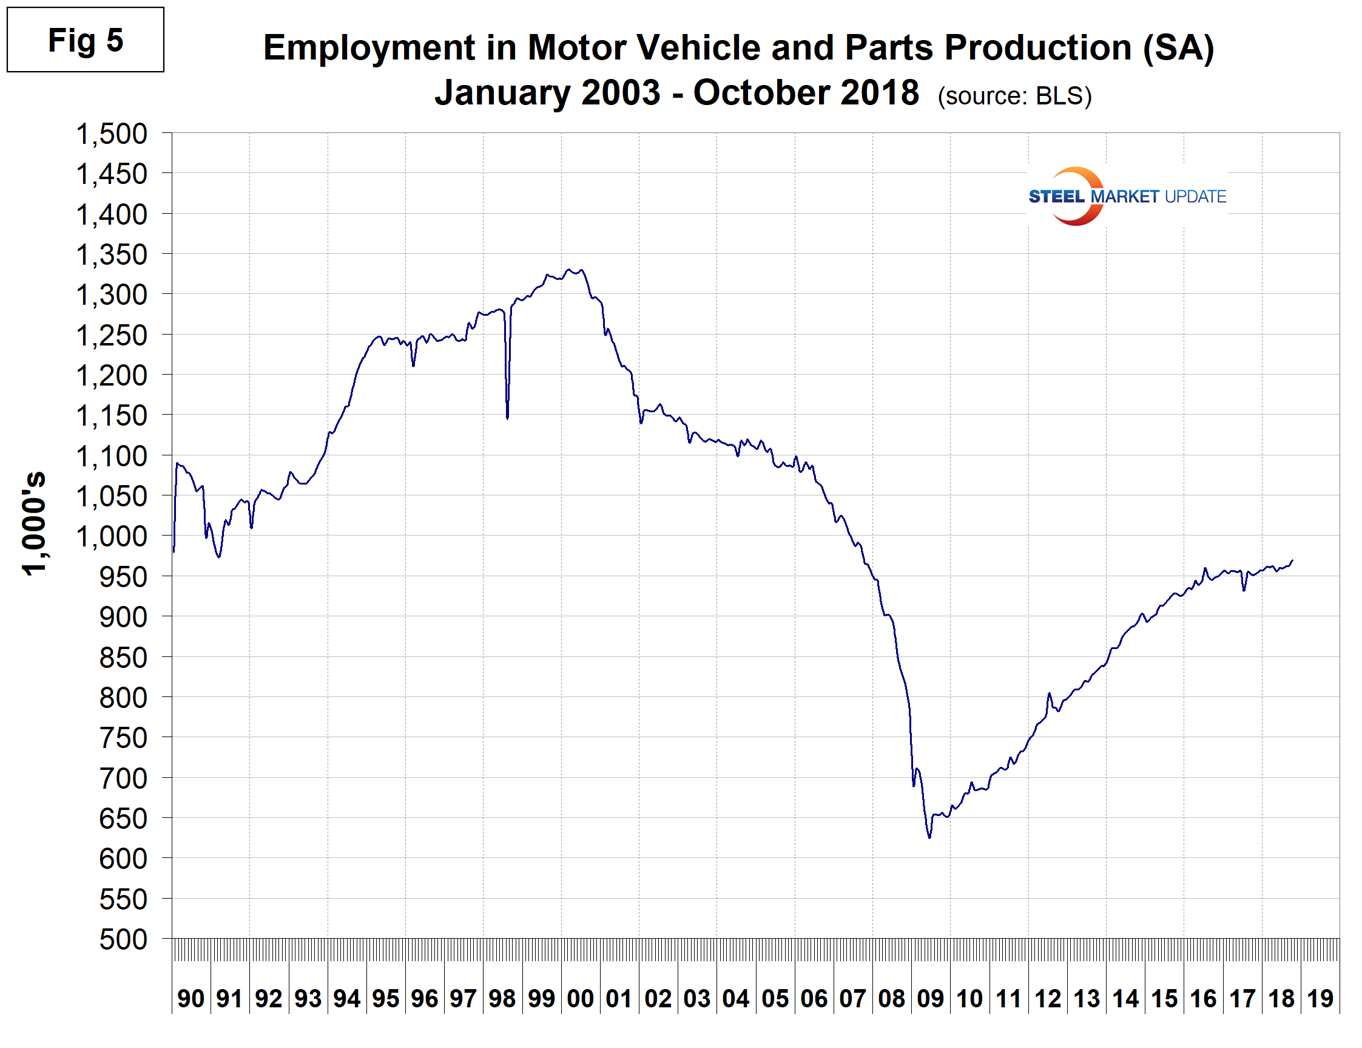
Motor vehicles and parts industries were reported to have gained 6,800 jobs in October. Figure 5 shows the history of motor vehicles and parts employment. The flattening in the last two years is a reflection of U.S. light vehicle sales.
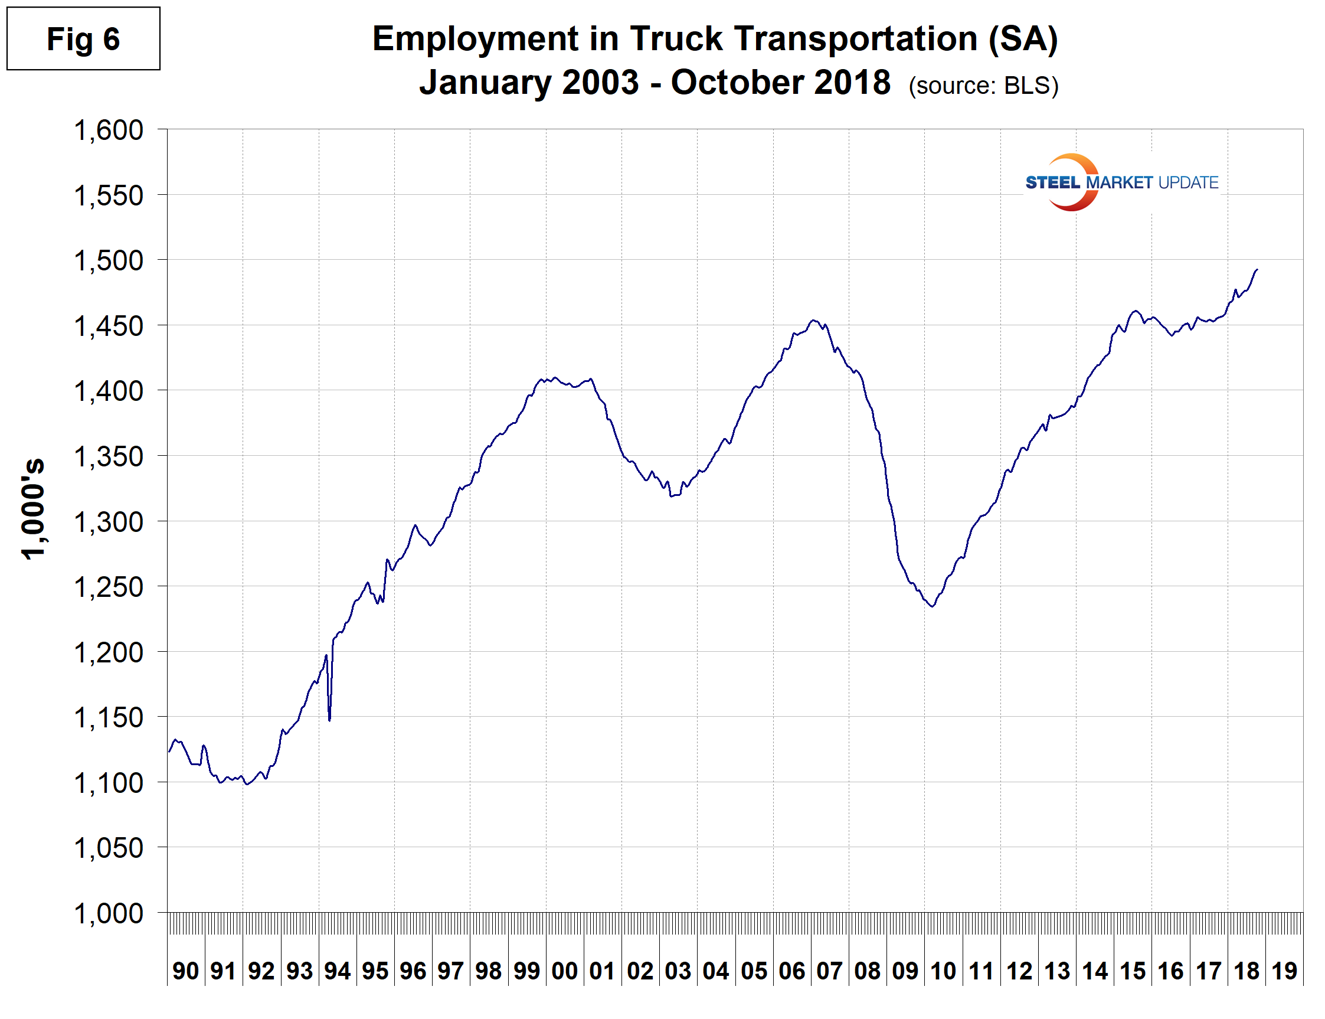
Trucking gained 2,400 jobs in October for a total of 31,900 year to date (Figure 6).
SMU Comment: Manufacturing and construction have both had solid employment gains this year, which bodes well for steel consumption into next year.
Explanation: On the first Friday of each month, the Bureau of Labor Statistics releases the employment data for the previous month. Data is available at www.bls.gov. The BLS employment database is a reality check for other economic data streams such as manufacturing and construction. It is easy to drill down into the BLS database to obtain employment data for many subsectors of the economy. The important point about all these data streams is the direction in which they are headed.


