Market Data

November 7, 2018
SMU Labor Analysis: Productivity Improves in Q3
Written by Peter Wright
Labor productivity grew by 0.5 percent in the third quarter of 2018. The average of the last three quarters has been 0.3 percent. Unit labor costs increased 1.2 percent year over year, according to Steel Market Update’s latest analysis of Bureau of Labor Statistics (BLS) data.
Unit labor costs and productivity changes are reported quarterly by the BLS and results for Q3 2018 were released last week. All quarterly percent changes in this release are seasonally adjusted annual rates. This basic information is useful to better understand the steel market. One way of looking at GDP is that it is the growth of the working age population multiplied by their productivity. Steel consumption is correlated with the growth of GDP.
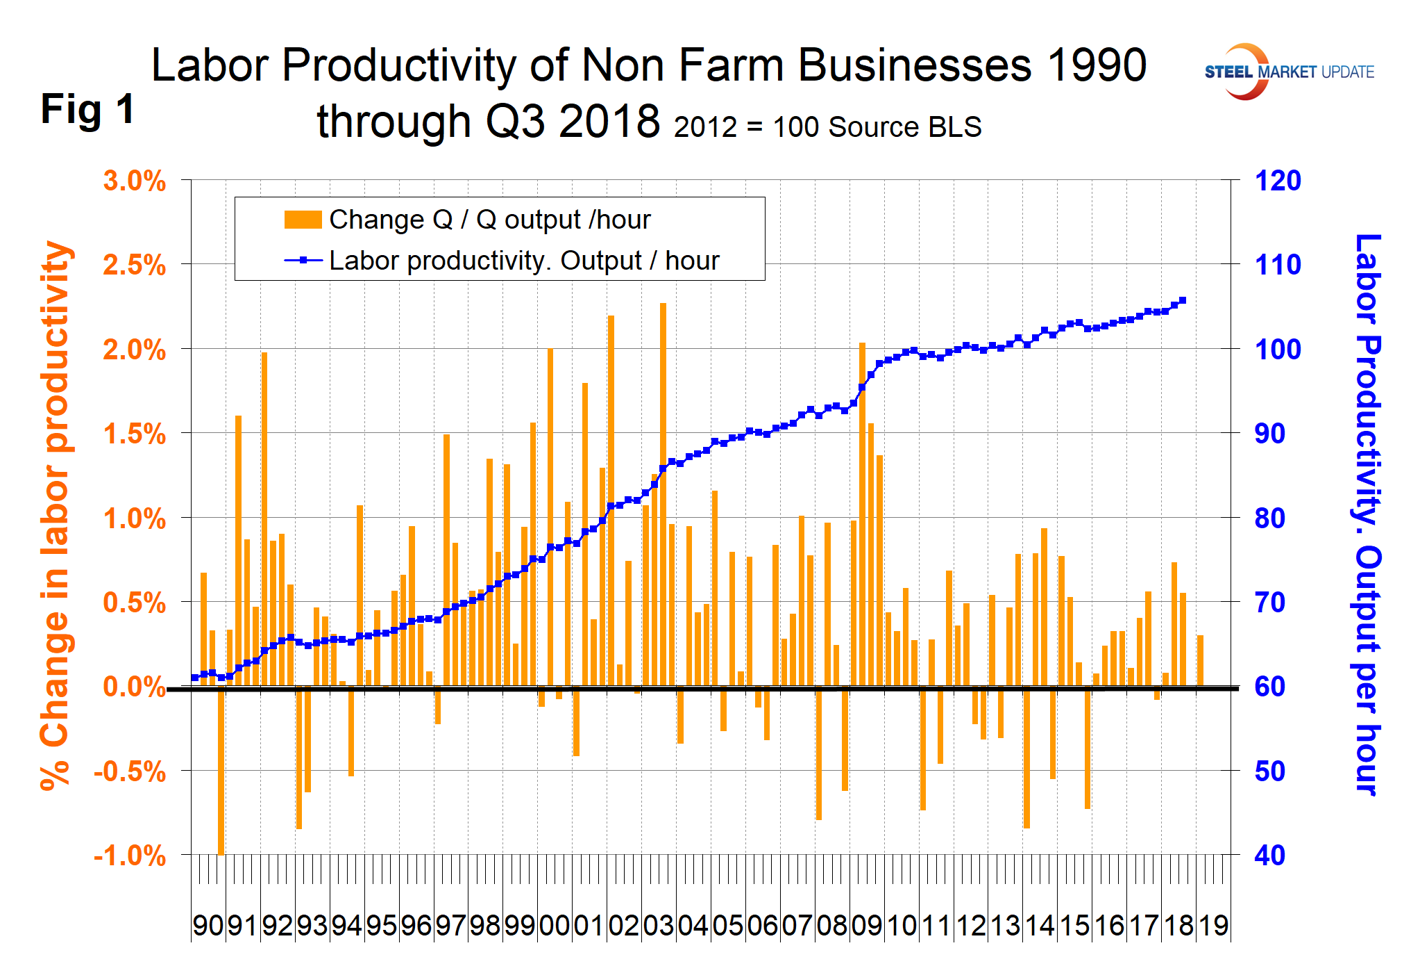
Figure 1 shows labor productivity in output per hour as an index based on 2012 = 100 and the quarterly change for nonfarm businesses in total. Labor productivity, or output per hour, is calculated by dividing an index of real output by an index of hours worked by all persons, including employees, proprietors and unpaid family workers. Through Q1 this year, productivity had been trending up but has reversed course in Q2 and Q3. On a longer term basis since Q1 2017, the average quarterly improvement has been 0.30 percent. In Q3 2018, the improvement was 0.55 percent.
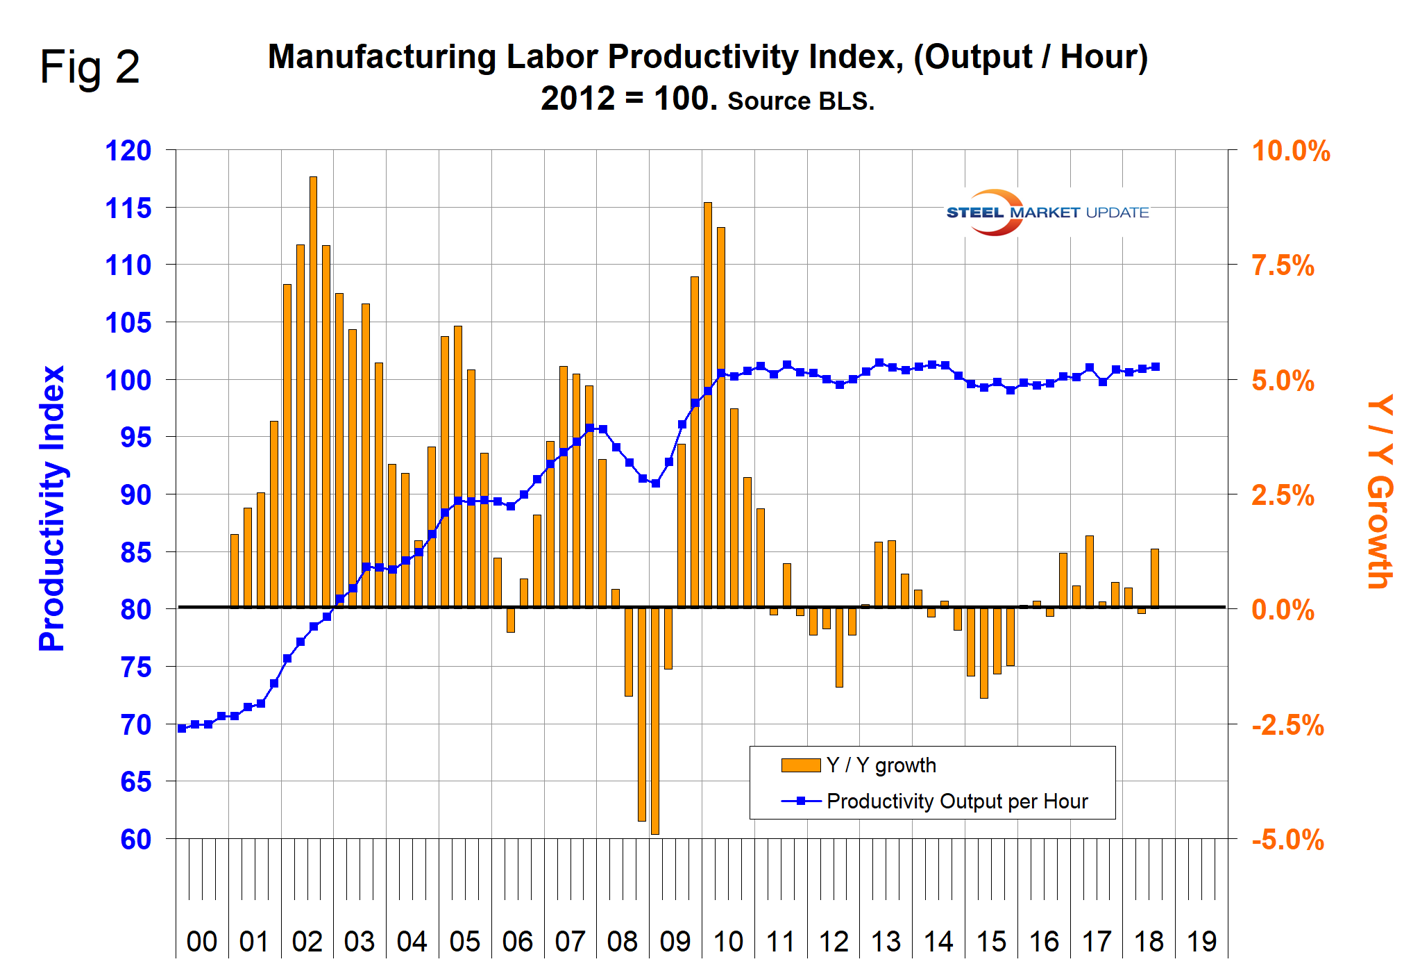
The manufacturing component of the big picture had a poor productivity performance in the four quarters Q3 2017 through Q2 2018 with an average gain of only 0.27 percent. This improved to 1.3 percent in Q3 2018 mainly because Q3 2017 was an outlier to the low side. Figure 2 shows the productivity index for manufacturing industries with the year-over-year gain. The productivity growth of manufacturing has been stalled for 8½ years following the post-recessionary recovery.
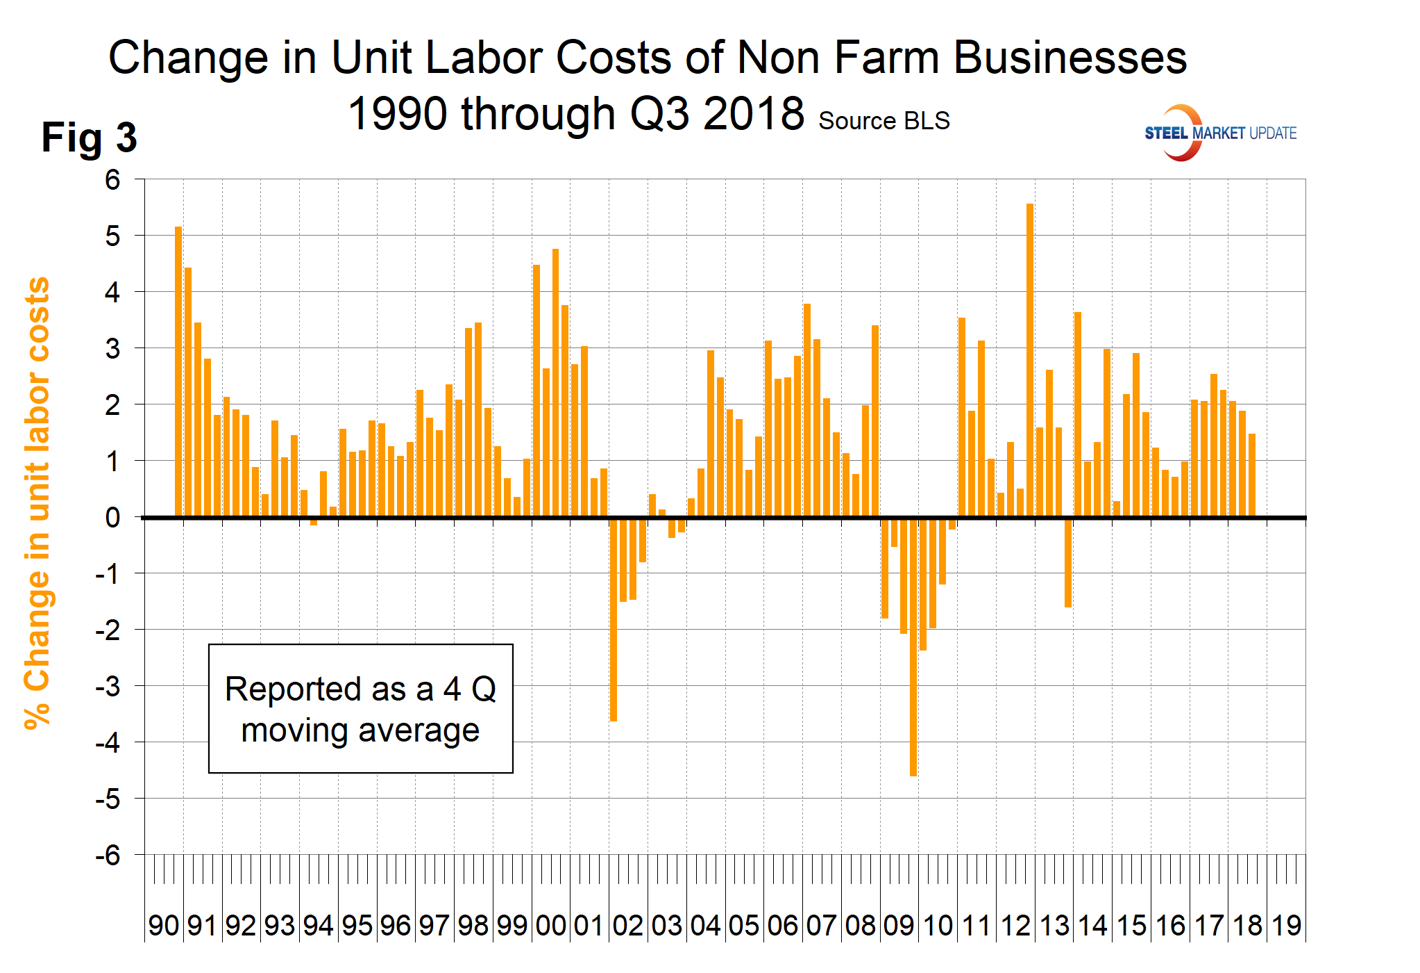
In the third quarter, unit labor costs increased by 1.2 percent with a 4Q moving average of 1.48 percent. BLS calculates unit labor costs as the ratio of hourly compensation to labor productivity. Increases in hourly compensation tend to increase unit labor costs, and increases in output per hour tend to reduce them. The 4Q MA has declined every quarter since Q3 2017. Figure 3 shows the change in unit labor costs since Q1 2000.