

Market Data

January 17, 2019
PPI Data Shows Steel Losing Ground to Other Materials
Written by Peter Wright
Steel became less competitive in 2018 against aluminum, plastic and wood, according to Steel Market Update’s analysis of Bureau of Labor Statistics Producer Price Index data. The cost of carbon cold rolled sheet was up more than twice as much as aluminum sheet, and steel pipe was up by nine times as much as plastic pipe. The price increase of metal prefabricated buildings was almost three times as much as for the competing wood product.
![]()
The Bureau of Labor Statistics (BLS) is still operating during the government shutdown, therefore SMU is still producing this report and our employment analyses. The BLS has this statement on its website: “The Department of Labor, including the Bureau of Labor Statistics, is funded through Sept. 30, 2019. BLS is operating as usual and expects to follow its announced release schedule.” Most of the reports SMU produces for Premium subscribers are wholly or partly dependent on data from the Department of Commerce. On its website, the DoC makes the following statement: “Due to the lapse in Congressional Appropriations for Fiscal Year 2019, the U.S. Department of Commerce is closed. Commerce Department websites will not be updated until further notice.”
This Producer Price Index (PPI) report is intended to provide subscribers with a view of the competitive position of sheet steel, aluminum, plastic and wood. This analysis includes some downstream products and a comparison of truck and rail transportation.
On Tuesday, the BLS released its series of PPIs for more than 10,000 goods and materials through December. For an explanation of this program, see the end of this piece. The PPI data are helpful in monitoring price direction. As far as we can tell from comparison with known transaction prices, these indexes are a reasonable representation of the real world, though there may be a lag between the BLS reports and spot prices for steel products. We have also concluded that the actual index values of the PPIs of different products cannot be compared with one another because they are developed by different committees within the BLS. We believe this data is useful in comparing the direction of prices in the short and medium term, but tell us nothing about the absolute value.
The headline summary from the BLS was as follows: “The Producer Price Index for final demand fell 0.2 percent in December, seasonally adjusted. Final demand prices advanced 0.1 percent in November and 0.6 percent in October. On an unadjusted basis, the final demand index moved up 2.5 percent in 2018, the same as in 2017.” Energy products accounted for most of the decline in final demand PPI in December.
Figure 1 shows the composite PPI of all commodities since January 2008. The index rose steadily for 2½ years through mid-2018 before declining in H2 2018. Overall, the composite was up by 2.9 percent in the 12 months of 2018.
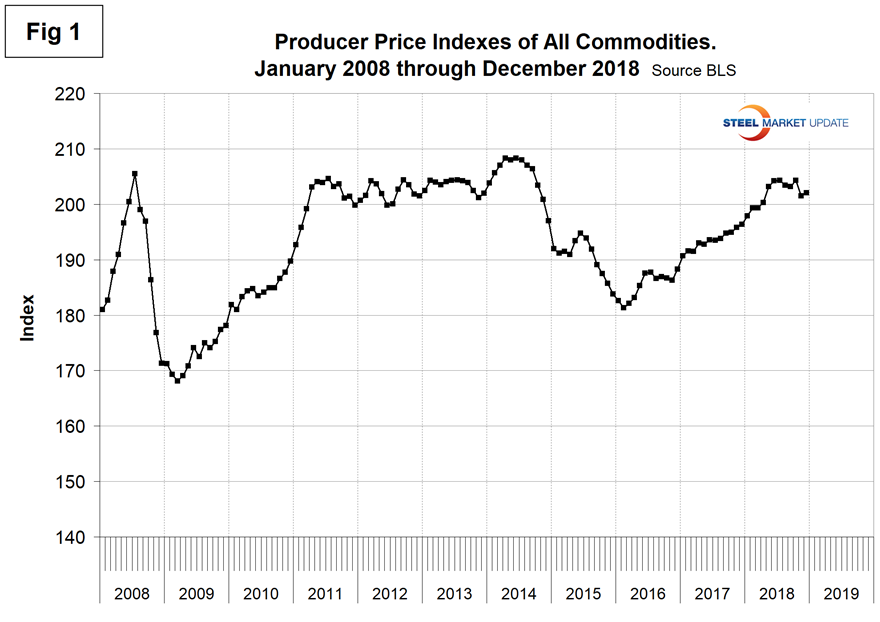
Table 1 is a summary of each segment that we examine on a year over one-, two- and three-year basis. The gain/loss pattern is shown by the color codes; we interpret rising prices as positive. We began this bimonthly analysis in January 2016 and the months June through December 2018 were the first for the whole table to be green. The table includes direct comparisons where possible between steel and competing products, also some other plastic products for which there is no direct steel comparison, and a measure of price changes for transportation, warehousing and storage. Some specific comparisons of steel and steel products with their competition are as follows. Please note the Y axis scales are not the same.
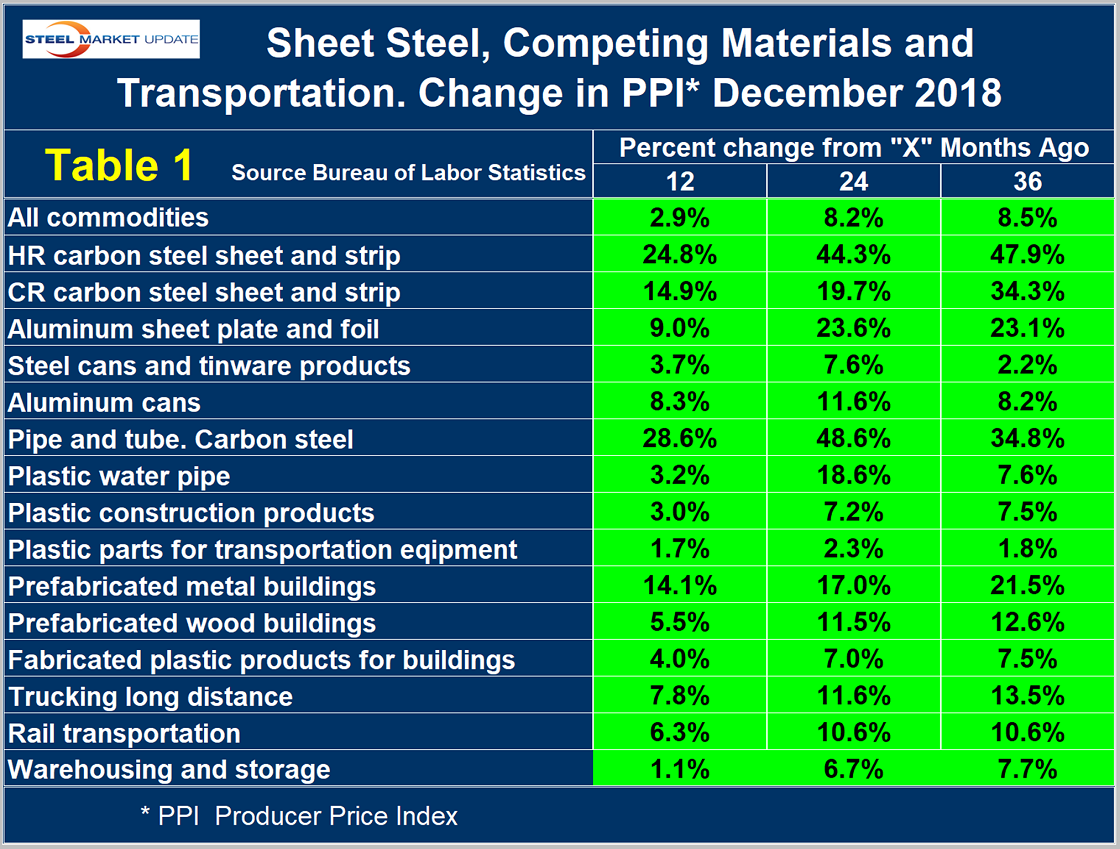
Figure 2 shows the year-over-year comparison of the price change of cold rolled steel sheet and flat rolled aluminum. In the 12 months August 2017 through July 2018, aluminum prices escalated faster than steel. In the second half of 2018 the situation reversed.
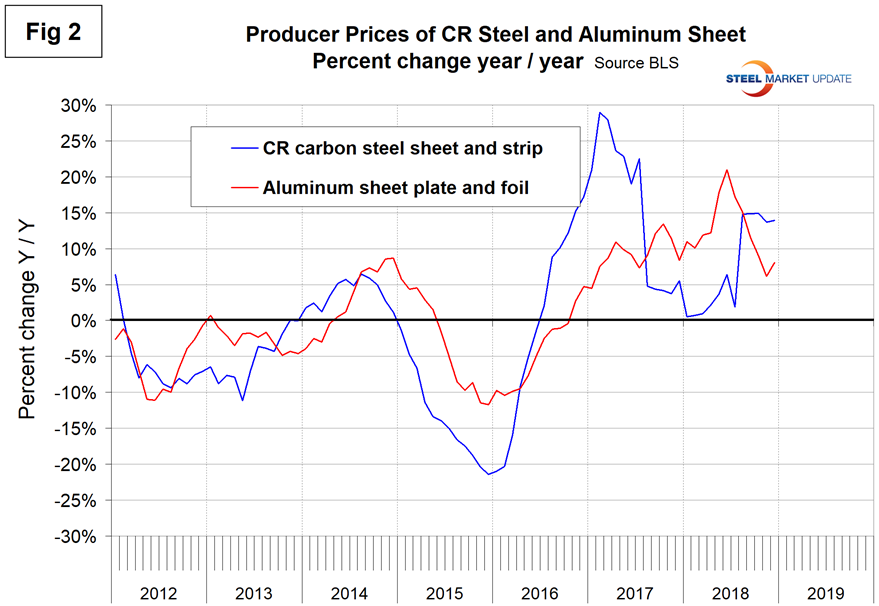
Figure 3 shows the same comparison for steel tinware products and aluminum cans. Aluminum is a much more energy intensive product than steel and this is reflected in the PPI of both aluminum sheet and aluminum cans. For this reason, the competitive position of aluminum has improved recently and this is likely to continue. There is a lag between price changes of sheet and the price change of cans.
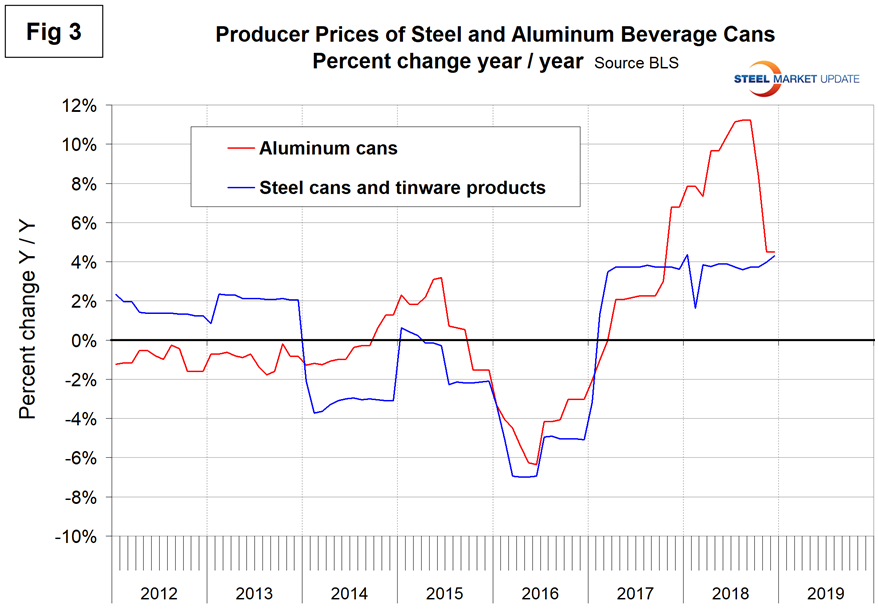
Figure 4 compares prefabricated metal with prefabricated wood buildings. The price of steel has escalated faster than wood buildings for most of the last 2½ years.
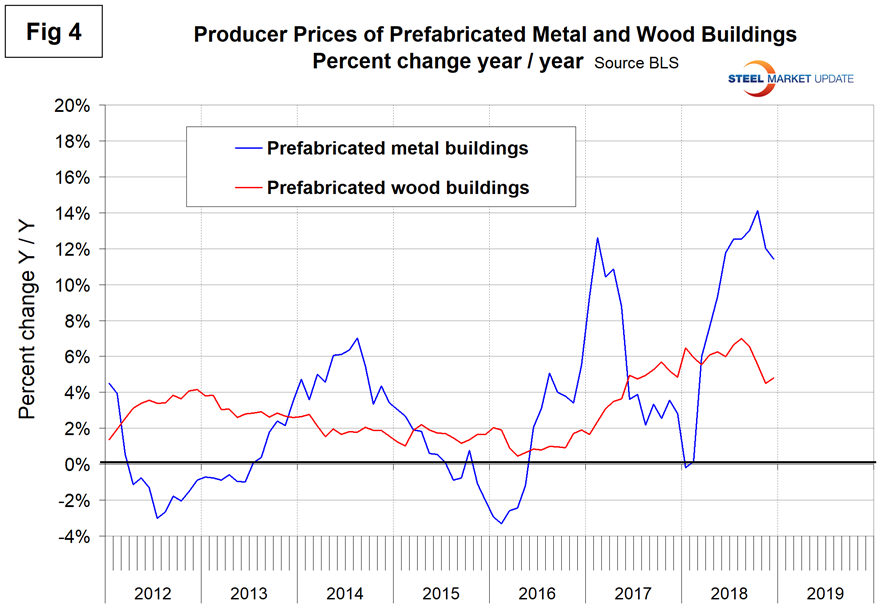
Figure 5 compares the price changes of steel and plastic pipe, which moved in opposite directions to the detriment of steel in 2018. Plastic is also a highly energy-intensive product; therefore, this situation is not expected to reverse in the near future.
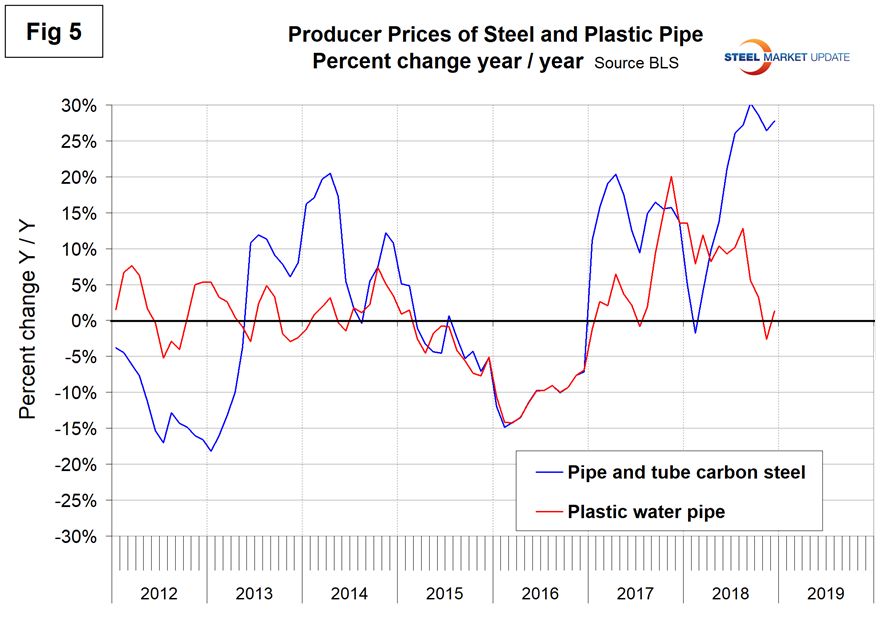
Figure 6 compares the changes in the price of truck and rail transportation. The escalation of trucking prices has exceeded those of rail almost every month since January 2014. The differential widened through July 2018, narrowed, then widened again in the fourth quarter. As the price of diesel fuel follows that of crude oil (which so far hasn’t happened), the escalation in trucking costs should decline. In December, year-over-year trucking costs were up by 8.8 percent as rail was up by 5.8 percent.
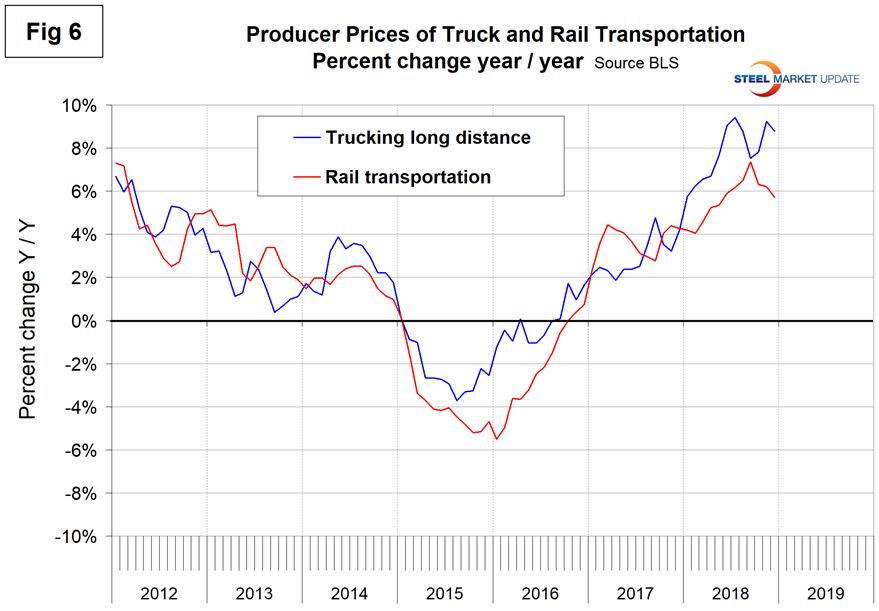
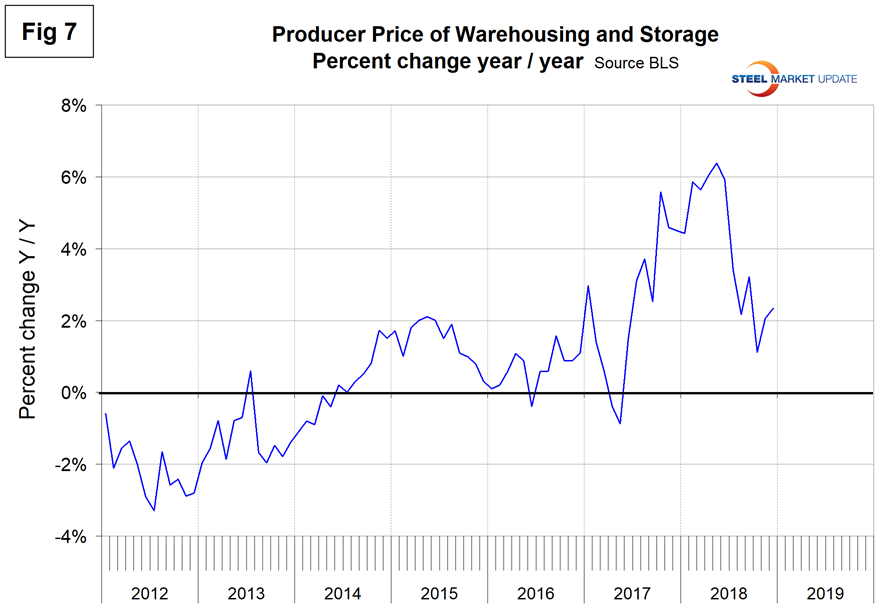
Figure 7 shows that the cost of warehousing and storage has declined significantly this year.
The official description of this program from the BLS reads as follows: “The Producer Price Index (PPI) is a family of indexes that measure the average change over time in the prices received by domestic producers of goods and services. PPIs measure price change from the perspective of the seller. This contrasts with other measures, such as the Consumer Price Index (CPI). CPIs measure price change from the purchaser’s perspective. Sellers’ and purchasers’ prices can differ due to government subsidies, sales and excise taxes, and distribution costs. More than 10,000 PPIs for individual products and groups of products are released each month. PPIs are available for the products of virtually every industry in the mining and manufacturing sectors of the U.S. economy. New PPIs are gradually being introduced for the products of industries in the construction, trade, finance, and services sectors of the economy. More than 100,000 price quotations per month are organized into three sets of PPIs: (1) Stage-of-processing indexes, (2) commodity indexes, and (3) indexes for the net output of industries and their products. The stage-of processing structure organizes products by class of buyer and degree of fabrication. The commodity structure organizes products by similarity of end use or material composition. The entire output of various industries is sampled to derive price indexes for the net output of industries and their products.


