

Market Data
February 1, 2019
SMU Analysis: Signs of Weakening Trends in Key Market Indicators
Written by Peter Wright
Key Market Indicators in January, indicators of the present situation, remained strong, but trends deteriorated to the weakest level in two years.
This report summarizes 36 data streams that we believe critically describe the state of and provide forward guidance for the steel market. Due to the government shutdown, 13 of the 36 indicators were not updated in January. These included all the trade, market size and construction results and the first estimate of fourth-quarter GDP, which should have been released this week. The resultant mix of December and January data shows that 20 of the 36 indicators are historically positive with only five negative. The balance is within the band of historically normal. Trends took a step back as negative results increased from 11 in December to 16 in January.
See the end of this piece for an explanation of the Key Indicators concept. This will explain the difference between our view of the present situation, which is subjective, and our analysis of trends, which is based on the latest facts available.
Please refer to Table 1 below for our view of the present situation and the quantitative measure of trends. Readers should regard the color codes in the present situation column as a visual summary of the current market condition. The “Trend” columns of Table 1 are also color coded to give a quick visual appreciation of the direction the market is headed. All data included in this table was released in December and January. The month or specific date to which the data refers is shown in the second column from the far right. All results are the latest available as of Jan. 31, 2019.
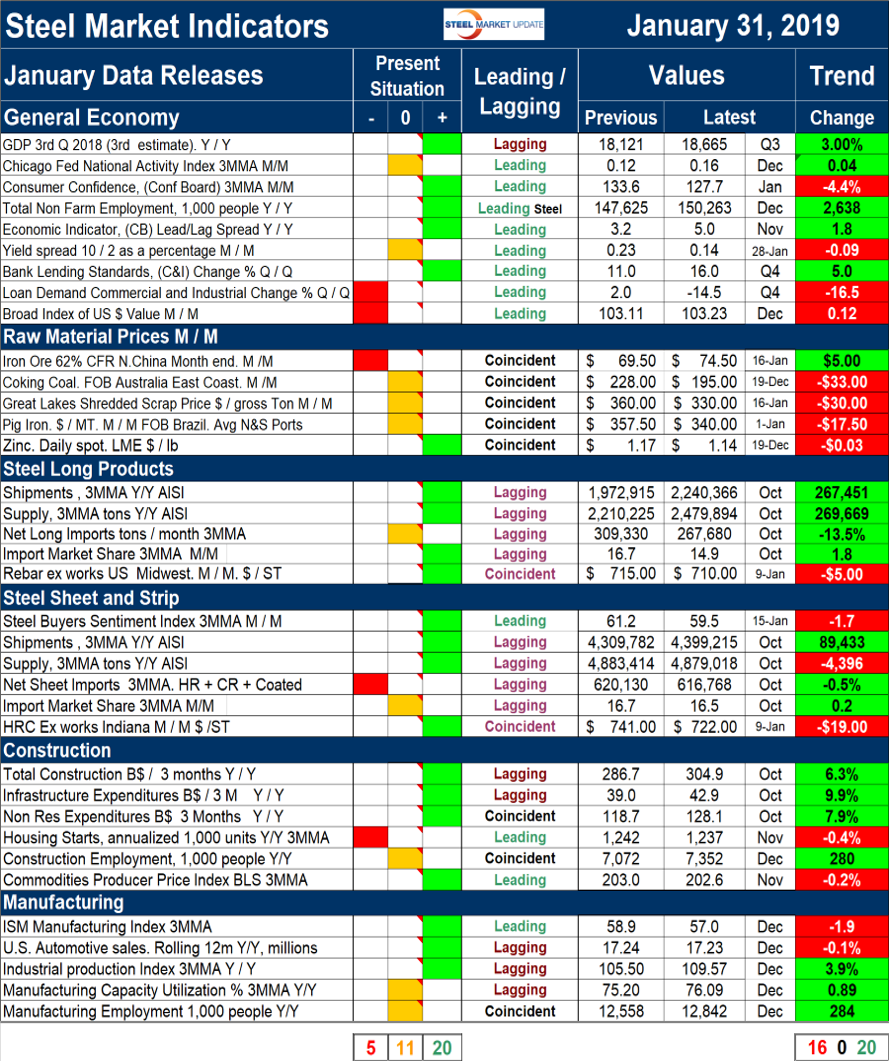
Present Situation
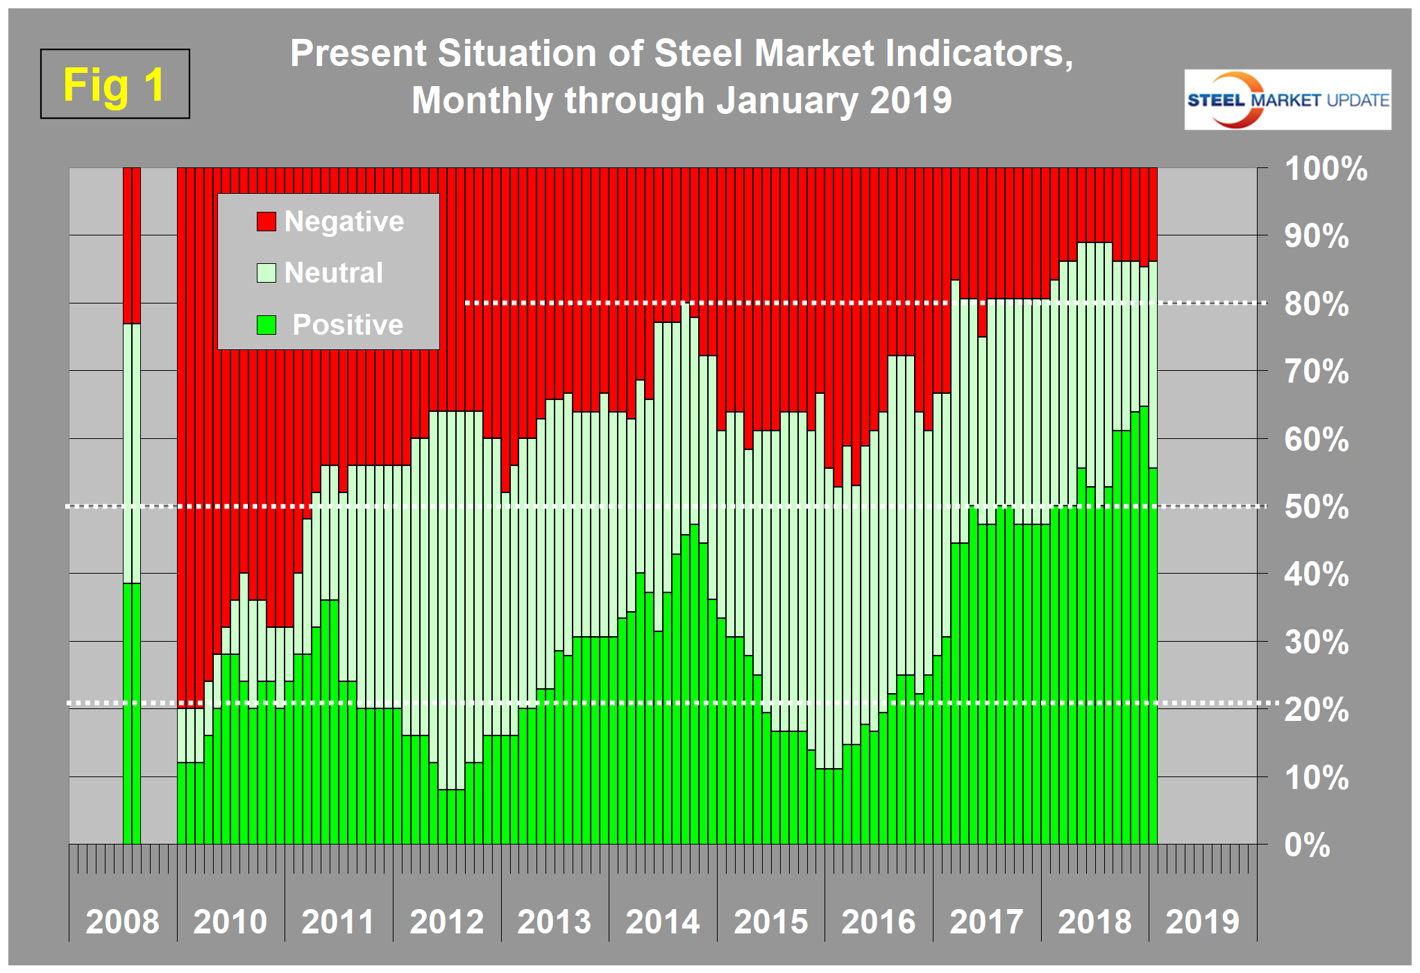
The total number of indicators considered to be positive and historically normal has been almost unchanged for five months, but within that group in January the positives decreased and the normals increased. The number of negative points remained unchanged at five. Our intent in using the word normal is to say that this indicator is in the mid-range of historical data. Figure 1 shows our monthly assessment of the present situation since January 2010 on a percentage basis. The number of historically positive indicators was at an all-time high in the history of this analysis in December, but declined by two in January. At the same time, the normals increased by two. There were no changes in the general economy section. In the raw materials section, the prices of coking coal and pig iron declined from positive to normal. There were no changes in the steel long products or sheet sections largely because most of these data streams were not updated in January. There were also no changes in the construction or manufacturing sections. All the manufacturing data streams were updated in January, but the construction data was not.
Trends
Most values in the trends columns are three-month moving averages (3MMA) to smooth out what can be very erratic monthly data. Trend changes in the individual sectors are described below together with some general comments. (Please note that in most cases this is not January data, but data that was released in January for previous months.)
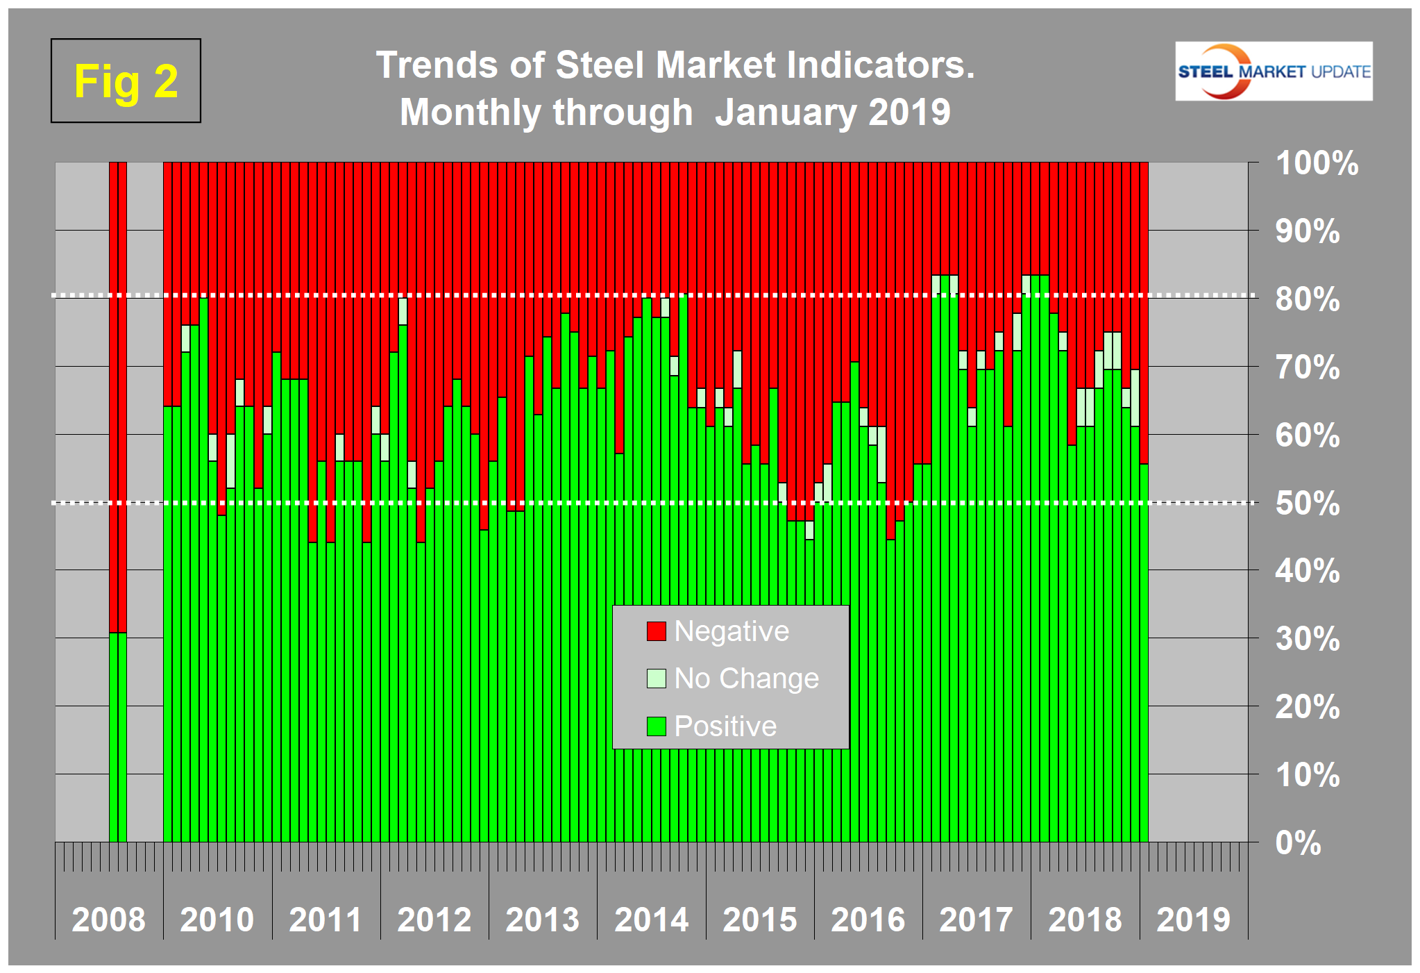
Figure 2 shows the trend of the trends and the pre-recession situation at the far left of the chart. The proportion of trends that are deteriorating is now 44.4 percent of the 36 indicators. This was an increase from 16.7 percent in January last year and a deterioration from 30.6 percent in December 2018.
Our observations about trends in the January data are as follows: In the general economy, the Chicago Fed National Activity Index reversed direction and trended positive. Five of nine indicators of the general economy are now trending positive and four negative.
There were major changes in the trends of raw materials prices in January. Only iron ore was unchanged as it continued to trend positive. Coking coal and zinc reversed direction and trended negative. Scrap and pig iron, which were unchanged in December, trended negative in January.
In the long products and sheet sections the prices of rebar and HRC both trended down in January, which in the case of rebar was a reversal. All other data streams in these sections except the steel buyer’s sentiment were not updated due to the shutdown.
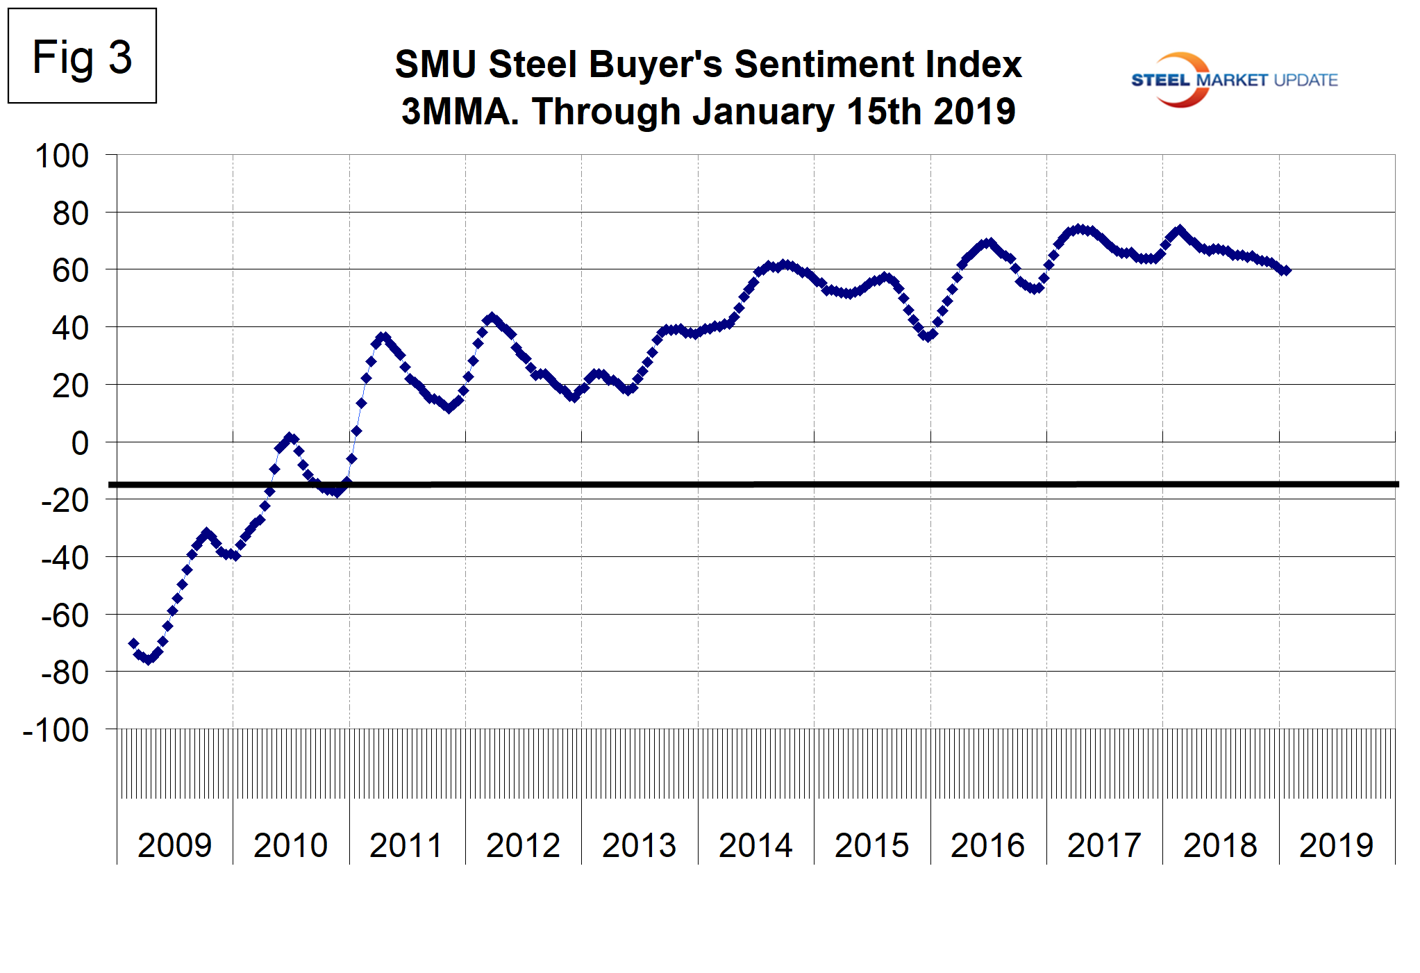
The SMU Steel Buyers Sentiment Index is a measure of the current attitude of buyers and sellers of flat rolled steel products in North America. It reports on how they feel about their company’s opportunity for success in today’s market. This index is still strong, but has declined from 73.8 in mid-February last year to 59.5 in mid-January this year (Figure 3).
Trends in construction with the exception of housing starts were good through December, but were not updated in January. The producer price index of commodities reversed course in January and became negative, driven by oil prices. This sector of the PPI analysis is a leading indicator of industrial construction, particularly energy and power projects.
There were no trend reversals in the manufacturing section and all data streams were unaffected by the shutdown. The ISM index took a step back in each of the last four months of data. U.S. automotive sales declined slightly in December. Industrial production, manufacturing capacity utilization and manufacturing employment have each trended up every month since March 2017.
We believe a continued examination of both the present situation and direction is a valuable tool for corporate business planning. Figures 1 and 2 both show the pre-recession situation in August 2008. The trends analysis shows that the steel market was going over a cliff, but the actual values of the indicators at that time were still good with only 23 percent registering as historically negative.
Explanation: The point of this analysis is to give both a quick visual appreciation of the market situation and a detailed description for those who want to dig deeper. It describes where we are now and the direction the market is headed and is designed to describe the situation on a specific date. The chart is stacked vertically to separate the primary indicators of the general economy, of raw material prices, of both sheet and long product market indicators, and of construction and manufacturing indicators. The indicators are classified as leading, coincident or lagging as shown in the third column.
Columns in the chart are designed to differentiate between where the market is today and the direction it is pointing. Our evaluation of the present situation is subjectively based on our opinion of the historical value of each indicator. There is nothing subjective about the trends section, which provides the latest facts available on the date of publication. It is quite possible for the present situation to be predominantly red and trends to be predominantly green or vice versa depending on the overall situation and direction of the market. The present situation is subdivided into: below the historical norm (-), (OK), and above the historical norm (+). The “Values” section of the chart is a quantitative definition of the market’s direction. In most cases, values are three-month moving averages to eliminate noise. In cases where seasonality is an issue, the evaluation of market direction is made on a year-over-year comparison to eliminate this effect. Where seasonality is not an issue, concurrent periods are compared. The date of the latest data is identified in the third values column. Values will always be current as of the date of publication. Finally, the far-right column quantifies the trend as a percentage or numerical change with color code classification to indicate positive or negative direction.


