

Market Data

March 3, 2019
BEA: GDP Slows to 2.6 Percent in Q4
Written by Peter Wright
Editor’s note: Steel Market Update is sharing the following Premium content with all its readers in this issue. For more information on how to upgrade to a Premium-level subscription, email info@SteelMarketUpdate.com.
U.S. economic growth slowed to 2.6 percent in fourth-quarter 2018, down from 3.4 percent in the third quarter, according to the initial estimate of GDP released Friday by the Bureau of Economic Analysis (BEA).
GDP highlights from the BEA: “The increase in real GDP in the fourth quarter reflected positive contributions from personal consumption expenditures, nonresidential fixed investment, exports, private inventory investment, and federal government spending. Those were partly offset by negative contributions from residential fixed investment, and state and local government spending. Imports, which are a subtraction in the calculation of GDP, increased. The deceleration in real GDP growth in the fourth quarter reflected decelerations in private inventory investment, and federal government spending and a downturn in state and local government spending. These movements were partly offset by an upturn in exports and acceleration in nonresidential fixed investment. Imports increased less in the fourth quarter than in the third quarter.”
GDP is now measured and reported in chained 2012 dollars, and on an annualized basis in the second quarter totaled $18.785 trillion. The growth calculation is misleading because it takes the quarter-over-quarter change and multiplies by 4 to get an annualized rate. This makes the high quarters higher and the low quarters lower. Figure 1 clearly shows this effect. The blue line is the trailing 12-months growth and the black line is the headline quarterly result. On a trailing 12-month basis, GDP was up by 3.08 percent in Q4, which was the best result since Q2 2015. To put that result into perspective the average in 36 quarters since Q1 2010 has been 2.20 percent. The blue line in Figure 1 shows the slow but steady progress of the trailing 12-month result since Q2 2016.
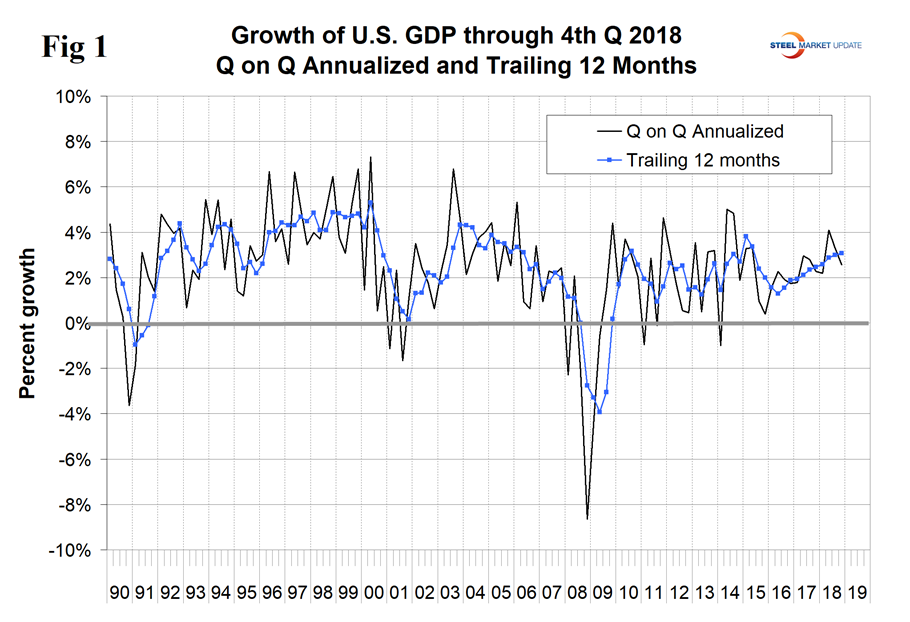
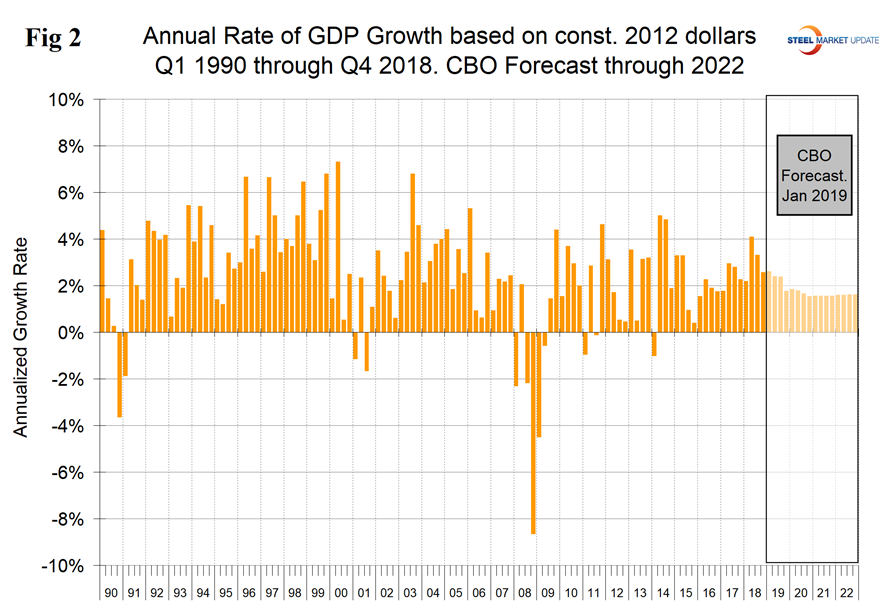
Figure 2 shows the headline quarterly results since 1990 and the January 2019 Congressional Budget Office forecast through 2022. The CBO accurately forecasted the growth rate in Q4 2018 and expects 2018 as a whole to get a boost from the tax break before falling back in Q3 2019. In its October review of the U.S. economy, the IMF wrote: “Growth in the United States, buoyed by a pro-cyclical fiscal package, continues at a robust pace and is driving U.S. interest rates higher. But U.S. growth will decline once parts of its fiscal stimulus go into reverse. Notwithstanding the present demand momentum, we have downgraded our 2019 U.S. growth forecast owing to the recently enacted tariffs on a wide range of imports from China and China’s retaliation.”
The mix of the six major contributory components in the final GDP growth calculation is shown in Figure 3. Normally, personal consumption is the dominant growth driver and this was the case in the fourth quarter. Personal consumption includes goods and services, the goods portion of which includes both durable and non-durables. The mix of the six major components in Q4 was better than in Q3, which is shown in Figure 3a. The negative contribution of net exports declined in Q4 and the positive contribution of inventories also declined. The contribution of inventories increased from negative 1.17 percent in Q2 2018 to positive 2.33 percent in Q3 2018 and declined to positive 0.13 percent in Q4. Rising inventories are entered as a positive in the GDP calculation. Note that in the definitions at the end of this piece, inventories are not mentioned. Over the long run, inventory changes are a wash and simply move growth from one period to another.
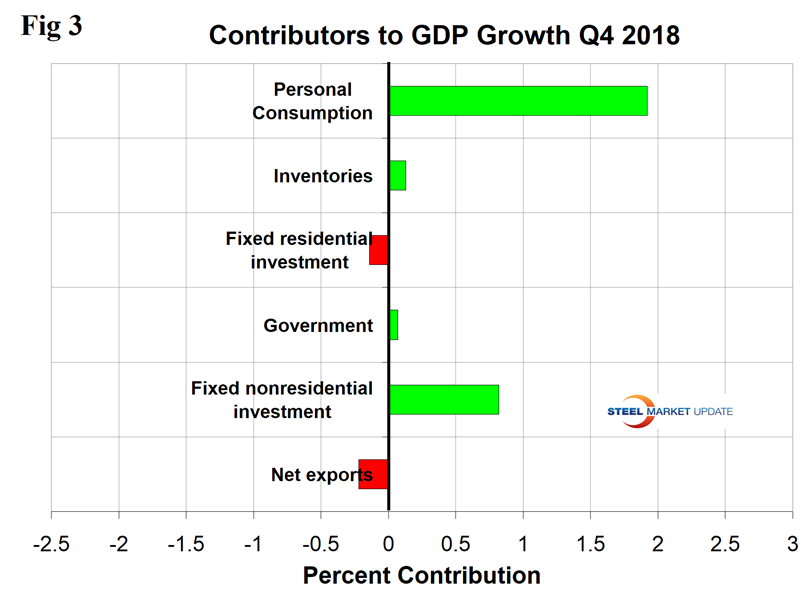
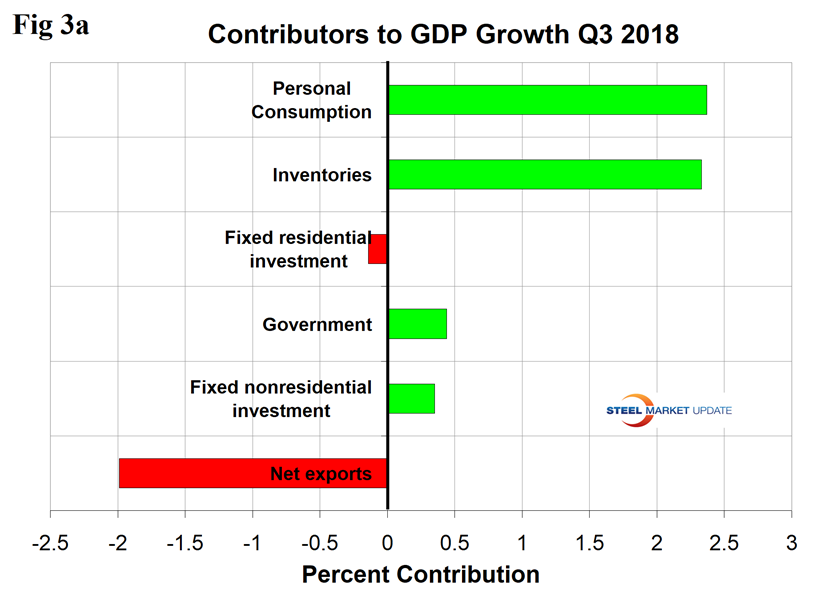
Figure 4 shows the contributions of residential and nonresidential investment. After the recession, nonresidential investment bounced back but residential did not and has had less than a 1 percent variation since Q3 2010. After a disappointing result in Q3, nonresidential bounced back in Q4 when it made a 0.82 percent contribution. The contribution of government expenditures was positive 0.07 percent in the fourth quarter.
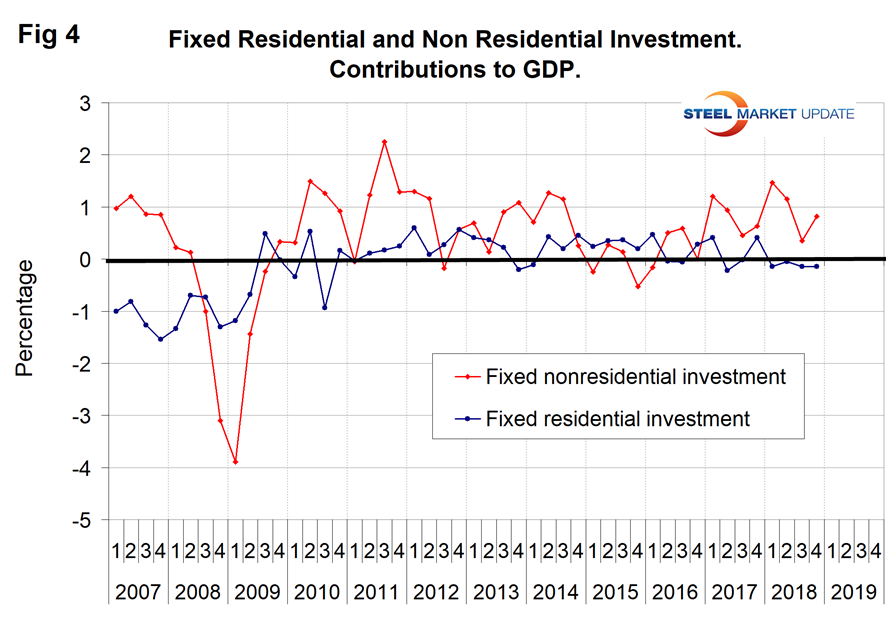
Figure 5 shows the quarterly contributors of the six major subcomponents of GDP since Q1 2007. This chart clearly shows the whipsaw effect of inventory changes.
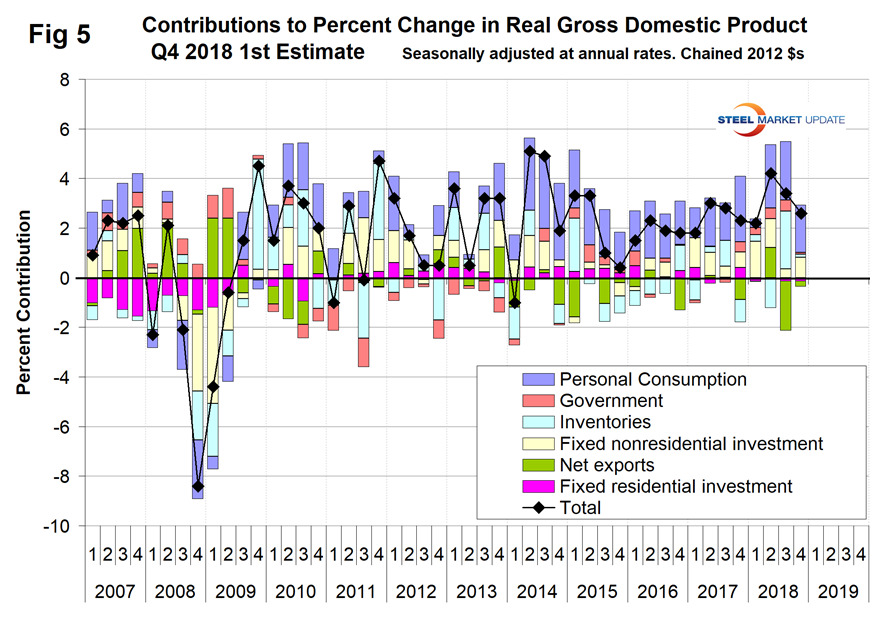
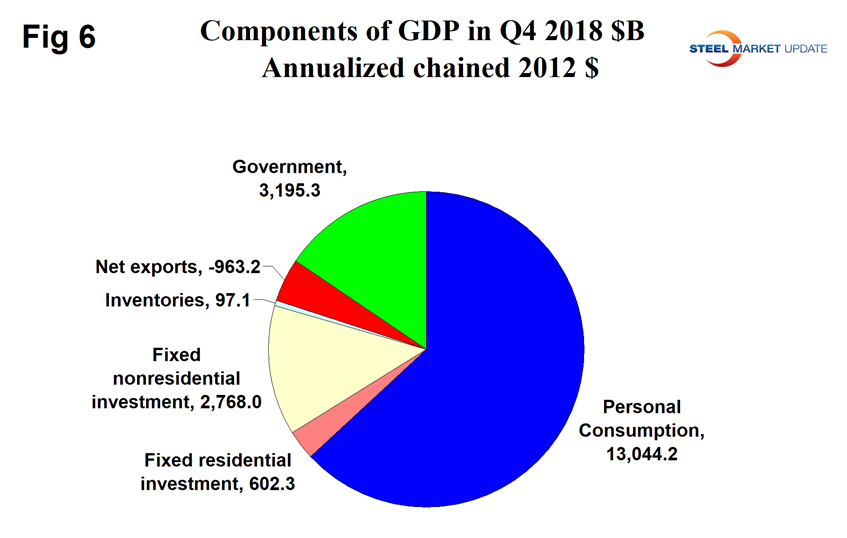
Figure 6 shows the breakdown of the $18.8 trillion economy.
SMU Comment: The trailing 12-month growth rate has improved for each of the last 10 quarters and in Q4 reached 3.08 percent. Q3 and Q4 were the first quarters to reach 3.0 percent since Q2 2015 and are high enough to stimulate a growth in steel consumption, which requires about a 2.2 percent growth to break even. In its January 2019 forecast, the CBO continued to project a decline in economic growth in both 2019 and 2020 falling below 2.0 percent in Q4 2019 where it remains through 2029.
CBO estimates that the partial shutdown delayed $18 billion in federal spending and suspended some federal services, thus lowering the projected level of real GDP in the first quarter of 2019 by $8 billion (in 2019 dollars), or 0.2 percent.
Definition of GDP: Gross domestic product (GDP) is the value of the goods and services produced by the nation’s economy less the value of the goods and services used up in production.
GDP is defined as Consumption (C) plus Investment (I) plus Government Spending (G) plus [Exports (E) minus Imports (I)] or: GDP = C + I + G + (E-I)
This equation is known as an identity. An identity is an equality that remains true regardless of the values of any variables that appear within it. That means it is not a guess or an approximation. It is simple reality.
National savings is GDP minus (consumption plus government spending). That means that investment equals savings plus net exports. If there are no net exports, then money must come back into the U.S. from outside the country to finance investments, along with savings.
Thus, if there is a government deficit, there must be savings by both consumers and businesses, plus capital flows from outside the country, to offset that deficit in order for there to be any money left over for investments.
Another definition of GDP states that it equals the growth in working population multiplied by their productivity.


