

Market Data
September 17, 2019
Currency Update for Steel Trading Nations
Written by Peter Wright
The U.S. dollar has weakened against 11 of the 16 steel trading nation currencies in the last month and against eight in the last three months.
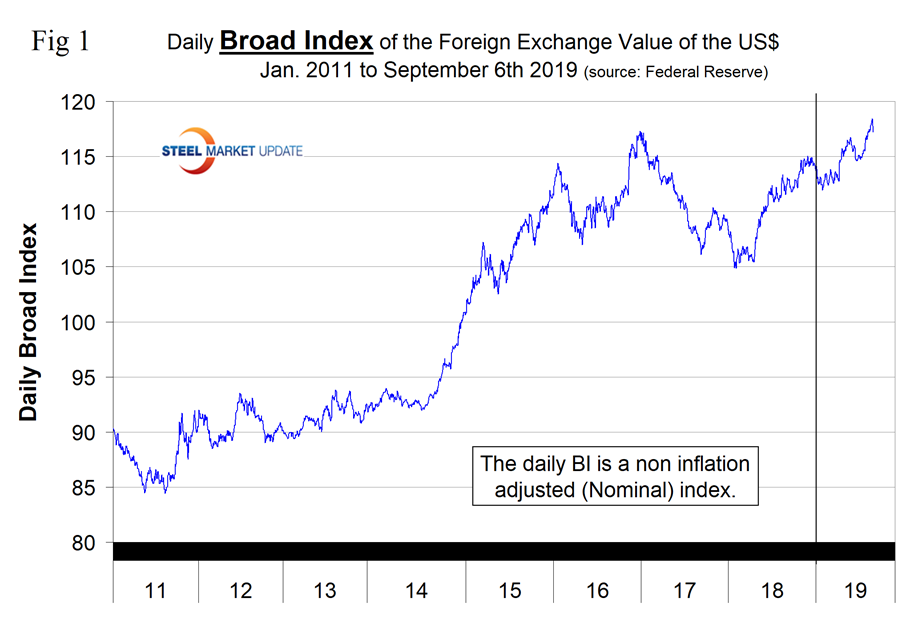
In this report we examine the change in currency values of the 16 preeminent global steel and iron ore trading nations. The currencies of these 16 don’t necessarily follow the Broad Index value of the U.S, dollar. In fact, at any given time, some are always moving in the opposite direction. The latest value of the Broad Index as published by the Federal Reserve was Sept. 6. In three months prior to that date, the dollar had strengthened by 2.2 percent and by 0.1 percent in the previous 30 days.
![]()
Figure 1 plots the daily Broad Index (BI) value of the U.S. dollar since 2011. The dollar has been on an erratic upward trend this year. The dollar index has appreciated by 2.0 percent in the last three months and by 0.1 percent in the last month. The BI is now higher than its recent peak of Dec. 28, 2016.
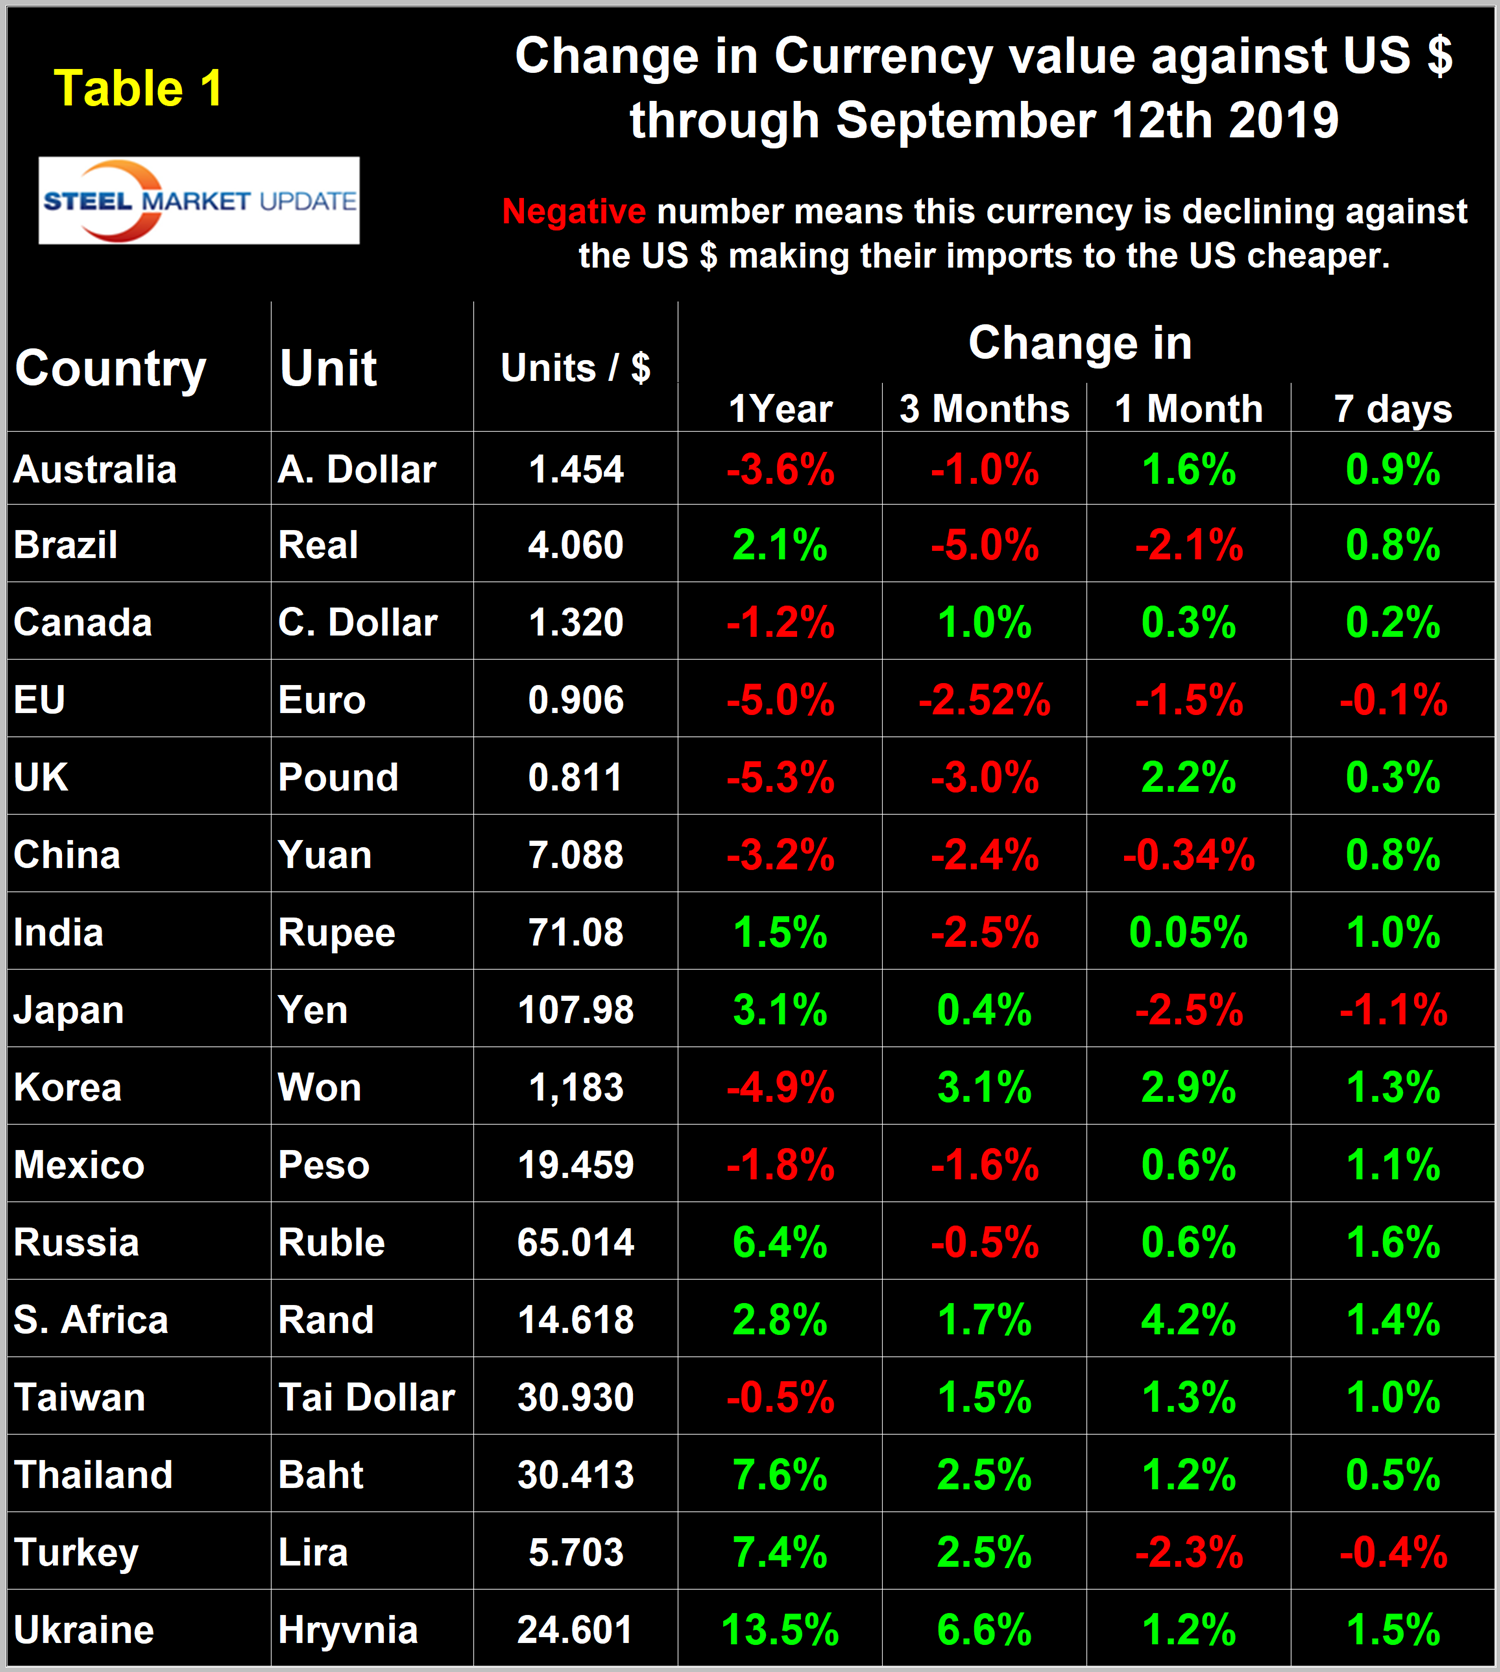
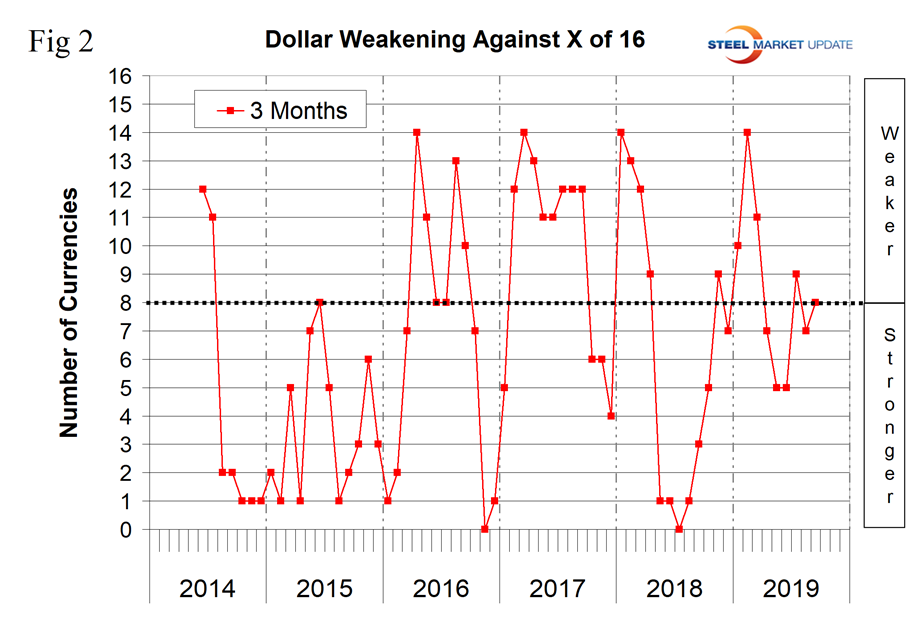
At Steel Market Update, we track the currencies of 16 steel trading nations. Table 1 shows the number of currency units that it takes to buy one U.S. dollar and the percentage change in the last year, three months, one month and seven days. The overall picture for the steel trading nations is that in the last year the U.S. dollar has strengthened against eight of the 16. In the last three months, the dollar has also strengthened against eight (but not the same eight). In the last month, the dollar has weakened against 11 of the 16 and strengthened against the other five. Table 1 is color coded to indicate weakening of the dollar in green and strengthening in red. We regard strengthening of the U.S. dollar as negative and weakening as positive because of the effect on net imports. Figure 2 shows the extreme gyrations that have occurred at the three-month levels in the last four years.
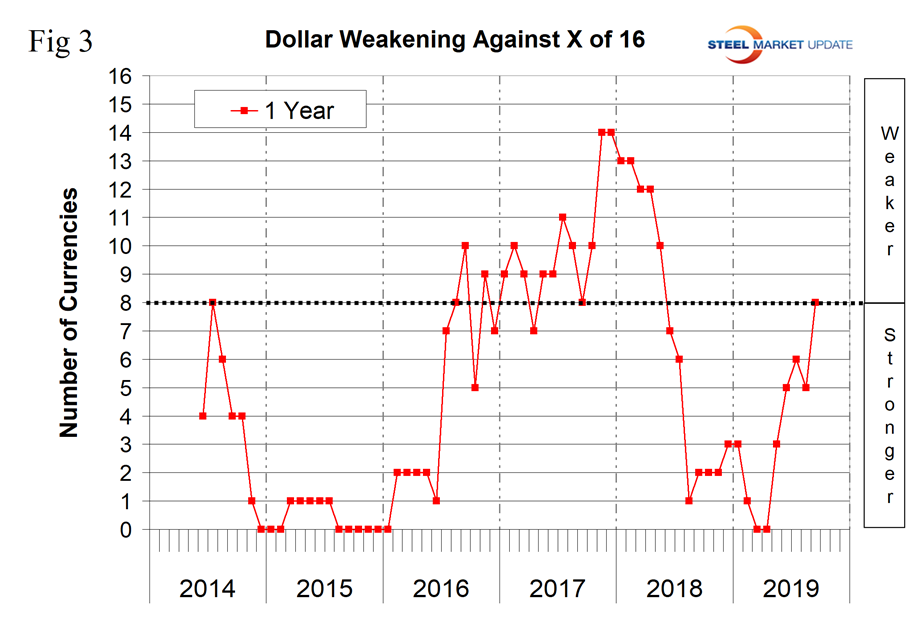
To try to get a less volatile look at the changes in value of the 16 currencies under examination, we have developed Figure 3. This shows the number of currencies against which the dollar was weakening on a year-over-year basis and that since April the dollar has declined. This is a contrary conclusion to the one we made above based on the daily Broad Index. This is another example of how it’s possible to spin data to draw opposite conclusions. In this and our other reports, we attempt to present the facts so subscribers can draw their own conclusions. But it is clear that to accept the Broad Index at face value does not accurately characterize the steel story.
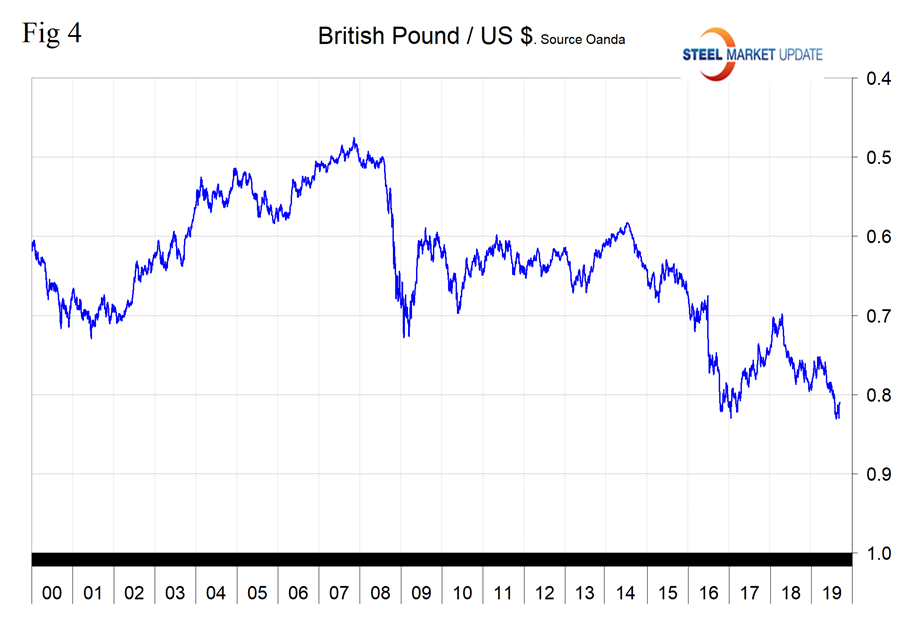
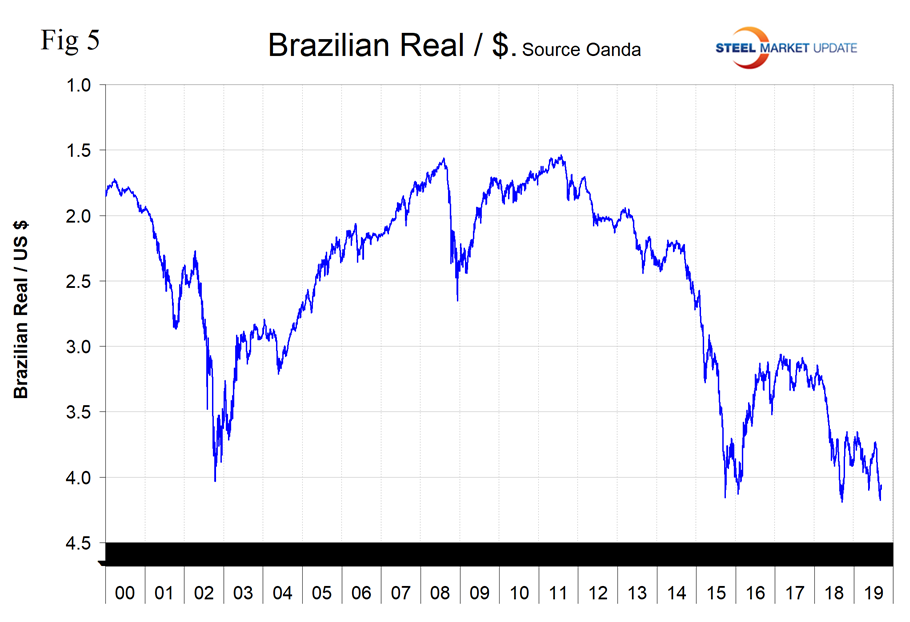
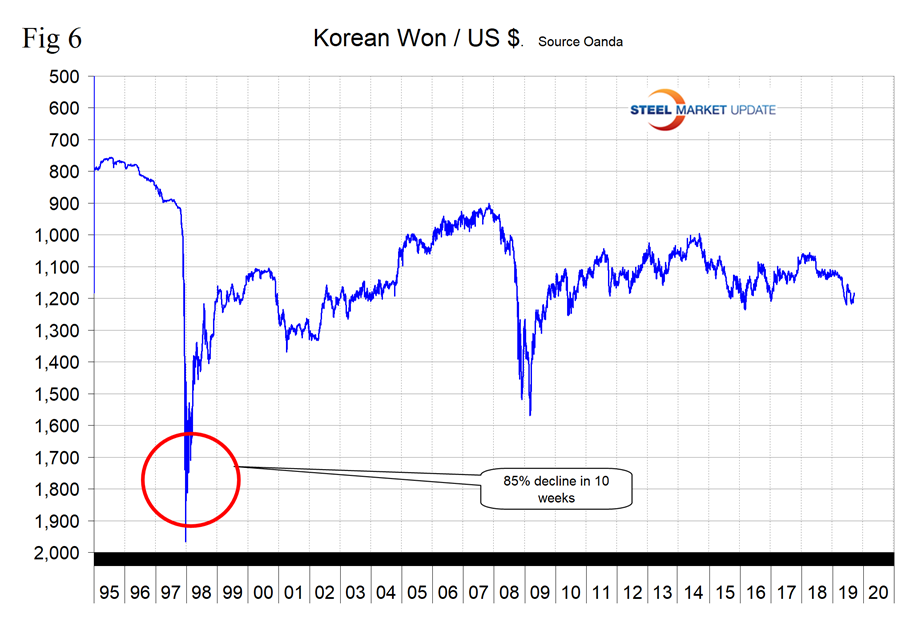
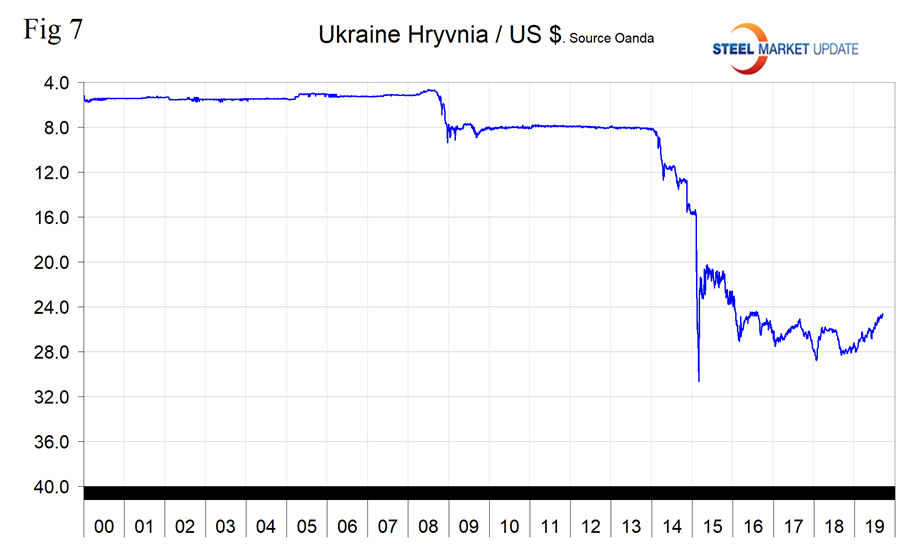
Big movers in the last three months have been the UK, down by 3.0 percent; Brazil, down by 5.0 percent; Korea, up by 3.1 percent; and Ukraine, up by 6.6 percent. We present long-term charts of the value of these four currencies against the dollar below. (See the end of this report for details of data sources.)
The UK’s Pound
The UK pound has declined by 5.3 percent in the last year, and by 3.0 percent in the last three months, but has picked back up by 2.2 percent in the last month. The pound is now worth 1.2334 U.S. dollars. The Brexit saga continues, resulting in unprecedented political chaos and the suspension of Parliament for five weeks.
Brazil’s Real
The Brazilian real has declined by 2.1 percent in the last month and by 5.0 percent in three months. The U.S. dollar is now worth 4.06 real.
South Korea’s Won
The South Korean won has appreciated by 2.9 percent in the last month and by 3.1 percent in three months. The U.S. dollar is now worth 1,183 won.
The Ukraine’s Hryvnia
The Ukrainian Hryvnia has appreciated by 1.2 percent in the last month, by 6.6 percent in three months and by 13.5 percent in the last year. One U.S. dollar is now worth 24.6 hryvnia.
In this monthly analysis we show the trends we think have the most immediate significance, but all 16 steel trading nation graphs are available on request.
Explanation of Data Sources: The Broad Index is published by the Federal Reserve on both a daily and monthly basis. It is a weighted average of the foreign exchange values of the U.S. dollar against the currencies of a large group of major U.S. trading partners. The index weights, which change over time, are derived from U.S. export shares and from U.S. and foreign import shares. The data are noon buying rates in New York for cable transfers payable in the listed currencies. At SMU, we use the historical exchange rates published in the Oanda Forex trading platform to track the currency value of the U.S. dollar against that of 16 steel trading nations. Oanda operates within the guidelines of six major regulatory authorities around the world and provides access to over 70 currency pairs. Approximately $4 trillion U.S. dollars are traded every day on foreign exchange markets.


