

Prices

September 19, 2019
Dead Cat Bounces are Not Unusual in Down Cycles
Written by John Packard
Steel Market Update thought it might be interesting to review steel prices over the past 11 years, or since we began producing our own steel indices. As you can see by the graphic below, there have been three strong downward cycles over the past 11 years. The first was in 2011, the second began in 2014 and lasted until December 2015, followed by the cycle that began in late July 2018.
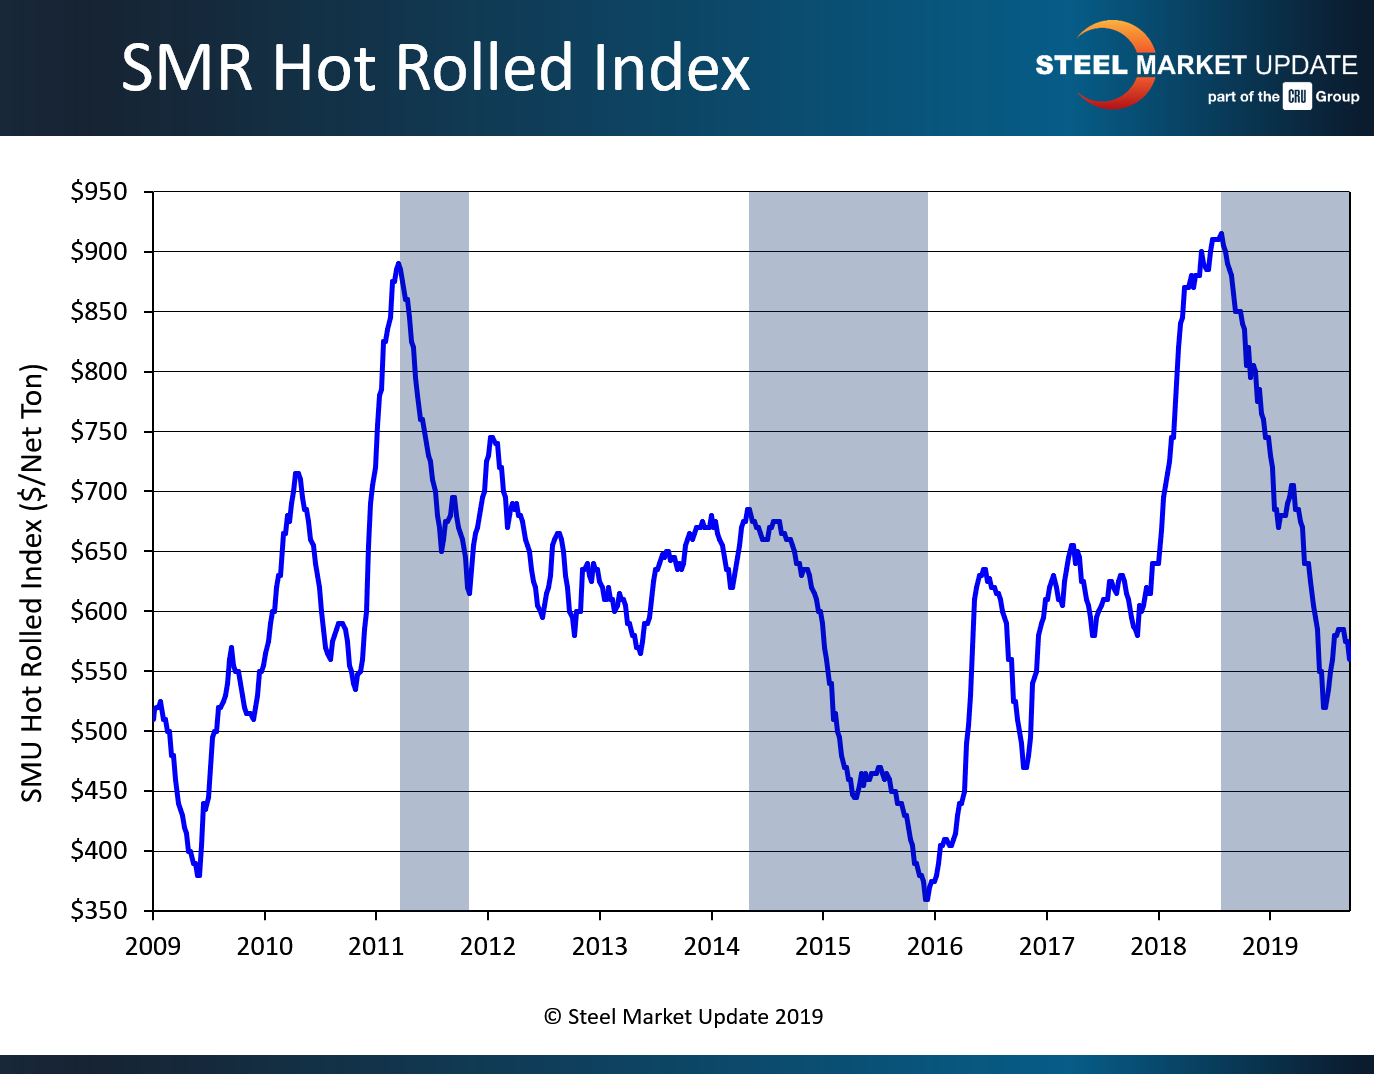
The first strong downward movement in steel prices started when hot rolled prices peaked at $890 per ton ($44.50/cwt) on March 22, 2011. From there prices dropped for 33 weeks before bottoming at $615 per ton ($30.75/cwt). In total, prices fell by $275 per ton ($13.75/cwt) during this cycle. There was one $45 per ton “dead cat bounce” late in the cycle, which can be seen in the graphic above.
From 2012 until May 2014, we went through a period when steel prices tried to stay in the $600-$700 per ton range.
In May 2014, we saw prices peak at $685 per ton ($34.25/cwt), then over the next 83 weeks fall to the lowest levels our index ever recorded at $360 per ton ($18.00/cwt). This equates to a total cycle move of $325 per ton ($16.25/cwt). During this cycle we saw one “dead cat bounce” of $20 per ton, which lasted three months (essentially trending sideways) before dropping another $110 per ton to reach the $360 per ton bottom.
We had a tumultuous year in 2016 with a sharp spike in prices (+$275 per ton from the December 2015 low) followed by a modest drop (-$165 per ton) ending in November 2016.
Prices recovered to $610 per ton by the first week of January 2017, and the rest of that year saw very little movement in prices as 2017 ended up $30 per ton from where it started.
Then came 2018 and Section 232. The domestic steel mills were moving prices ahead of the Section 232 tariff announcement by the Trump administration. By the time we got the announcement of the 25 percent tariff rate, and implementation of the new steel tariffs, prices had reached $915 per ton ($45.75/cwt).
For the next 49 weeks prices fell, “bottoming” at $520 per ton on July 2, 2019. Looking at the graphic, we saw a dead cat bounce of $35 per ton over approximately a six-week period from late January 2019 until mid-March 2019 before prices continued their downward spiral.
The questions before us now: Have we just concluded a second “dead cat bounce” of $65 per ton over a seven-week period? Will the mills be able to wait out the market and get lead times into early 2020 with the hope prices will not breach the $520 per ton lows recorded earlier this year? Will we go back to looking at a market and market prices like those reported in 2012 through mid-2014? Is there anything out there that could move prices higher from here?
Steel buyers are telling SMU they expect the $520 per ton levels to be reached over the next few weeks as the sense is the mill order books have slowed and pressure is building for prices to move much lower from our current $560 per ton ($28.00/cwt).
SMU has had conversations with steel buyers about ongoing negotiations and we have heard buyers speak of making offers around $500 per ton. So far, we have not heard of a mill taking a deal at that number. Our impression is steel buyers are going to wait out the mills, especially with the General Motors strike hanging over their heads.
Stay tuned.


