

Market Data
October 15, 2019
CRU: The Sun is Setting on the U.S. Expansion
Written by Lisa Morrison
By CRU Principal Economist Lisa Morrison
The U.S. economy is in the midst of its longest economic expansion on record—124 months and counting. The recent deceleration in U.S. growth momentum and the fading health of the global economy call into question whether the expansion can continue, and for how long. In this article, we discuss the current state of the U.S. economy and our reasons why we are not yet calling a U.S. recession in our base case forecast.
Momentum Has Eased But the Expansion Lives On
In the United States, the National Bureau of Economic Research (NBER) defines the duration of recessions and expansions and its website states the following: “The NBER does not define a recession in terms of two consecutive quarters of decline in real GDP. Rather, a recession is a significant decline in economic activity spread across the economy, lasting more than a few months, normally visible in real GDP, real income, employment, industrial production, and wholesale-retail sales”.
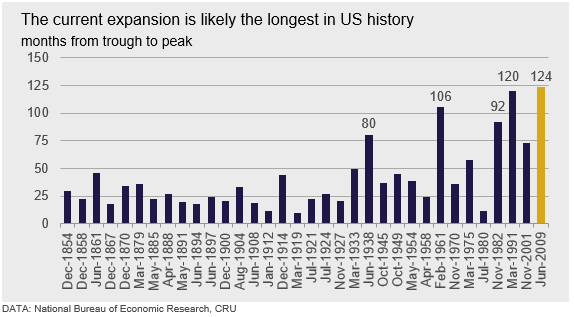
The current expansion began in June 2009 and, as far as we know, is still ongoing. Not surprisingly, the long life of the current expansion has generated discussion around how long it can last, when and why will it end, and what the next recession might look like.
The chart below illustrates the growth in GDP, and the key expenditure components, both in 2018 and YTD through Q2 2019.
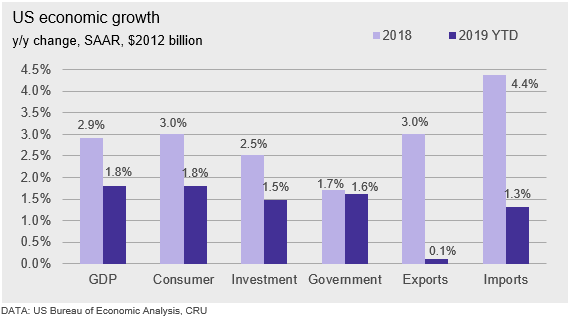
The U.S. economy performed very well during 2018 (light purple bars), despite a good deal of uncertainty generated by both trade and monetary policy. Last year, GDP expanded by 2.9 percent which, according to estimates by the Congressional Budget Office, exceeded the estimated potential output growth of just under 1.9 percent. Growth during H1 2019 has been more moderate, however, at 1.8 percent.
Consumer spending expanded robustly by 3.0 percent in 2018 and has grown by another 1.8 percent thus far in 2019. Private investment spending was strong last year, boosted by the corporate tax cut. It has been somewhat disappointing so far this year, reflecting the fading of that fiscal boost as well as the negative impact of the trade war uncertainty. Government spending has grown at similar rates to 2018.
The real divergence in growth between 2018 and 2019 has come from the trade components. In 2018, import growth skyrocketed, particularly at the end of the year, to avoid tariffs on Chinese goods that threatened to come into force on Jan. 1, 2019. Similarly, to avoid retaliatory tariffs from China, exports also expanded strongly toward the end of last year.
With import tariffs higher than a year ago, it seems counterintuitive that, thus far in 2019, import volumes have increased, rather than declined. By contrast, given the negative fallout from U.S. protectionist trade policies, it is not surprising that export volumes have stagnated. In fact, the U.S. trade deficit YTD through August 2019 is 7.1 percent higher than during the first eight months of 2018.
Although the GDP growth picture still points to an expanding economy, lower investment spending is translating into weakness in the manufacturing sector thus far in 2019, which the charts below illustrate.
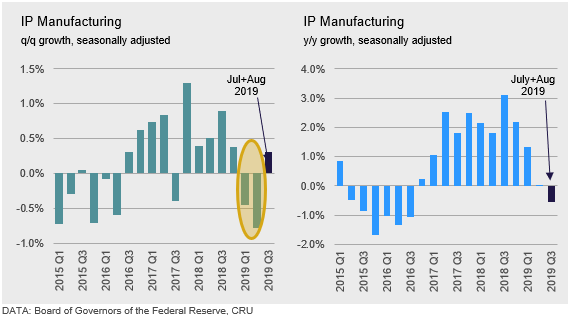
The chart to the left shows that q/q growth in manufacturing output contracted in both Q1 2019 and Q2 2019. It is encouraging that output in both July and August increased somewhat and, when averaged together, amounts to a small 0.3 percent q/q gain over the Q2 2019 level. In year-on-year terms, however, the chart to the right illustrates that the average of July and August together points to a decline in manufacturing of nearly 0.6 percent y/y. Since Q2 2018 marked a cyclical peak in the U.S. economy, we would expect H2 2019 to track below the year-ago levels.
The metals-intensive sectors of the economy currently feel as if they are in recession— indeed, output is declining. However, the overall fortunes of the U.S. economy are less tied to the manufacturing sector than in the past. In fact, when IP contracted during 2015 and 2016, it was the first case in recorded U.S. history where manufacturing declined but the economy did not fall into recession. Thus, we cannot count on a contraction in manufacturing to signal the next recession.
Underlying Vulnerabilities Trigger Recessions
Following the peak of the economic cycle in Q2 2018, it is reasonable to expect some deceleration in economic momentum. This “base effect,” coupled with the uncertainty around trade policy and the weaker growth picture outside the U.S., provide headwinds to stronger U.S. economic growth going forward.
While there will surely be another recession at some point in time, timing a recession is extraordinarily difficult. That said, historical experience over the last 70+ years indicates that U.S. recessions tend to occur when the economy is experiencing particular vulnerabilities that fall broadly into three categories:
• Excess leverage/financial market speculation.
• Overheating in the economy/growth constraints.
• An exogenous shock, which then triggers a crisis of confidence.
When we look at the state of the U.S. economy today, many of the conditions which triggered recessions in the past do exist.
Excess leverage/financial speculation: Some sort of financial excess has been present in six of the seven recessions that have occurred since 1960. The most recent example is the U.S. housing bubble, which led to the global financial crisis (GFC) and which was fueled by lax lending standards for mortgages.
Currently there is much discussion around both the level of government debt (which has expanded due to the 2018 corporate tax cut) as well as the level of corporate debt (which expanded because of very low interest rates). In addition, the stock market has been achieving new highs, which is often a sign a correction is needed. In the two charts below, we illustrate the total debt burden of the U.S. economy as a share of GDP (left) and the value of the entire U.S. stock market as measured by the Wilshire 5000 price index (right).
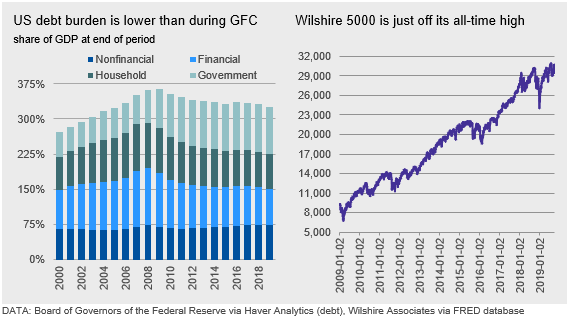
As of Q2 2019, the total U.S. debt burden amounted to ~326 percent of GDP, which is equivalent to levels in 2006, pre-GFC. Although this is still an extremely high level of debt, the burden is shared relatively evenly across the debt-holding sectors compared with the past. Banks are better capitalized than before the GFC while U.S. consumers have reduced their debt holdings.
The Wilshire 5000 hit its first post-Trump peak on Jan. 26, 2018, and its most recent was achieved on July 26, 2019. However, the advances in the index have been relatively small since 2018, with the valuation likely constrained by concerns over the effects that trade and monetary policy would have on the profitability of U.S. companies.
Based on the stability in the debt portfolio and the lack of further acceleration in the Wilshire 5000 during the last 18 months, at this point, we do not think that overleveraging or financial market speculation are likely to be triggers of the next recession.
An overheating economy: When an economy is booming, consumers are spending, and companies are investing. Since it becomes more difficult to hire enough employees to keep up with demand, wages are usually rising as well, which feeds back into stronger consumer spending. If spending (i.e. demand) exceeds the available supply of goods and services, inflation accelerates. When inflation exceeds the central bank’s target range, the central bank raises interest rates, therefore throwing cold water on the overheating economy. As a result, borrowing for big ticket items and the cost of financing business expansion becomes more expensive. In response, companies stop hiring and consumer spending contracts, triggering a recession.
Is the U.S. economy in danger of overheating? This is a tough question to answer right now because there are mixed signals. The charts below provide the level of inflation and the unemployment rate, both of which are used by the Fed to make decisions on interest rates.
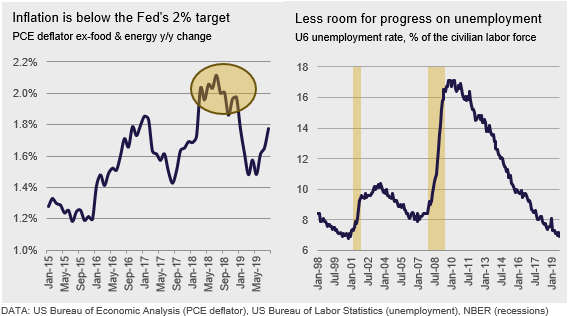
In the chart to the left, we can see that, during 2018, in certain months, inflation moderately exceeded the Fed’s 2 percent target—which explains why the Fed was comfortable raising interest rates last year. However, thus far in 2019, inflation has fallen well below the target and the Fed has since lowered rates, most recently in July.
The chart, however, shows a different picture. It illustrates the U-6 unemployment rate, which is the most inclusive measure of unemployment produced in the U.S. It includes not only everyone looking for a job, but also those who are working part-time but would like full-time work. In September 2019, the U-6 unemployment rate dropped to 6.9 percent, very close the all-time low of 6.8 percent achieved in October 2000.
The fact that inflation is not accelerating points to the lack of pressure coming from higher demand. However, the low level of the U-6 unemployment rate could be an indicator of a growth constraint on the supply side going forward. In fact, experience in the last two recessions indicates that there may be between nine and 15 months until the onset of the next recession after U-6 hits its cycle low.
Exogenous shock leading to crisis of confidence: It is not just the actions of economic actors—consumers, businesses, governments and central banks—which provide the fodder for recessions. It is the effect of those actions, and even shocks to the system, which contribute to downturns as well. Oil shocks, the Sept. 11 terrorist attacks and a loss of confidence in the U.S. dollar have all played a part in previous U.S. recessions.
There is no shortage of potential exogenous shocks that could trigger recession at this point. Brexit has weighed on the European economy and the day of the “divorce” is still set for Oct. 31, 2019. Though we do not expect Brexit to have a large effect on the U.S. economy, there has never been a Brexit before, so its effect is not known. Tensions have recently flared between the U.S. and Iran in the Middle East. Thus far, oil market participants are currently more preoccupied with weak demand than concern about supply, so prices have not risen—that could change quickly. China is navigating its “managed slowdown” relatively well, but there is always the possibility that civil unrest could upend that process. Given that China is the world’s workshop, a disruption in its export base could have an extremely negative effect on manufacturing elsewhere.
The problem with shocks is that, while many of them are “known,” the circumstances that actually set off the powder keg are rarely anticipated and usually come as a surprise.
A Weak Corporate Sector Could Transmit Recession to the Consumer
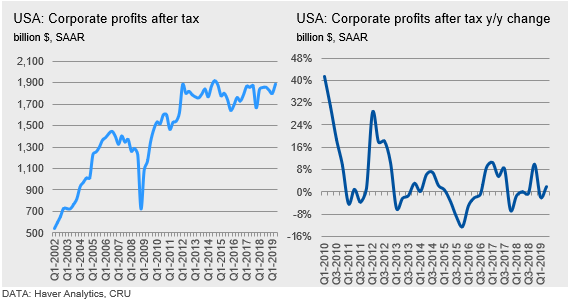
Currently, U.S. protectionist trade policies are functioning as a shock to the U.S. economy (and to the rest of the world for that matter) and have the potential to push the U.S. into a recession. Thus far, tariffs have raised the cost of imports, not only from China, but also for importers of steel and aluminum from a variety of countries. Because U.S. companies are responsible to pay the tariff and have thus far tried to maintain prices at pre-tariff levels, the increase in import costs is exerting downward pressure on margins and constraining company profits.
Weaker profits growth, in turn, makes it difficult for U.S. companies to spend money on capital outlays or new hiring, which is exacerbated by the lack of certainty around trade policy going forward. The chart below and to the left shows that the level of corporate profits has not expanded very much since the tax cut was implemented in 2018. The chart below and to the right shows how weak the growth in profits has been thus far in 2019.
Recall that U.S. unemployment, even using the fullest measure, is very low at this stage. For at least the last two years, companies have been experiencing difficulty hiring the right people to maintain their existing operations.
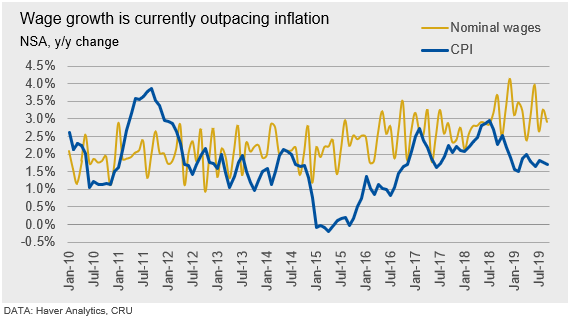
The chart below shows how wage growth (gold line) has been rising since 2015, but it was largely in line with gains in inflation as measured by the consumer price index (CPI). However, since July 2018, wage gains have been far outpacing the rise in consumer price levels, indicating just how difficult it has been to find workers.
In an environment where company profits are already being squeezed by the trade war— either through the inability to expand exports, or the higher cost of imports—and are also under pressure from rising wages, the potential to increase investment outlays or to hire additional workers is further constrained.
If companies stop investing and stop hiring, unemployment will rise. Consumer confidence will fall, and consumers will stop spending. The cycle is then complete. If consumers stop buying, company profits will come under further pressure from a lack of volume and work forces will be further reduced. This mechanism will continue until the economy finds an equilibrium point between supply and demand, and from which a new expansion can blossom.
We Expect a Weaker U.S. Economy in 2020, But a Recession is Not Our Base Case
The fundamental risk underlying the U.S. economy’s growth potential next year is whether the Trump administration’s protectionist policies will result in a contraction in corporate spending, which eventually leads to higher unemployment and a contraction in consumer spending.
• We have already noted how the higher cost of imports has negatively affected corporate profits and made it much harder for companies to make the decision to expand.
• During September, both The Conference Board and the University of Michigan consumer surveys indicate that the imposition of tariffs on all Chinese imports as of mid-December is now weighing on consumers’ view of the future.
• We expect the Trump administration to decide whether it will levy tariffs on vehicles in parts in mid-November. If tariffs are implemented, this will create significant disruption in the automotive value chain and will have negative consequences not only on U.S. vehicle production, but also on consumer demand for autos.
Although there are looming risks to the U.S. economic expansion, we are not ready to call for a recession just yet. Although manufacturing has been disrupted by the trade war, there are signs of potential onshoring, which should become more evident in H2 2020. Unemployment has not started to rise, and consumers are still spending. The Fed appears committed to extending the expansion by lowering interest rates and this should help consumers in terms of purchasing homes, cars and other durable goods. In addition, it keeps the cost of financing low for companies as well. Monetary policy is very limited, however, and the limits will surely be tested in 2020.


