Market Data

November 1, 2019
More Contraction for Manufacturing with PMI at 48.3
Written by Sandy Williams
The Institute for Supply Management’s Manufacturing PMI remained in contraction in October with a reading of 48.3, the third month of contraction, indicating continued softening in the manufacturing sector. The October reading was an increase of 0.5 percentage points from September. Nine of the ten components of the index registered below the neutral point of 50 in October, with only new export orders showing stronger growth.
“Comments from the panel reflect an improvement from the prior month, but sentiment remains more cautious than optimistic,” said Timothy Fiore, chairman of the ISM Manufacturing Business Survey Committee. “Global trade remains the most significant cross-industry issue.”
The new orders index increased 1.8 points to 49.1 in October with the transportation industry causing the most drag on the index last month, said Fiore. Five of 18 manufacturing industries reported growth in new orders in October, including fabricated metal products. Primary metals, transportation equipment, machinery, and petroleum & coal products were among the industries that reported declining orders.
The production index fell 1.1 points from September to register 46.2. Suppliers were quicker to deliver to manufacturers in October after 43 consecutive months of slowing. Backlog of orders posted an index reading of 44.1 percent, down 1 point from September.
“Backlogs continued to contract moderately, despite new order contraction slowing compared to September. Five of the six big industry sectors’ backlogs contracted during the period,” said Fiore.
The inventory index rose 2 percentage points to 48.9, a fifth month of contraction but at a slower rate. Customer inventories were considered too low, but are beginning to stabilize. The index rose 2.3 points to 47.8 in October.
The import index contracted for a fourth month falling to 45.3 percent in October. New export orders, however, gained 9.4 points for an index reading at 50.4.
Survey respondents had the following comments:
• “Automotive related manufacturing is definitely slowing in the U.S. I think we are seeing the negative impacts of the tariff war with China and the unsigned [U.S.-Mexico-Canada Agreement] deal starting to hurt consumer confidence, especially on large purchases. Corporations are slowing orders/production accordingly.” (Primary Metals)
• “Been hearing from lots of my suppliers that their business is down and [they are] looking for more work in the metal processing [and] machining areas. We remain very busy.” (Fabricated Metal Products)
• “Production demand is softening; some [of it is] due to seasonality, [but] much [is] due to customer order rate declining and dealer inventory stabilizing.” (Machinery)
• “Automotive sales continue to decrease; however, trucks and SUVs are still providing decent revenue. Cautiously optimistic for the near term.” (Transportation Equipment)
• “Our business levels have softened over the last three to five months in the U.S. market [and] globally. Germany and China are both experiencing similar slowdowns. We are in the industrial industry, and the outlook appears to remain soft into Q1 of 2020.” (Electrical Equipment, Appliances & Components)
• “Customer demand is down, and we are expecting a very soft fourth quarter, without much relief in sight for Q1. Suppliers report the continued rise in labor costs, which are ultimately reflected in the rising product costs.” (Computer & Electronic Products)
• “The chemical manufacturing industry is depressed; demand across many markets globally is down, and pricing is as a result.” (Chemical Products)
• “Economy is showing slight signs of weakening. The same business headwinds on trade, tariffs, and currency uncertainty are making the environment challenging.” (Food, Beverage & Tobacco Products)
• “Business for thermoplastic resins is very strong, but margins continue to be under pressure due to tariffs and global economy uncertainty.” (Plastics & Rubber Products)
• “Trade cost pressures continue to be a headwind in our business.” (Paper Products)
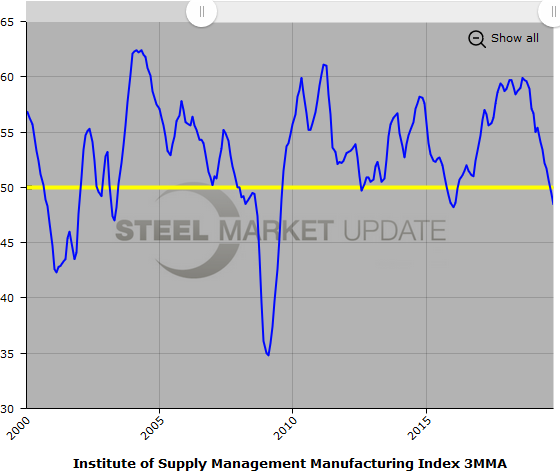
Below is a graph showing the history of the ISM Manufacturing Index. You will need to view the graph on our website to use its interactive features; you can do so by clicking here. If you need assistance logging in to or navigating the website, please contact us at info@SteelMarketUpdate.com.