

Prices

November 12, 2019
Flat Rolled Imports by District of Entry and Source Nation, September 2019
Written by Peter Wright
Steel Market Update is pleased to share this Premium content with Executive-level members. For more information on upgrading to a Premium-level subscription, email Info@SteelMarketUpdate.com.
This analysis breaks down the imported tonnage of six flat rolled products into the district of entry and the source nation. We believe that misinformation (or lack of) about local import volumes is often used to influence purchase decisions. Our intent with this analysis is to describe in detail what is going on in a company’s immediate neighborhood and thus provide a negotiating advantage for our premium subscribers.
![]()
Premium members will find reports on our website that break down the import tonnage through September into the port of entry and country of origin in metric tons. Products analyzed in this way are HRC, CRC, HDG sheet, OMC sheet, CTL plate and coiled plate. This data set is large; therefore, we will make no attempt to provide a commentary. Each reader’s interest will be different and he or she simply needs to select one of the six products, then find the nearest port or ports of entry to see how much came into their locality, and from where, each month. Monthly data is provided back to January 2017. It is clear from these detailed reports and from our companion reports by region that the change in tonnage entering a particular district in many (or most) cases is completely different from the change in volume at the national level.
Here are some examples to illustrate why this information can be actionable: In 2018, imports of cold rolled into New Orleans declined by 39 percent from the 2017 volume. In the first nine months of 2019, cold rolled into New Orleans has declined by another 50 percent compared to the same period last year. Houston held its own in 2018 for cold rolled imports, but in 2019 is down by 45 percent. For the nation as a whole, cold rolled imports in 2019 were down by 19 percent through September, but Cleveland was up by 41 percent. Similar situations exist for all six products in this report where changes at the district level differ widely from the national picture. Another example: other metallic coated (OMC) imports into Houston were down by 40 percent year to date, but Philadelphia and Detroit were up by 66 percent and 30 percent, respectively. At the national level, OMC imports were down by 18 percent year to date September.
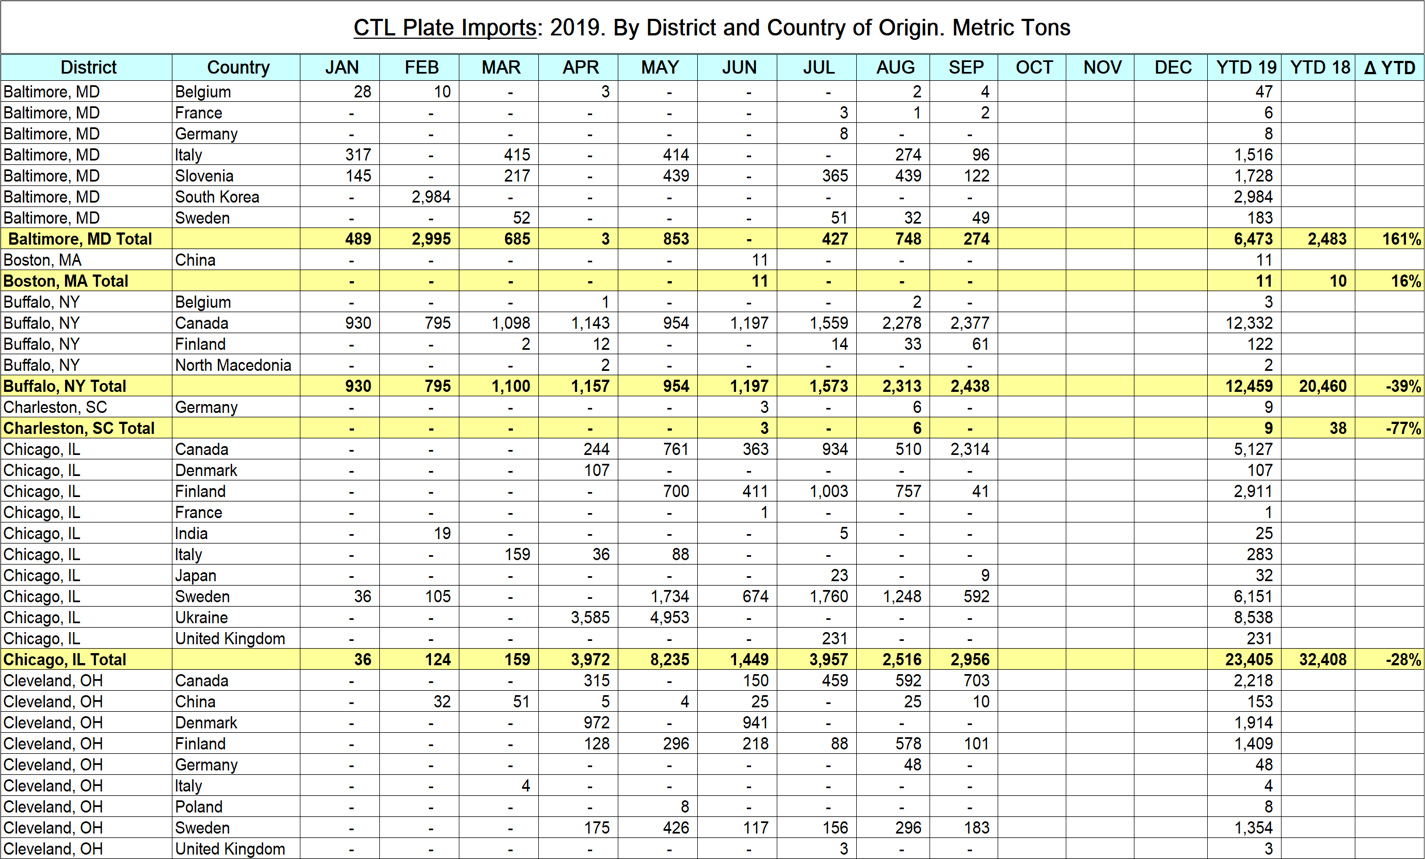
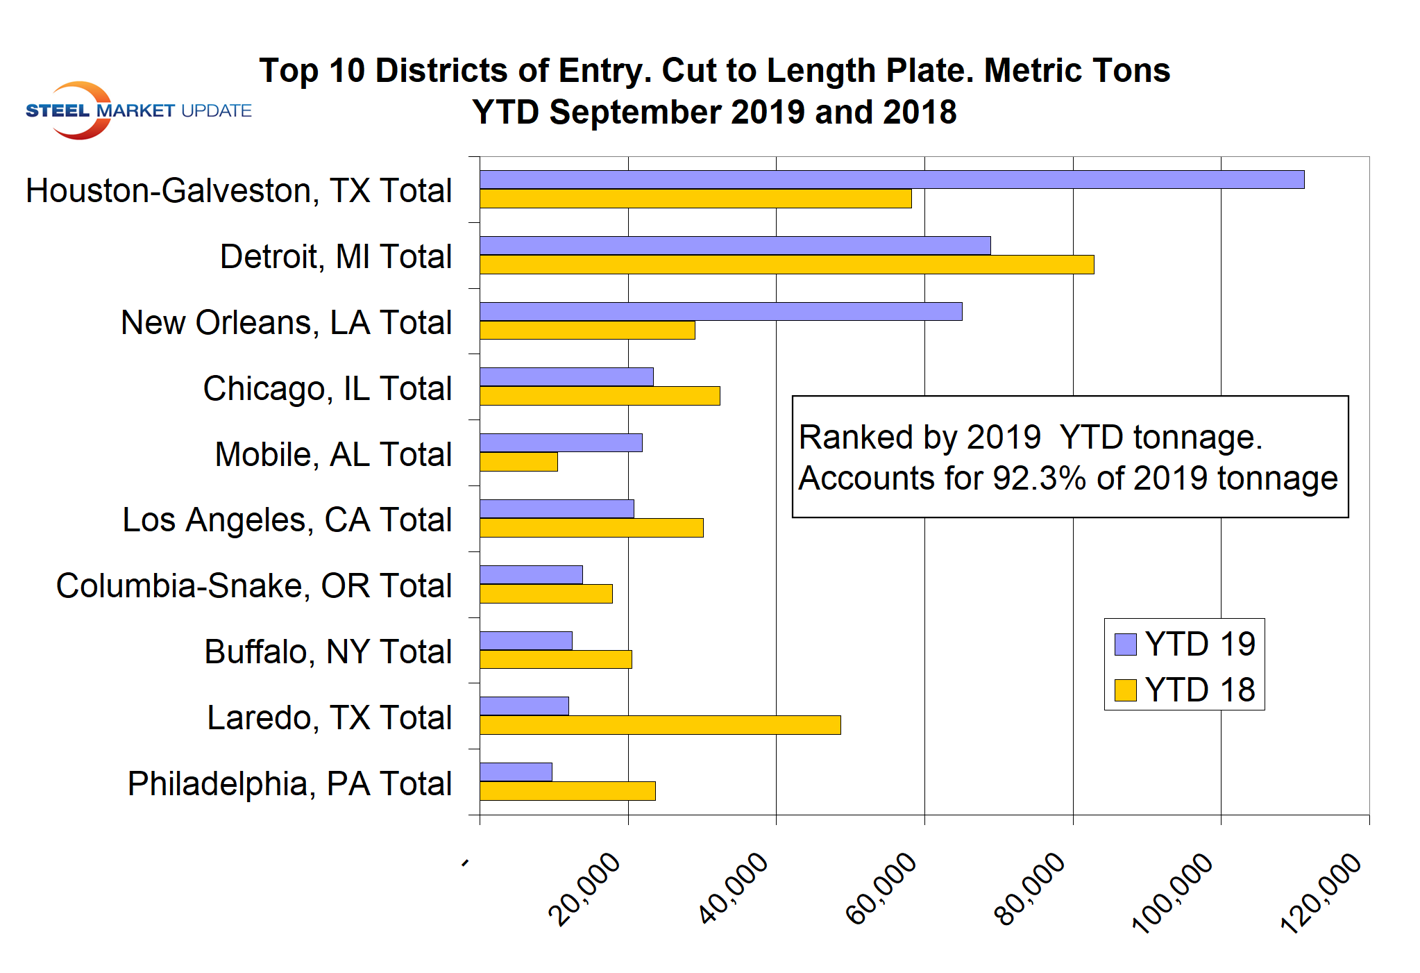
The table included here is a small part of the detailed analysis of the cut-to-length plate tonnage. And the bar graph shows the tonnage of CTL plate that entered the top 10 districts through September year to date for 2018 and 2019 ranked by 2019 tonnage. These 10 districts accounted for 92.3 percent of the total CTL plate tonnage in 2019 through September.
The information in these detailed reports is compiled from tariff and trade data published by the U.S. Department of Commerce and the U.S. International Trade Commission. Our national level import reports are sourced from U.S. Department of Commerce, Enforcement and Compliance, aka the Steel Import Monitoring System. In the development of these reports by district and source country, we have discovered that the SIMA data for HRC and CRC contains some high-alloy steels such as stainless and tool steel, which have been misclassified at the ports. These alloy steels are not included in our detailed reports, which results in a small discrepancy between the two data sets, for CRC in particular and for HRC to a lesser degree.


