

Market Data

November 20, 2019
Currency Update for Steel Trading Nations
Written by Peter Wright
The U.S. dollar has weakened against 11 of the 16 steel trading nation currencies in the last three months.
In this report we examine the change in currency values of the 16 preeminent global steel and iron ore trading nations. The currencies of these 16 don’t necessarily follow the Broad Index value of the U.S, dollar. In fact, at any given time, some are always moving in the opposite direction. The latest value of the Broad Index as published by the Federal Reserve was Nov. 8. In three months prior to that date, the dollar had weakened by 1.3 percent; therefore, in this instance the currencies of the steel trading nations are congruent with the broad index.
![]()
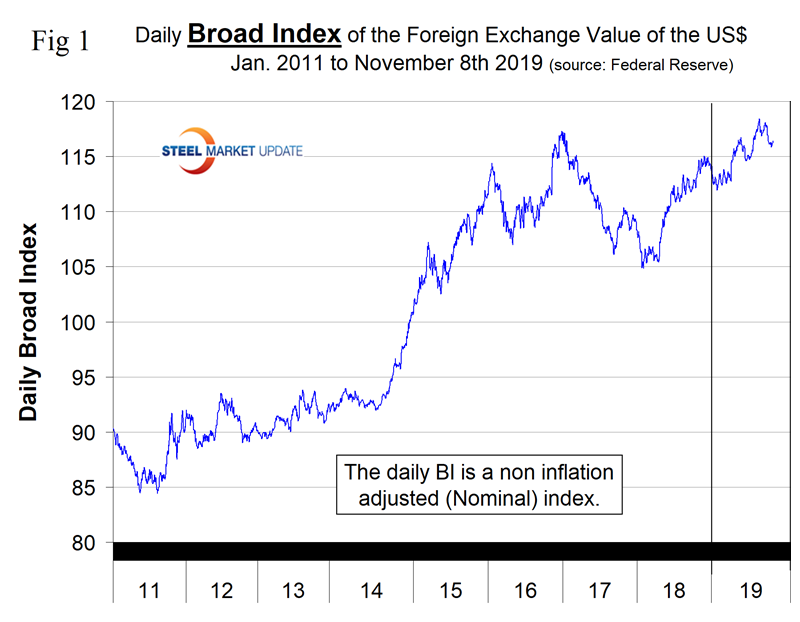
Figure 1 plots the daily Broad Index (BI) value of the U.S. dollar since 2011. The dollar has appreciated erratically in 2019 and on Nov. 8 was up by 2.4 percent year to date.
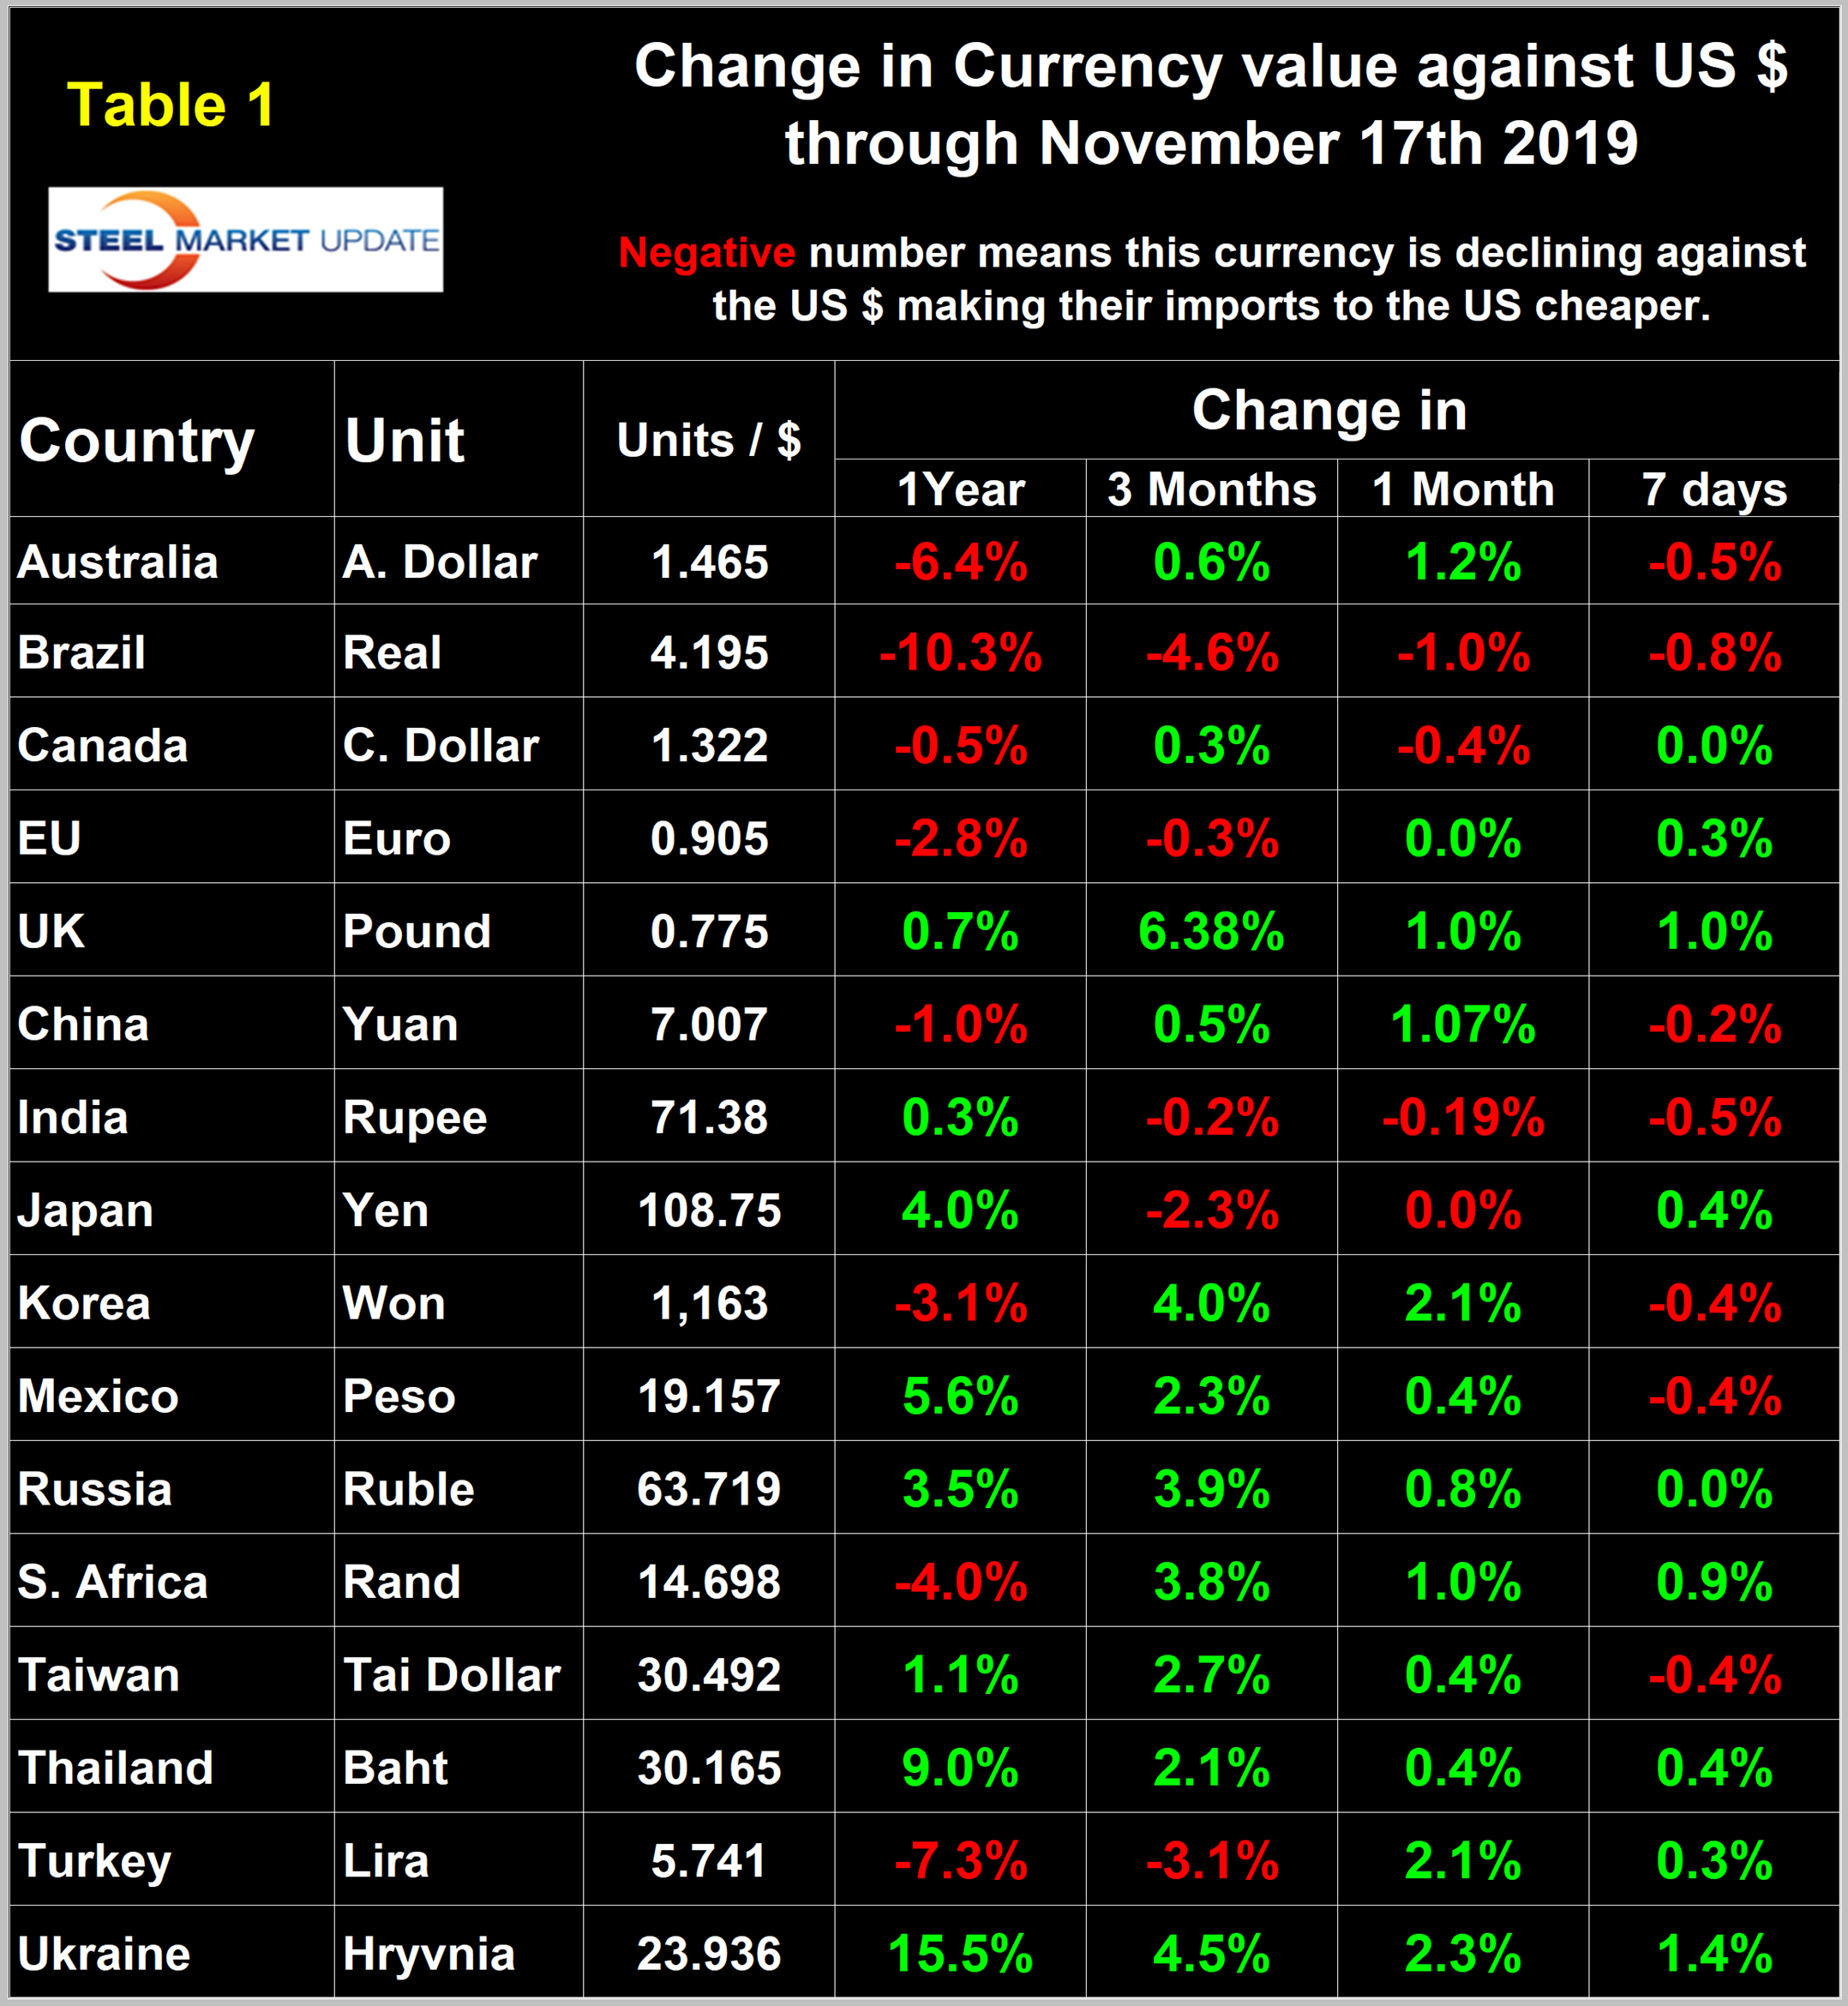
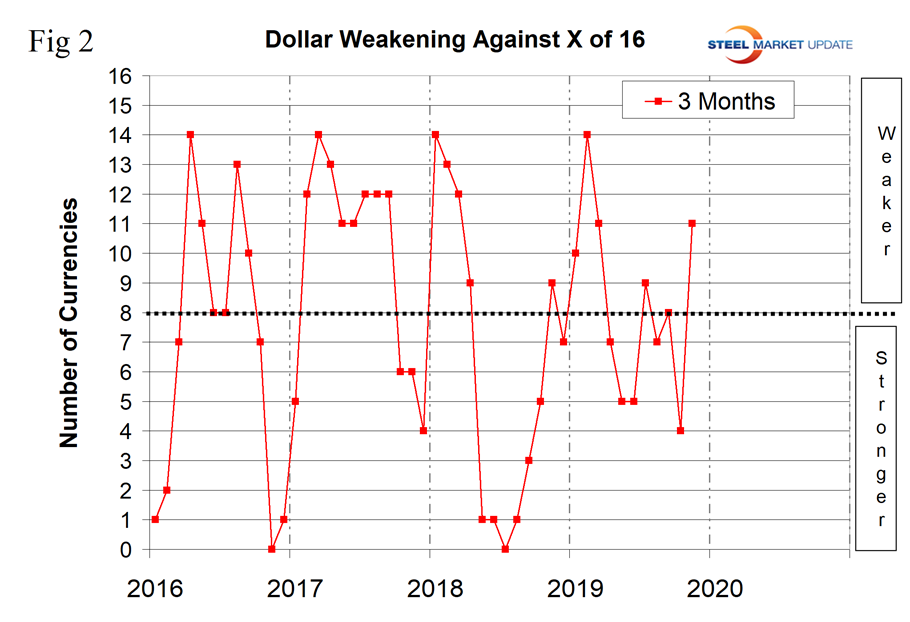
At Steel Market Update, we track the currencies of 16 steel trading nations. Table 1 shows the number of currency units that it takes to buy one U.S. dollar and the percentage change in the last year, three months, one month and seven days. The overall picture for the steel trading nations is that in the last year the U.S. dollar has weakened against 8 of the 16 currencies. In the last three months and one month, the dollar has weakened against 11. Table 1 is color coded to indicate weakening of the dollar in green and strengthening in red. We regard strengthening of the U.S. dollar as negative and weakening as positive because of the effect on net imports. Figure 2 shows the extreme gyrations that have occurred at the three-month level in the last four years.
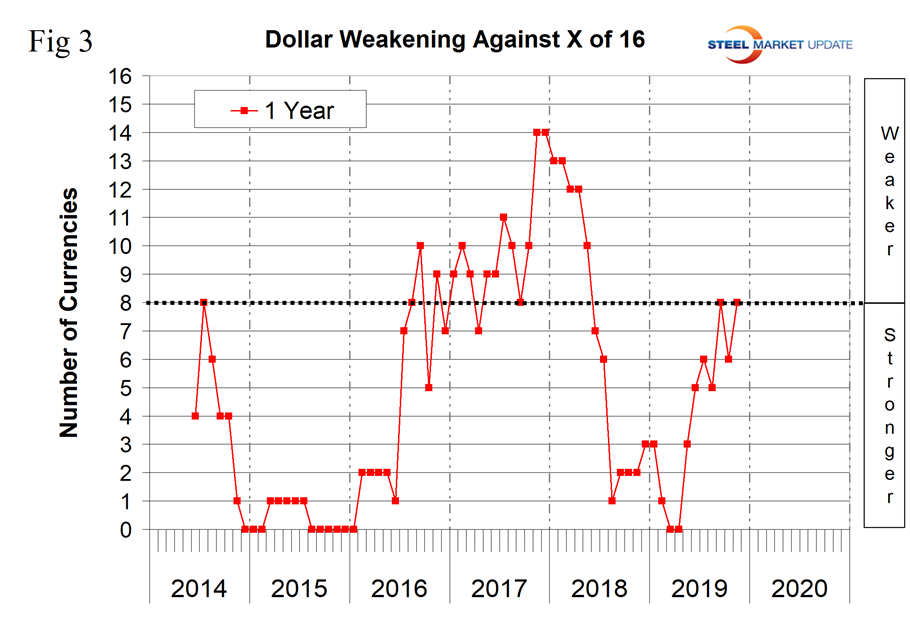
For a less volatile look at the changes in value of the 16 currencies under examination, see Figure 3. This shows the number of currencies against which the dollar was weakening on a year-over-year basis. In March and April, the dollar was strengthening against all 16; by mid-November it was only strengthening against 8.
Big movers in the last three months have been the British pound, up by 6.3 percent, the Turkish lira, down by 3.1 percent, and the Brazilian real, down by 4.6 percent. We present long-term charts of the value of these three currencies against the dollar below together with expert commentary on the Mexican peso and the euro. (See the end of this report for details of data sources.)
The Mexican Peso
Mexico’s peso has traded in a relatively narrow range in the last 18 months. It was up by 5.6 percent in one year, by 2.3 percent in three months and by 0.4 percent in one month (Figure 4).
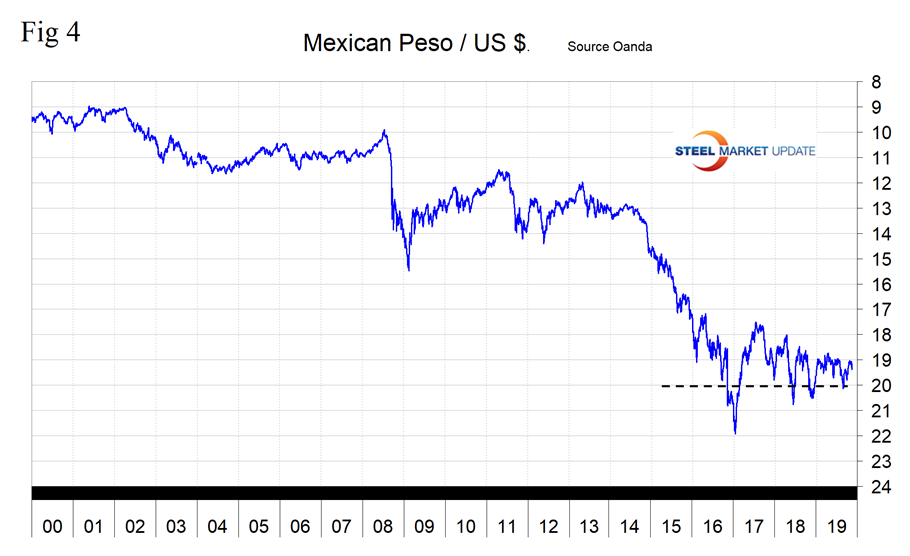
The IMF published its 2019 Article IV Consultation-Press Release and Staff Report on Mexico this month. The summary reads as follows: “The authorities are committed to very strong policies and policy frameworks. However, policy uncertainty and new priorities have created challenges and have clouded the growth outlook. Large-scale investment projects and social transfers—and a commitment to not raise taxes until after 2021—are yet to be reconciled with the administration’s fiscal targets and the objective of putting public debt on a downward path. Meanwhile, drastic budget cuts for some institutions have raised concern about their impact on human capital. A state-centered energy policy that limits the role of the private sector—putting the onus of stabilizing Pemex (the state-owned oil and gas company) squarely on the government—has imposed further pressure on the budget and has weakened prospects for oil production. Promises to tackle some of Mexico’s salient structural challenges—including corruption, informality and crime—have yet to be followed by concrete policy action.”
The Euro
The euro has declined by 0.3 percent in the last month and is down by 2.8 percent year over year (Figure 5).
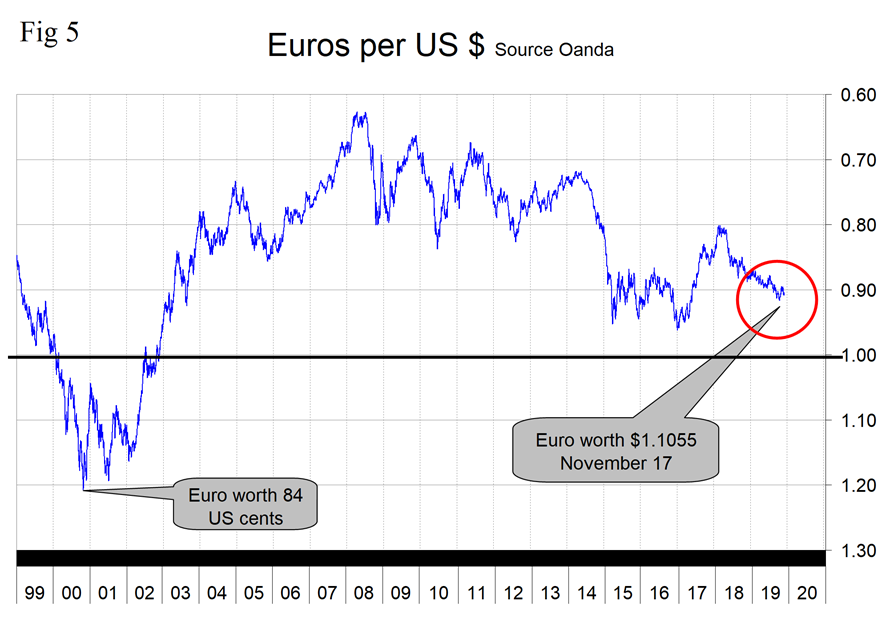
On Oct. 31, Discount Fountain published the following: “As we can see, the EUR/USD saw gains for October before recently taking a breather to reach a level of 1.1086 at the time of writing. That said, I wish to revise my prior assertions upon which I forecasted that the euro would go higher from here—and ultimately argue that the euro is likely to have trouble breaking above the current level. Specifically, my prior argument was that, with Christine Lagarde set to take over from Mario Draghi as ECB chief on Nov. 1, the euro could start rising significantly. This is because Lagarde could potentially take a different approach from Draghi’s choice of continued easing—which has been at odds with many central bankers in Frankfurt—and the euro could gain ground as a result. However, I admit in hindsight that this view may have been misinformed. For one, the round of monetary stimulus that has been triggered is said to mean that interest rates are not set to rise until 2022 at the earliest. In this regard, Lagarde’s hands may proverbially be tied as a result of this policy—and markets will continue to see the euro as a less attractive choice, given 0% interest rates.”
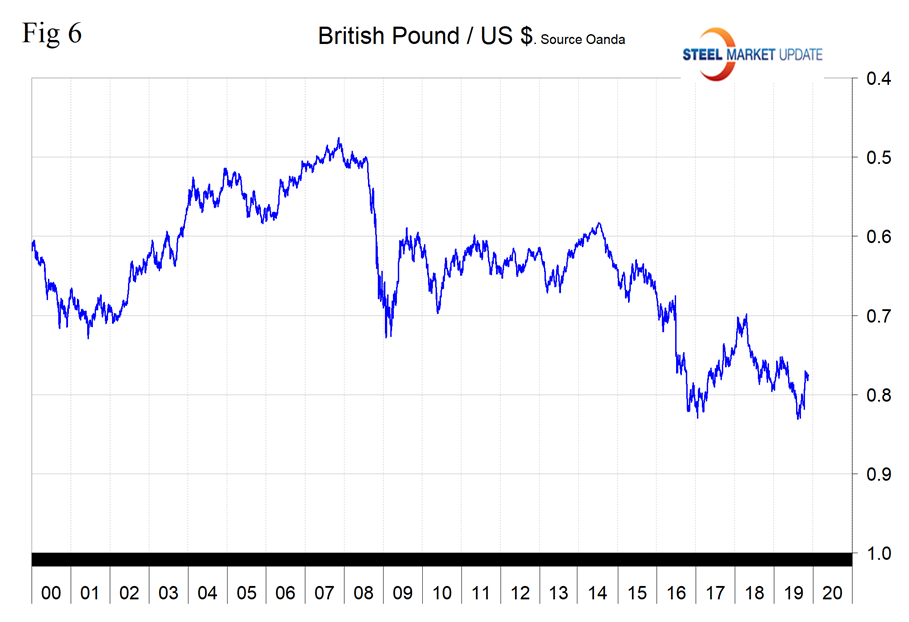
The British Pound
In the last three months, the pound has appreciated by 6.4 percent against the dollar and was up by 1.0 percent in the last month (Figure 6.)
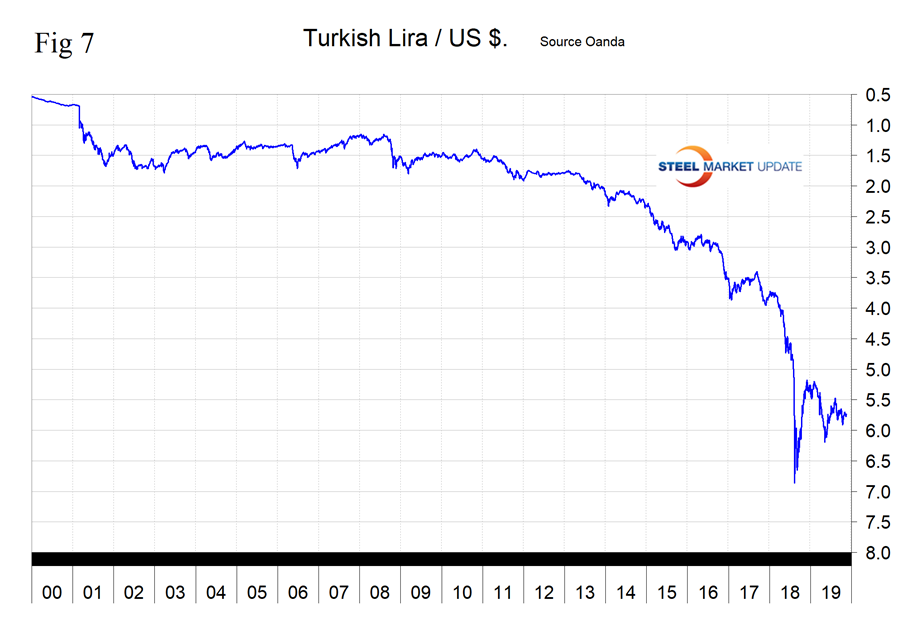
The Turkish Lira
In the last three months, the lira has depreciated by 3.1 percent against the dollar and on Nov. 17 and was down by 7.3 percent year over year (Figure 7).
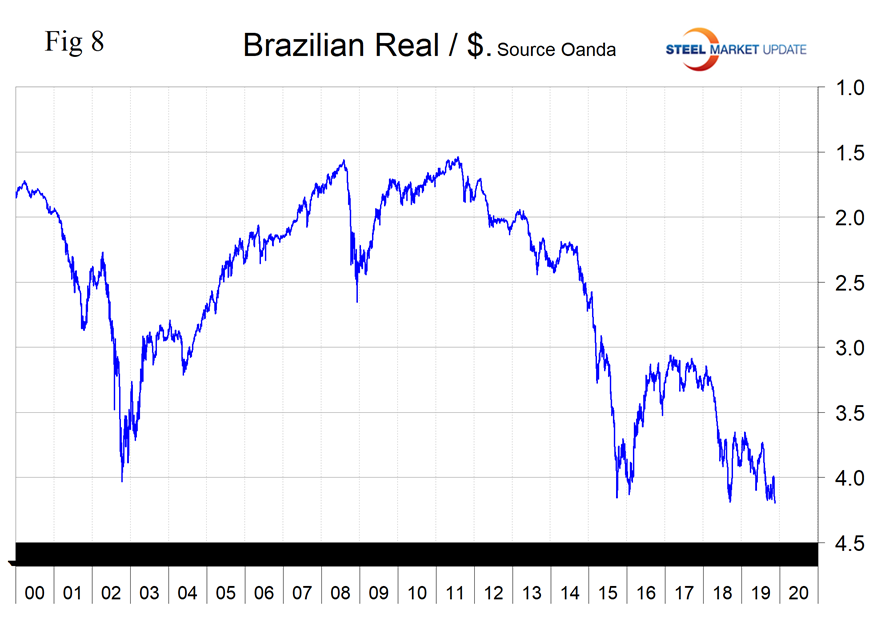
The Brazilian Real
In the last three months, the real has declined by 4.6 percent against the dollar and is down by 10.3 percent year over year (Figure 8).
In this monthly analysis, we show the trends we think have the most immediate significance, but all 16 steel trading nation graphs are available on request.
Explanation of Data Sources: The Broad Index is published by the Federal Reserve on both a daily and monthly basis. It is a weighted average of the foreign exchange values of the U.S. dollar against the currencies of a large group of major U.S. trading partners. The index weights, which change over time, are derived from U.S. export shares and from U.S. and foreign import shares. The data are noon buying rates in New York for cable transfers payable in the listed currencies. At SMU we use the historical exchange rates published in the Oanda Forex trading platform to track the currency value of the U.S. dollar against that of 16 steel trading nations. Oanda operates within the guidelines of six major regulatory authorities around the world and provides access to over 70 currency pairs. Approximately $4 trillion U.S. dollars are traded every day on foreign exchange markets.


