Market Data

November 26, 2019
Service Center Spot Prices Gaining Traction?
Written by John Packard
Last week Steel Market Update conducted our mid-November flat rolled and plate steel market analysis. We invited 480 individuals involved in manufacturing, service centers, steel mills, trading companies and toll processors to participate in our questionnaire. On purpose, the survey is heavily weighted to manufacturing companies and service centers since they purchase the vast majority of the flat rolled and plate steels consumed in North America. In this case, 46 percent of the respondents were service centers/wholesalers and 39 percent were manufacturing companies. The balance consisted of trading companies (7 percent), steel mills (5 percent) and toll processors (3 percent).
Last week’s survey had mixed results when we asked manufacturing companies and service centers to comment on their view of spot pricing out of the distributors.
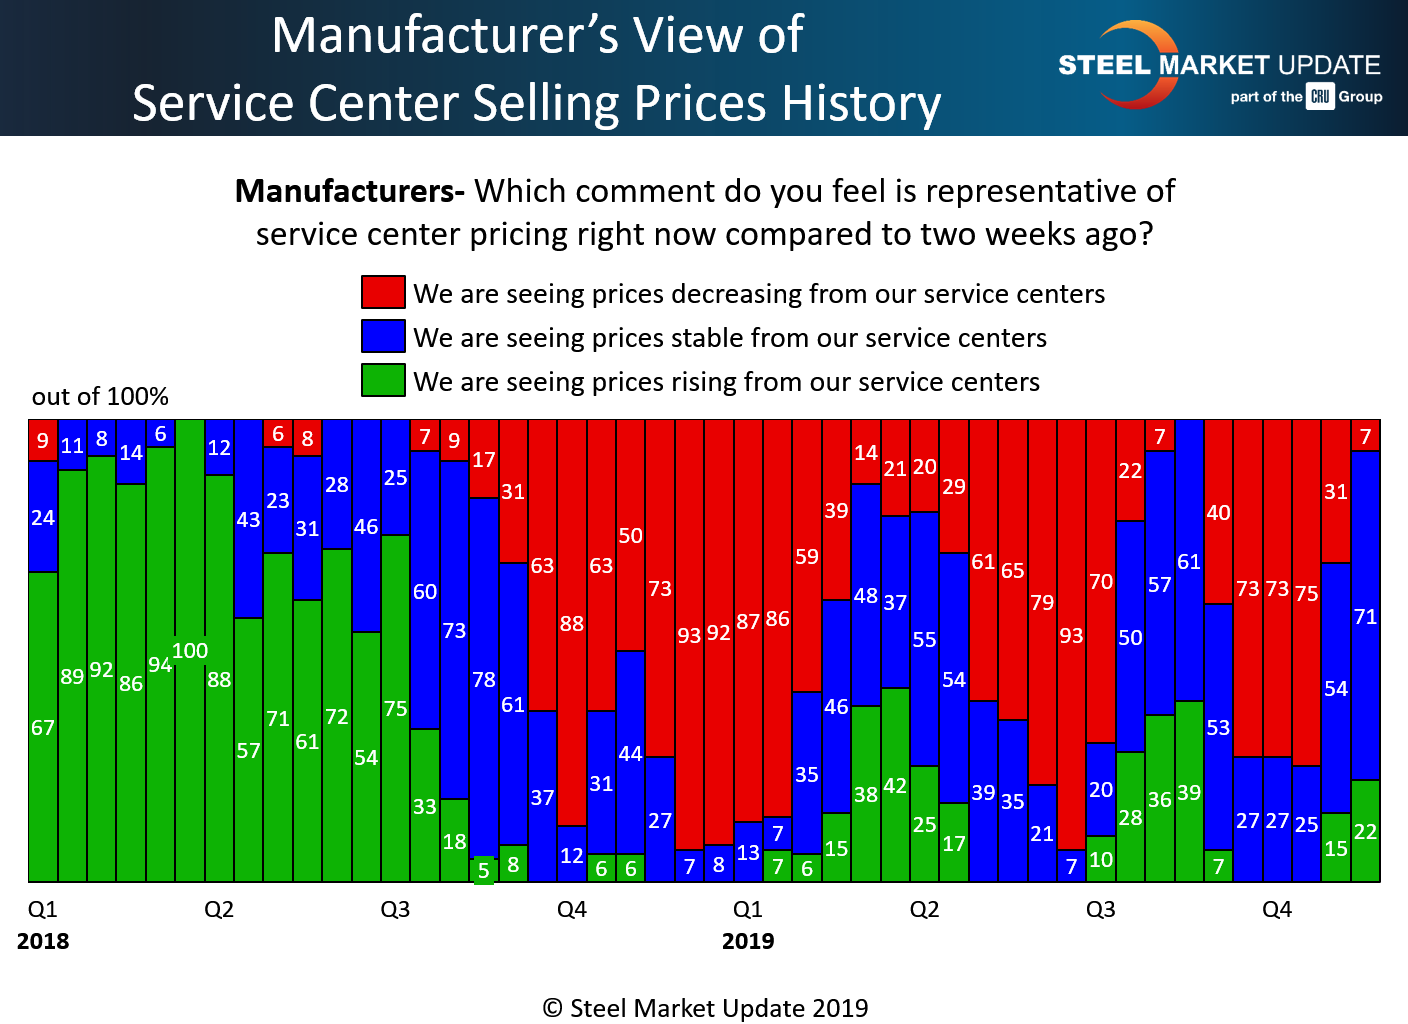
Only 22 percent of the manufacturing companies responding to that question reported rising prices from their service center suppliers. This is 7 percent higher than what was reported at the beginning of November (and shortly after the initial price increase announcements by the domestic steel mills).
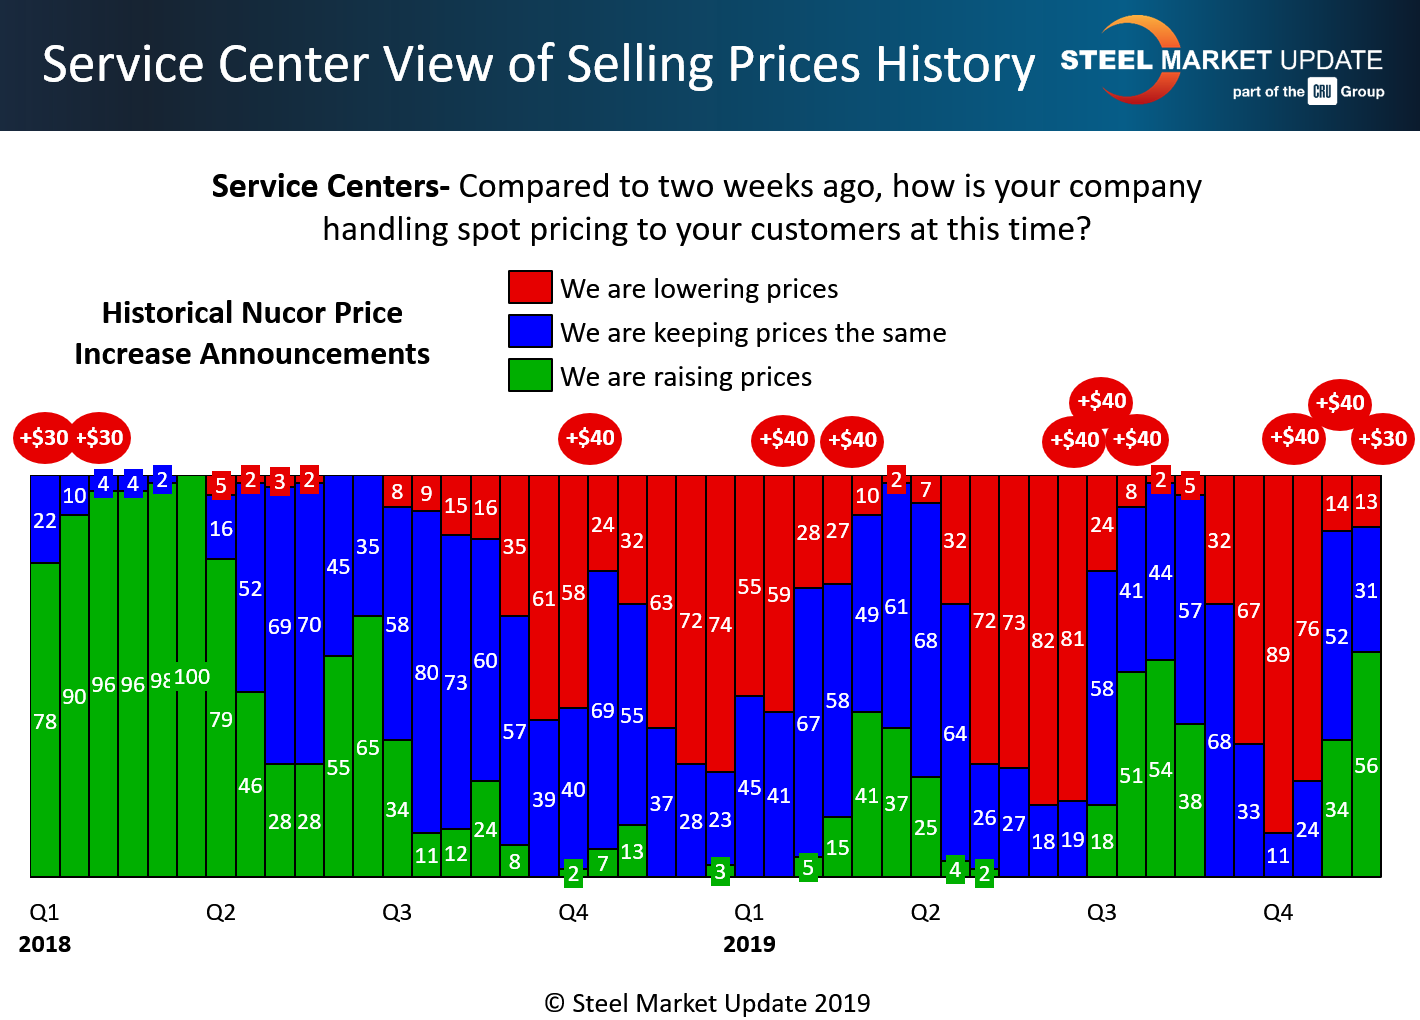
On the other hand, 56 percent of the service centers reported their company as raising spot prices to their end customers. This represents a 22 point jump compared to what was reported by the distributors responding to our survey at the beginning of November.
As you can see by the graphic below, the percentage of those reporting rising spot prices is somewhat in line with what we saw at the beginning of third-quarter 2019. Whether this up cycle is a dead cat or something else will be determined over the next 30-45 days.