

Market Data

December 17, 2019
Mills Have Service Centers to Thank for Higher Spot Prices
Written by Tim Triplett
Whether mills succeed in raising spot prices depends in large part on the support they receive from distributors. The latest Steel Market Update data from service centers, verified by data from their customers, indicates that steel prices have maintained their upward trajectory into the new year and show no signs of slowing.
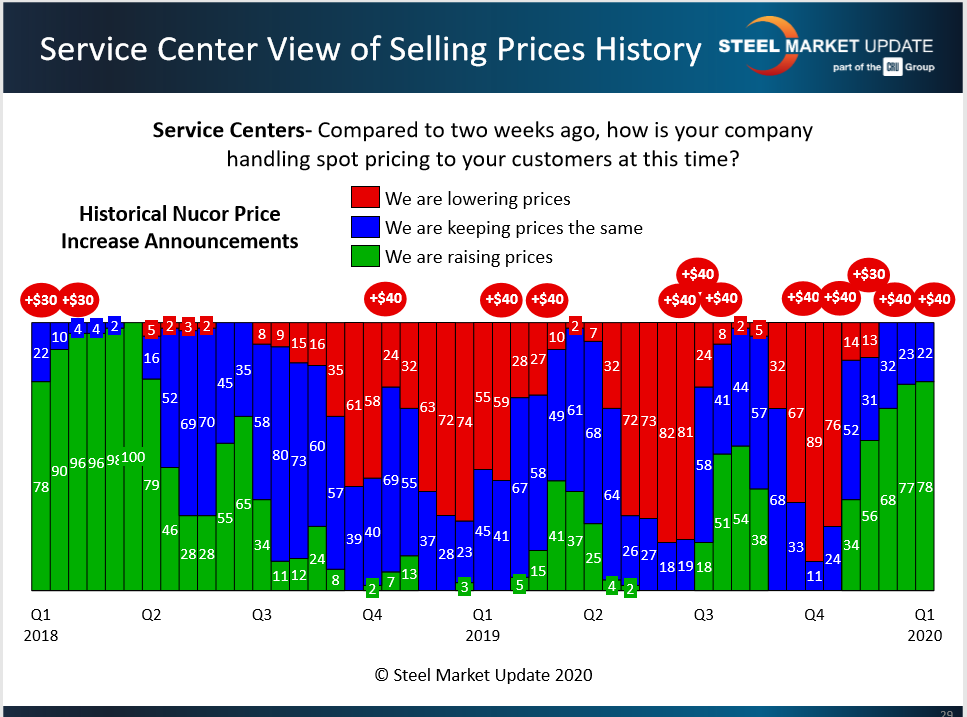
As indicated by the green bars in the charts below, service centers have been raising spot prices to their customers since November. Seventy-eight percent of the service center executives responding to SMU’s questionnaire last week reported they are still raising prices. The other 22 percent said they are keeping prices the same. None said they are yet lowering spot prices.
Considering prices from the manufacturer’s point of view confirms the trend. Sixty-four percent of the OEMs and fabricators responding to SMU’s survey Jan. 6 said they were still seeing higher prices from their service center suppliers. None reported a price decrease.
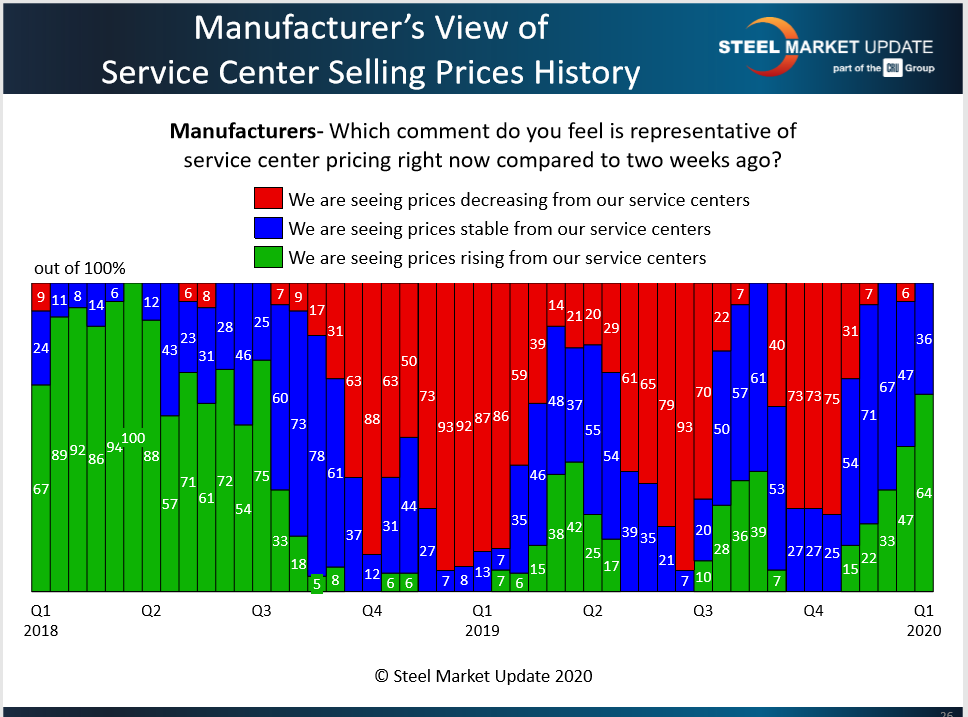
Looking at the charts, the red bars at the beginning of Q4, at 75 percent or more, clearly show the point of capitulation—the point at which steel prices had gotten so low that service centers were more concerned about their inventories than their sales.
The benchmark price for hot rolled steel plummeted by nearly 50 percent from a peak of $915 per ton in July 2018 to a low of $470 a ton in October 2019, with disastrous effect on inventory values and profit margins. To reverse the decline, flat rolled steel producers have raised prices by $30-40 per ton on five occasions in the past two and a half months, for a total of $190 per ton ($9.50/cwt). The current average price for hot rolled is around $610 per ton, suggesting that the mills have managed to collect nearly $140 of the total.
The mills raised flat rolled prices for the fifth time last week, by $40 per ton, in an effort to maintain their momentum. So far, it appears their strategy is paying off.


