

Market Data

December 21, 2019
GDP Report: U.S. Economy Grew at 2.1 Percent Rate in Q3
Written by Peter Wright
Steel Market Update is pleased to share this Premium content with Executive-level subscribers. For more information on how to upgrade to a Premium-level subscription, email Info@SteelMarketUpdate.com.
The U.S. economy continued to grow in 2019, but at a slower rate as the year progressed. The third estimate of U.S. GDP growth in Q3 2019 was 2.1 percent, down from 3.1 percent in the first quarter.
![]()
On Dec. 19 the Bureau of Economic Analysis (BEA) released the third estimate of GDP growth in the third quarter of 2019 stating: “Real gross domestic product increased at an annual rate of 2.1 percent in the third quarter of 2019, according to the ‘third’ estimate. In the second quarter, real GDP increased 2.0 percent. The GDP estimate released today is based on more complete source data than were available for the ‘second’ estimate issued last month. In the second estimate, the increase in real GDP was also 2.1 percent. With the third estimate for the third quarter, upward revisions to personal consumption expenditures and nonresidential fixed investment were offset by a downward revision to private inventory.”
GDP is now measured and reported in chained 2012 dollars, and on an annualized basis in the third quarter totaled $19.121 trillion. The growth calculation is misleading because it takes the quarter-over-quarter change and multiplies by four to get an annualized rate. This makes the high quarters higher and the low quarters lower. Figure 1 clearly shows this effect. The blue line is the trailing 12-months growth and the black line is the headline quarterly result. On a trailing 12-month basis, GDP was up by 2.44 percent in the third quarter, which was down from 3.20 percent in the first quarter. To put that result into perspective, the average in 39 quarters since Q1 2010 has been 2.35 percent. The blue line in Figure 1 shows the progress of the trailing 12-month result since the first quarter of 1990.
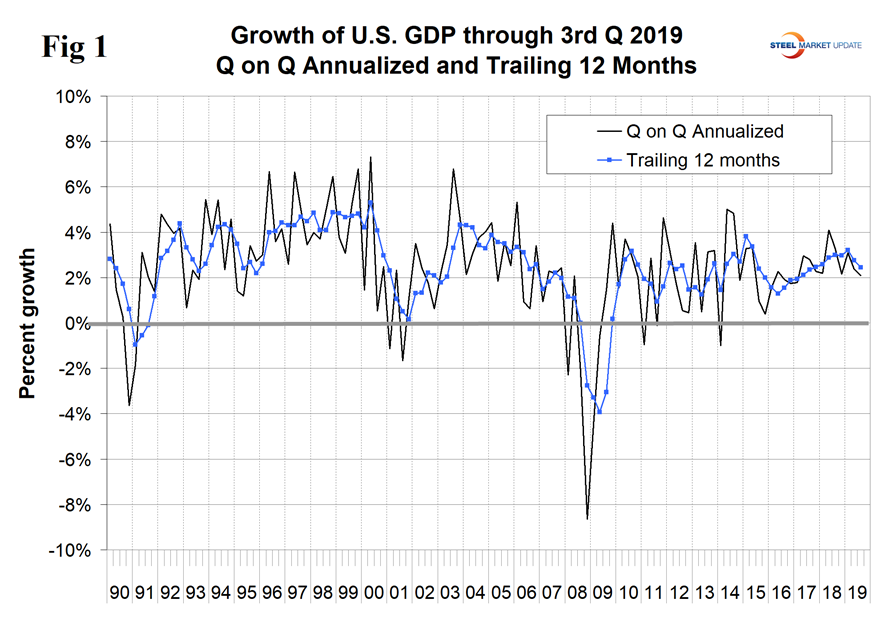
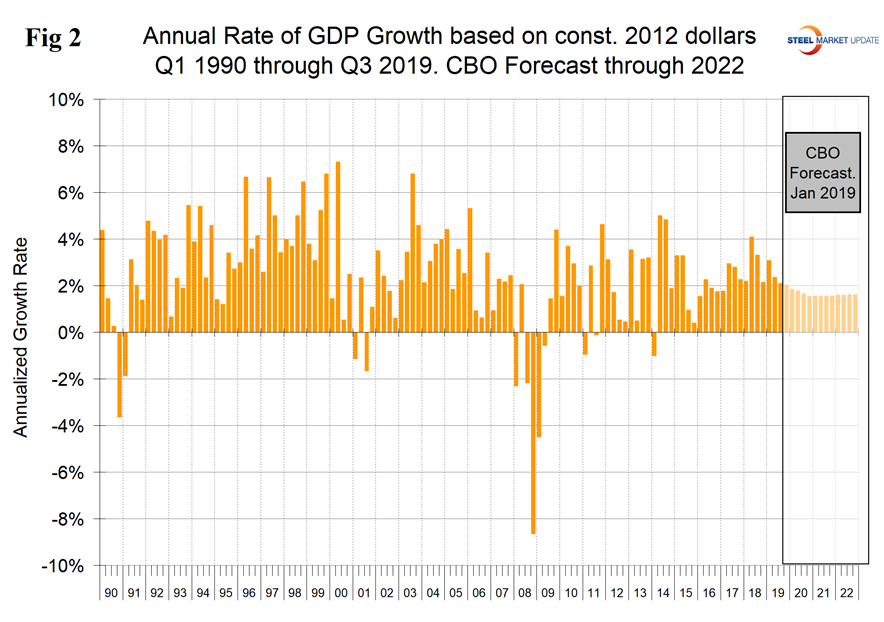
Figure 2 shows the headline quarterly results since 1990 and the January 2019 Congressional Budget Office forecast through 2022. The CBO underestimated the growth rate in the first quarter of 2019, but was correct for the second and third quarters and expects the boost from the tax break to continue to decline in the fourth quarter of 2019.
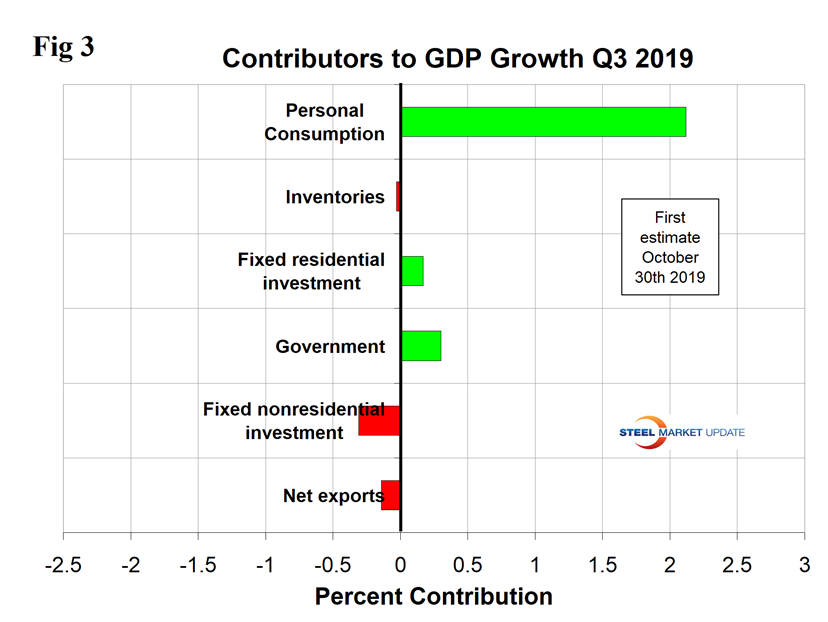
The mix of the six major contributory components in the final GDP growth calculation is shown in Figure 3. Normally, personal consumption is the dominant growth driver and this was the case in the third quarter when this contribution was 2.12 percent. Personal consumption includes goods and services, the goods portion of which includes both durable and non-durables. Fixed nonresidential investment and net exports detracted from the overall result. The effect of inventories is always a wild card in the GDP calculation, but in the third quarter had almost no effect. Declining inventories are entered as a negative in the GDP calculation. Note that in the definitions at the end of this piece, inventories are not mentioned. Over the long run, inventory changes are a wash and simply move the reported growth from one period to another.
On Dec. 20, Economy.com wrote: “U.S. GDP growth has slowed. Growth remained sluggish in the third quarter, according to the third report from the BEA. Real GDP grew 2.1 percent, after growing 2 percent in the second quarter. Consumer spending remained a growth leader despite posting much slower growth than in the second quarter. Inventory investment made no contribution to growth and the drag from trade shrank from the second quarter, but the government contribution declined as well. Real disposable income growth improved to 2.9 percent from 1.5 percent. The saving rate held steady at 7.8 percent. Profits decreased 0.2 percent (not annualized), after rising 3.2 percent previously, a minor downward revision. Gross domestic income rose 2.1 percent (previously 2.4 percent) after rising 0.9 percent in the second quarter.”
Figure 4 shows the contributions of residential and nonresidential investment. After the recession, nonresidential investment bounced back, but residential did not, and has had less than a 1 percent variation since the third quarter of 2010. In the third estimate for the third quarter, nonresidential investment made a negative 0.31 percent contribution. The contribution of government expenditures was 0.30 percent in the third quarter, down from 0.82 percent in the second quarter.
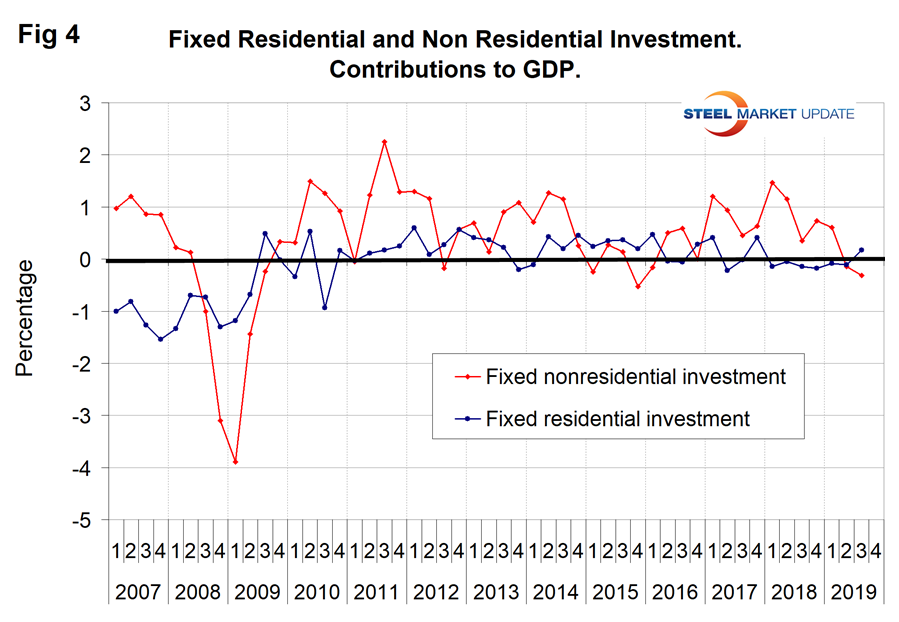
Figure 5 shows the quarterly contributors of the six major subcomponents of GDP since Q1 2007. This chart clearly shows the whipsaw effect of inventory changes, which are coded pale blue. It also shows the unusually low contribution of personal consumption expenditures in the first quarter of 2019.
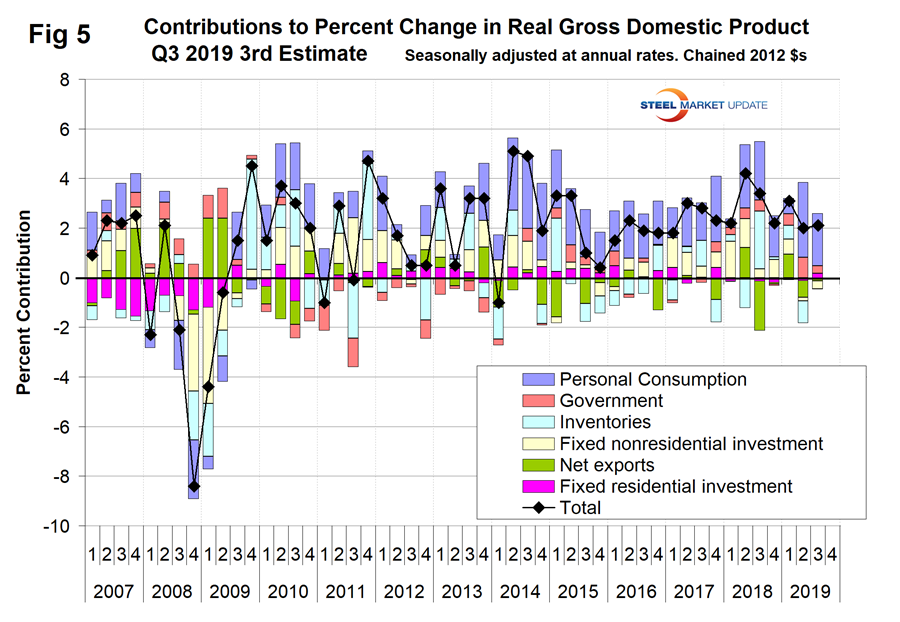
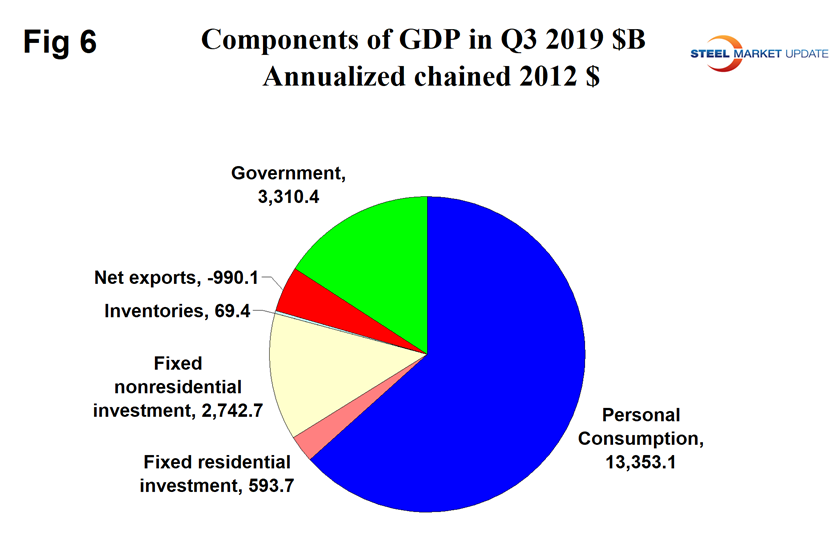
Figure 6 shows the breakdown of the $19.121 trillion economy.
SMU Comment: Personal consumption expenditures bounced back in the second and third quarters from an unusually low result in the first. The trailing 12-month growth rate, which we think is the best way to look at this data, declined from 3.2 percent in Q1 to 2.76 percent in Q2 to 2.44 percent in Q3.
GDP is defined as Consumption (C) plus Investment (I) plus Government Spending (G) plus [Exports (E) minus Imports (I)] or: GDP = C + I + G + (E-I)
This equation is known as an identity. An identity is an equality that remains true regardless of the values of any variables that appear within it. That means it is not a guess or an approximation. It is simple reality.
Another definition of GDP states that it equals the growth in working population multiplied by their productivity.


