

Market Data
January 20, 2020
SMU Energy Analysis for January
Written by Peter Wright
Steel Market Update is pleased to share this Premium content with Executive-level members. For more information on how to upgrade to a Premium-level subscription, email Info@SteelMarketUpdate.com.
Crude oil production set another all-time record in the U.S. in October, but the rig count continues to decline.
On Jan. 3, oil prices surged briefly on news of the U.S. killing of Iran’s top general Qasem Soleimani. On Jan. 18, The Economist commented: “Oil markets, however, were unbothered. After a brief jump to over $70 per barrel, Brent crude fell to $64 on Jan. 13, lower than before Soleimani’s death. On Jan. 14, oil traders were preoccupied not with future violence but by crude inventories and news of a trade deal between the U.S. and China.”
![]()
The spot price of West Texas Intermediate (WTI) FOB Cushing, Okla., was $58.17 per barrel on Jan. 14. The total number of operating rigs exploring for oil has declined by 287, or 27.0 percent, since the end of 2018. The prices of oil and natural gas drive the consumption of energy-related steel products including oil country tubular goods, pipe fittings and well head equipment, among others. Welded tubular goods (not including OCTG) consumed about 5.5 million tons of hot rolled sheet in 2018.
Figure 1 shows historical oil and gas prices on a mid-month basis from January 2000 through Jan. 13, 2019. Our price and inventory data come from the EIA (Energy Information Administration). On Jan. 10, natural gas at the Henry Hub in Oklahoma was priced at $2.10 per MMBtu (million British Thermal Units), down from $2.81 on Nov. 8. Natural gas is priced to continue making inroads against coal as an electric power generator, which is the primary consumer of natural gas in the United States.
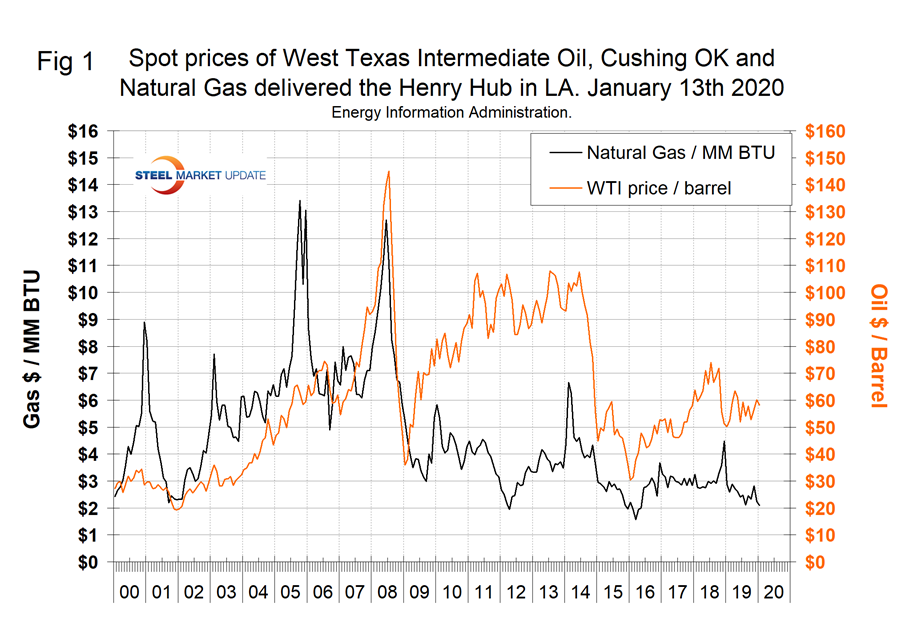
The EIA short-term energy forecast of Jan. 14 stated: “Brent crude oil spot prices will average $65 per barrel (b) in 2020 and $68/b in 2021, compared with an average of $64/b in 2019. EIA expects West Texas Intermediate (WTI) crude oil prices will average about $5.50/b lower than Brent prices through 2020 and 2021, compared with an average WTI discount of about $7.35/b in 2019. EIA estimates that U.S. crude oil production averaged 12.2 million b/d in 2019, up 1.3 million b/d from 2018. EIA forecasts U.S. crude oil production will average 13.3 million b/d in 2020 and 13.7 million b/d in 2021. Most of the production growth in the forecast occurs in the Permian region of Texas and New Mexico. U.S. net imports of crude oil and petroleum product fell from an average of 2.3 million b/d in 2018 to an average of 0.5 million b/d in 2019, and EIA estimates the United States has exported more total crude oil and petroleum products than it has imported since September. EIA forecasts that the United States will be a net exporter of total crude oil and petroleum products by 0.8 million b/d in 2020 and by 1.4 million b/d in 2021.”
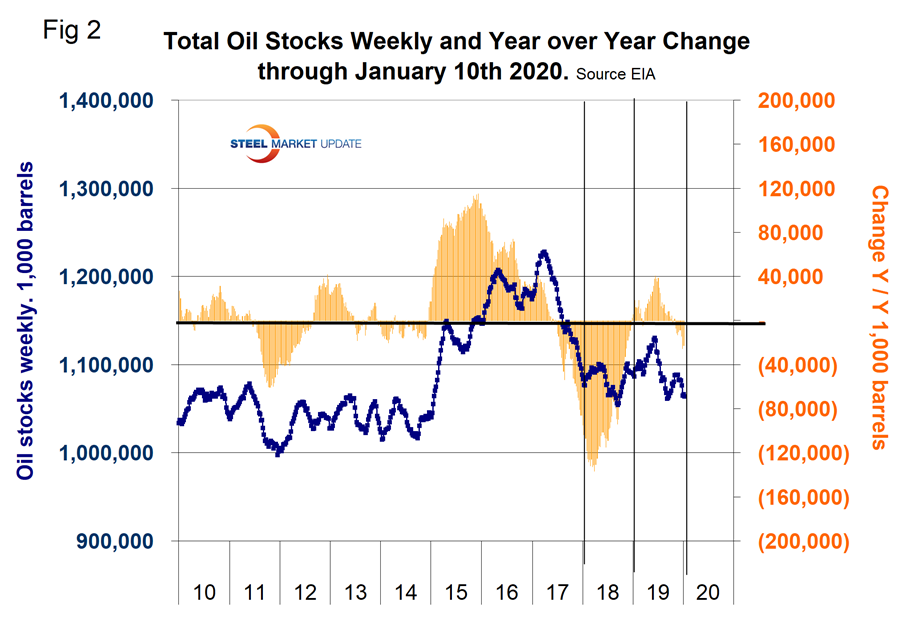
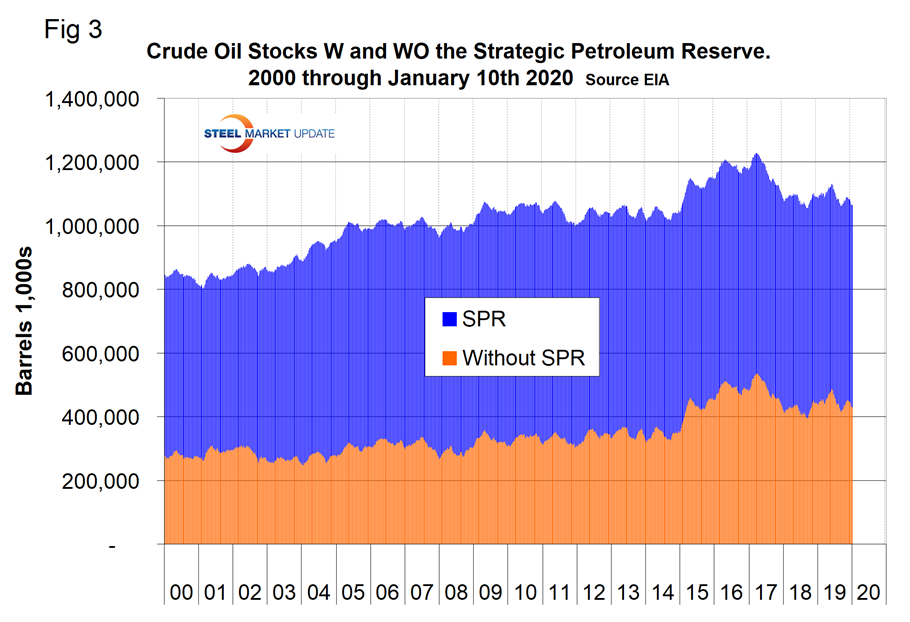
On Jan. 10, the EIA reported that U.S. commercial crude oil inventories (excluding those in the Strategic Petroleum Reserve) decreased by 23.4 million barrels since the end of November, which was an almost exact giveback of the gain in October and November. Including the SPR, total inventory on Jan. 10 was 1.06 billion barrels. Figure 2 shows the inventory level, including the strategic petroleum reserve and the year-over-year change. Figure 3 breaks total crude inventory into the working portion and the strategic reserve.
On Jan. 18, Todd Sullivan, a hedge fund manager, wrote: “The multi-year trends are higher U.S. Crude Production and lower Crude Imports with the U.S. being a Net Exporter of Crude Oil at the end of 2019. U.S. has been developing a Refined Product Export business since 2003, which has grown ~13 percent annually. The U.S. became a net exporter in Refined Products in 2011. The history from 2003 includes the speculative “Peak Oil” 2010-2014 period representing WTI over $100/BBL only to plunge below $30/BBL on strength in the U.S. (U.S. dollar) resulting in many believing excess production now represented an “Oil Glut.”
He continued: “Looking separately at U.S. Inventory and Days of Refinery Inputs as the U.S. has evolved into a global supplier provides interesting details. U.S. Crude Inventories have grown 3.3 percent annually since 2003. Refined Products Exports have grown ~13 percent. Efficiencies and substitutes in the U.S. have resulted in U.S. consumption being virtually flat. Coupled with improved reliability of transportation and a surge in domestic production, inventories have not needed to grow at the same pace. Days of Inventory for Refining Input have grown far less at 1.9 percent annually.”
The total number of operating rigs in the U.S. on Jan. 17 was 796, down by 287 since the last week of 2018 or 27.0 percent. Oil rigs were down by 212 and gas by 78. Figure 4 shows the total number of operating rigs in the U.S. and the weekly change.
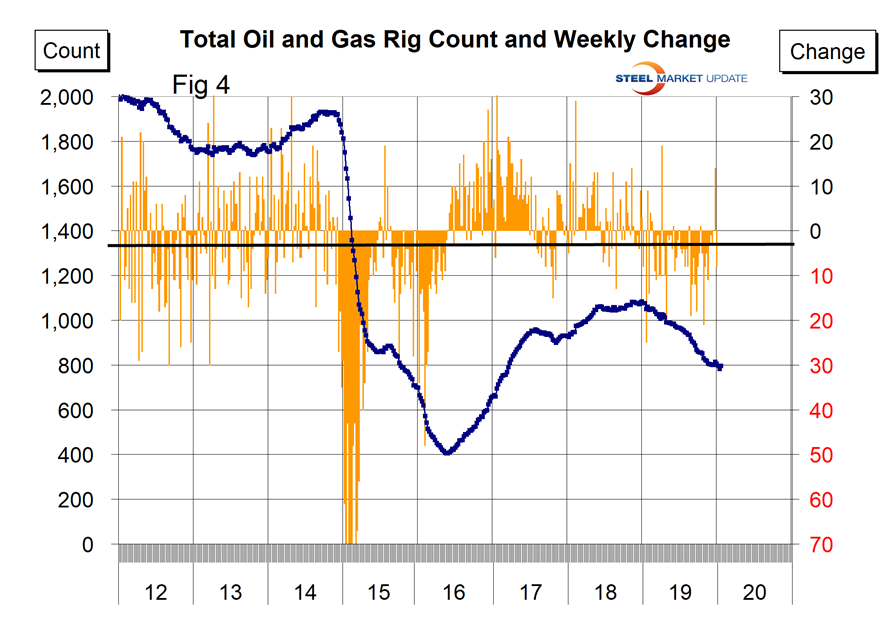
The oil rig count had a low point of 316 on June 27, 2016, and stood at 673 on Jan. 17, 2020.
The U.S. gas rig count rose from its low point of 81 on Aug. 5, 2016, to 202 on Jan. 11, 2019, before falling back to 120 on Jan. 17, 2020. The year-over-year growth rate of total U.S. operating rigs was negative 24.2 percent in the latest data with oil down by 21.0 percent and gas down by 39.4 percent. Figure 5 shows the Baker Hughes U.S. Rotary Rig Counts for oil and gas equipment in the U.S. (explanation below).
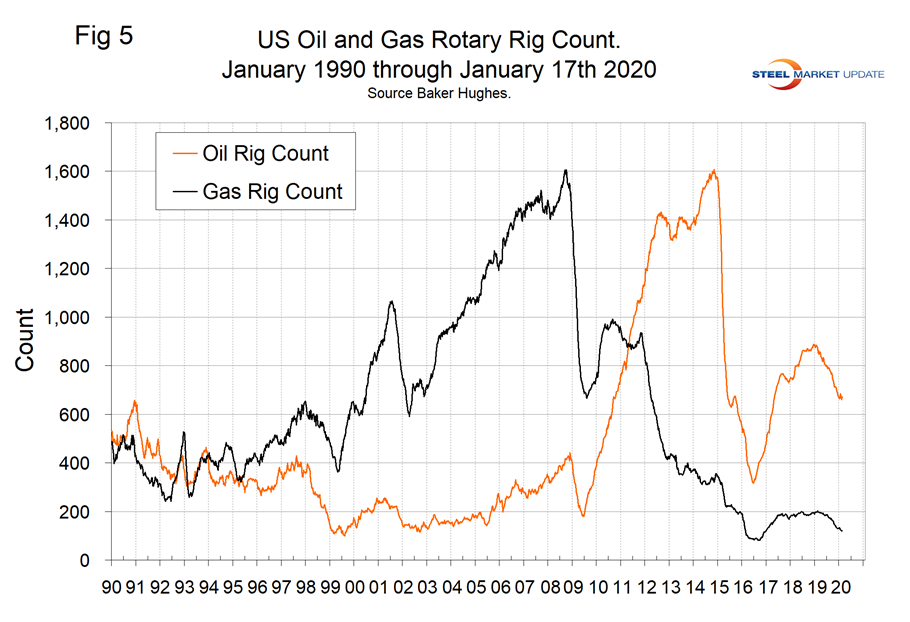
On a regional basis in the U.S., the big three states for operating rigs are Texas, Oklahoma and North Dakota. Figure 6 shows the land rig count in those states since 2000.
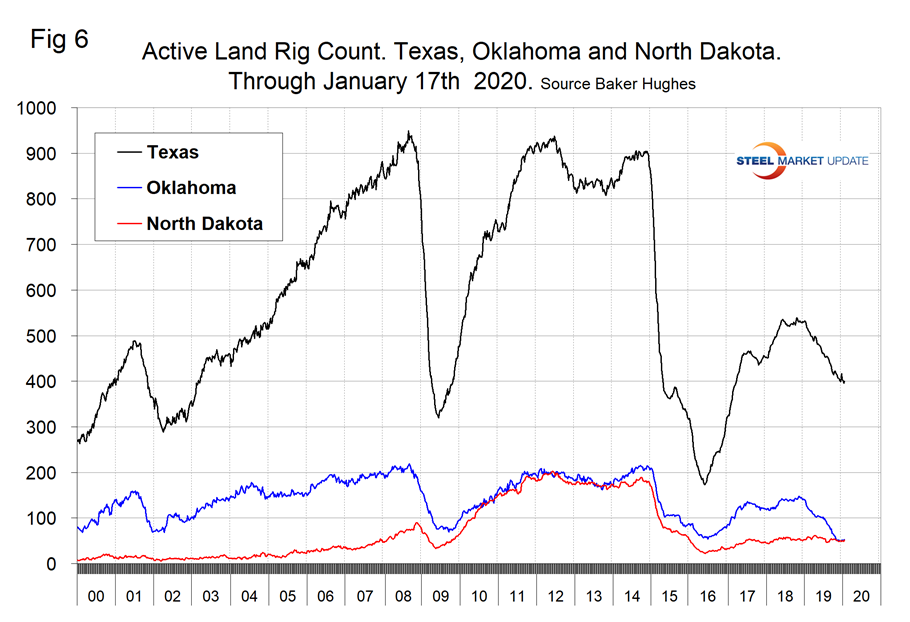
Figure 7 illustrates the monthly U.S. oilfield production of crude from January 1970 through October 2019 (latest data available) in thousands of barrels per month. The historical high was October 1970 at 310.4 million barrels. Production steadily declined to half that level in the late 2000s before the fracking revolution. December 2017 broke the record that had stood for 47 years with 311.2 million barrels produced. October 2019 set another record of 392.3 million barrels, up from 374.5 million in September.
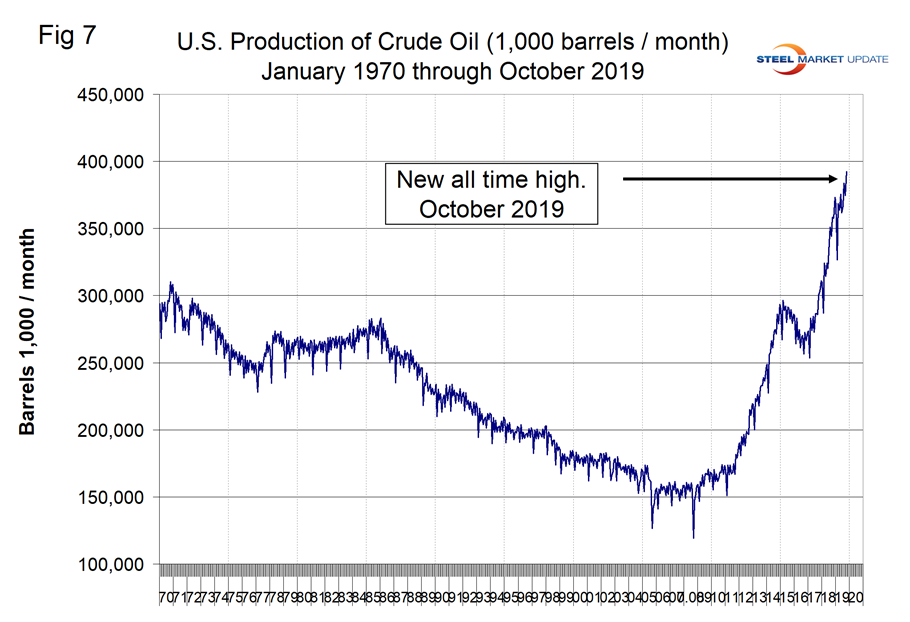
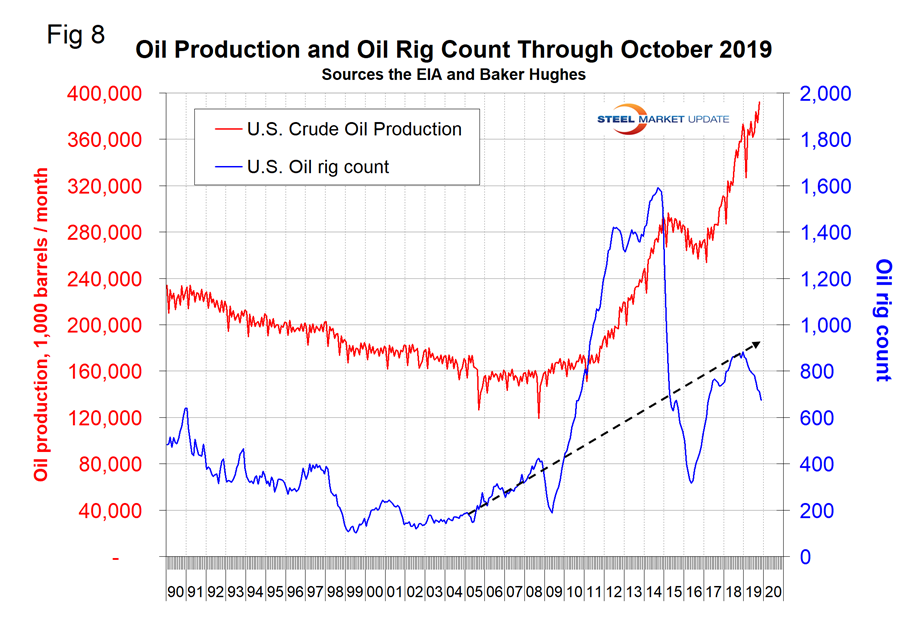
Figure 8 compares oil production and the oil rig count and shows how the increase in exploratory wells drove production from 2009 through late 2014 when the oil price collapsed. Production and rig counts moved in opposite directions for all of 2019 as previously drilled and capped wells were put into production.
Baker Hughes Rotary Rig Count: This is a weekly census of the number of drilling rigs actively exploring for or developing oil or natural gas in the United States. Rigs are considered active from the time they break ground until the time they reach their target depth and may be establishing a new well or sidetracking an existing one. The Baker Hughes Rotary Rig count includes only those rigs that are significant consumers of oilfield services and supplies.


