

Premium
January 27, 2020
Raw Materials Prices: Iron Ore, Coking Coal, Pig Iron, Scrap, Zinc
Written by Peter Wright
Prices of all five of the raw materials considered in this report advanced in the last month.
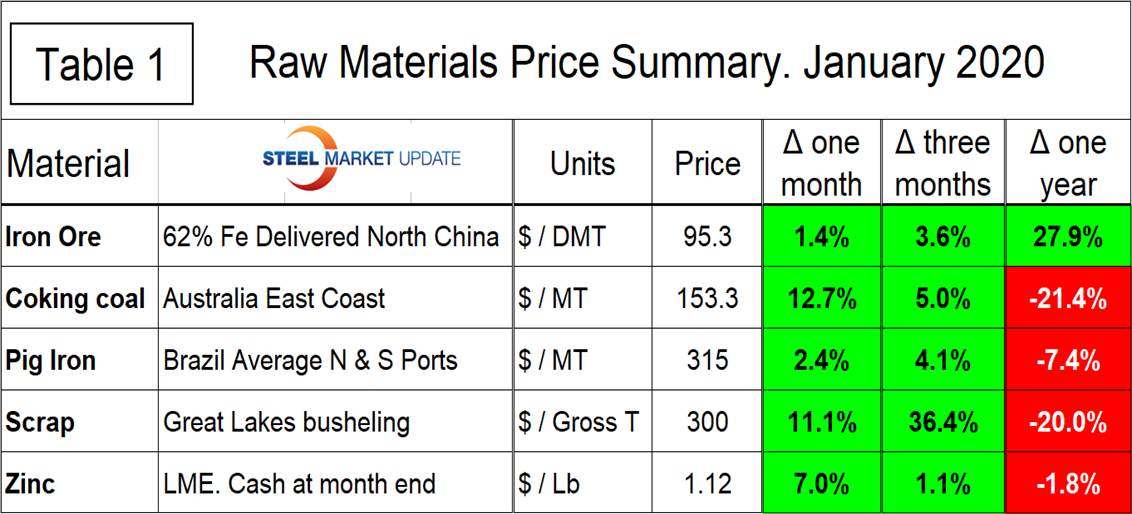
Table 1 summarizes the price changes through Jan. 22 of the five materials considered in this analysis. It reports the month/month, 3 months/3 months and 12 months/12 months changes on a percentage basis. All five materials had a positive price movement month over month in January, and also in the three months through January for the first time since we began this analysis in October 2018.
Iron Ore
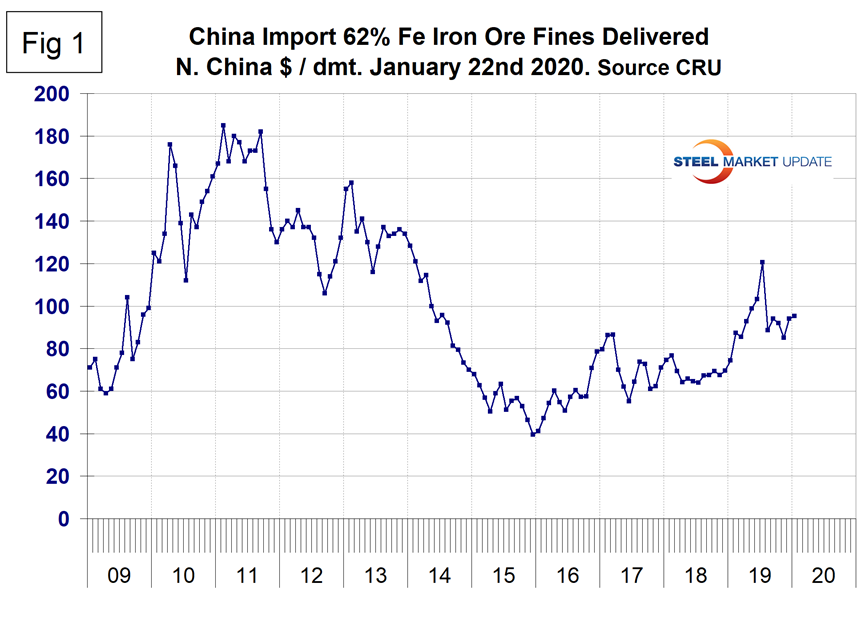
On Jan.17 Mining.com wrote: “Benchmark iron ore prices climbed on Friday after economic data showed the country’s steelmakers produced just shy of 1 billion tonnes in 2019, the second record-breaking year in a row. The Chinese import price of 62% Fe content ore advanced to $97.58 per dry metric tonne, according to Fastmarkets MB, a 6-month high and up 6% since the start of the year. China produces more crude steel than the rest of the world combined, reaching 996.3 million tonnes in 2019, up 8.3% over the prior year, according to government figures. During December, steelmakers churned out on average 2.7m tonnes per day, 12% higher than December 2018. The China Iron and Steel Association said last week it expects domestic demand for steel to grow modestly in 2020 to roughly 890m tonnes.”
Based on CRU’s data, the weekly average spot price of 62% fines delivered North China was $95.30 per dry metric ton on Jan. 22, up from $85.00 on Nov. 20. Figure 1 shows the price of 62% Fe delivered North China since January 2009. The price since January 2019 has stayed above the range that pertained for the previous year and a half.
Coking Coal
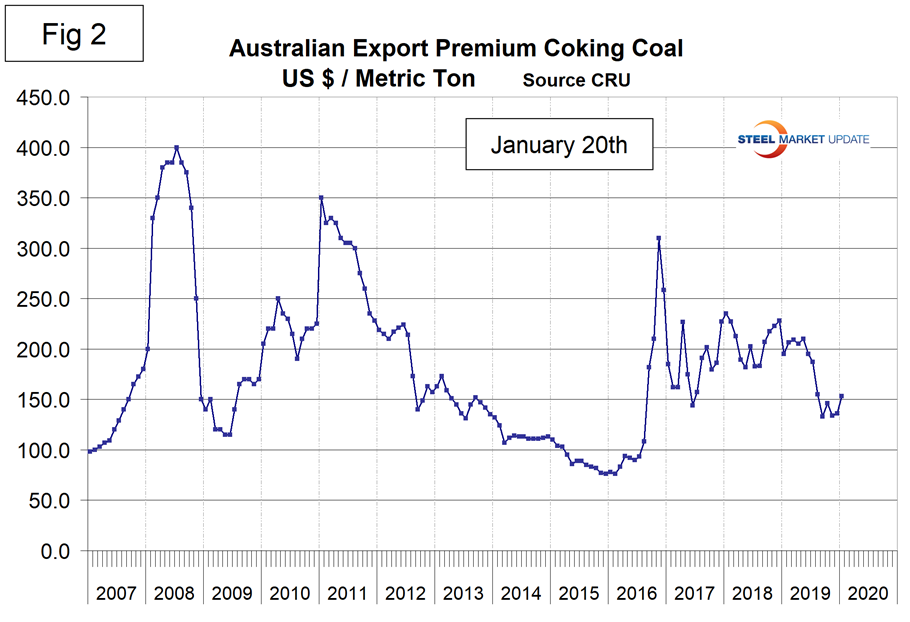
The price of premium low volatile coking coal FOB east coast of Australia increased in January to $153.30, its highest level since last August (Figure 2).
Pig Iron
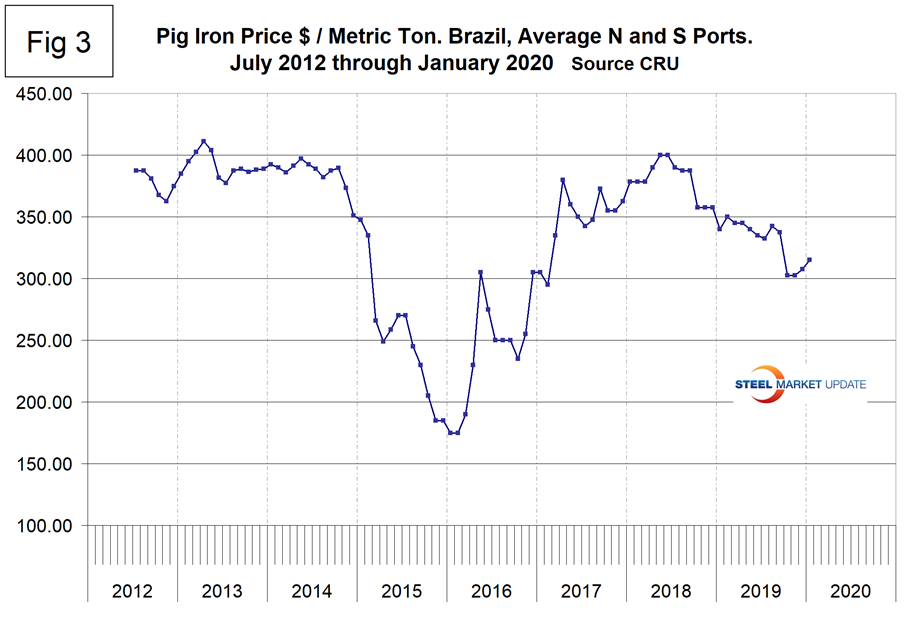
Most of the pig iron imported to the U.S. currently comes from Russia, Ukraine and Brazil with additional material from South Africa and Latvia. In this report we summarize prices out of Brazil and average the FOB value from the north and south ports (Figure 3). The price had a recent peak of $400 per metric ton in May and June 2018 before declining erratically through November 2019. There was a $12.50 recovery in December and January. The average price in January was 7.4 percent lower than in January last year.
Scrap
To put this raw materials commentary into perspective, we include here Figure 4, which shows the spread between busheling in the Great Lakes region and hot rolled coil Mid West U.S. through mid-January 2019, both in dollars per net ton. The spread collapsed from $564 in August 2018 to $287 in November 2019 before recovering to $328 in January. The spread is now at the top end of the range that has been relatively normal for the last 13 years.
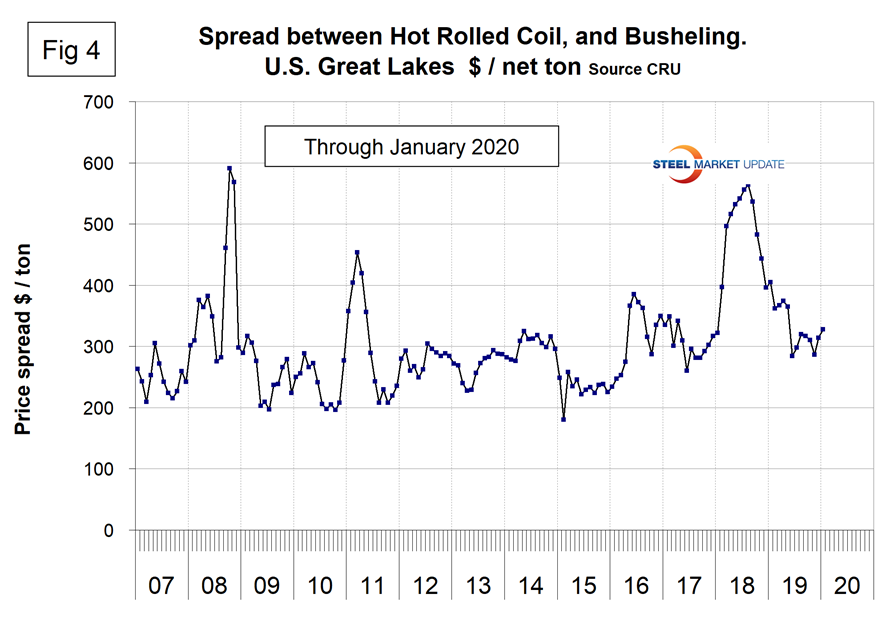
Figure 5 shows the relationship between shredded and busheling both priced in dollars per gross ton in the Great Lakes region. This spread was $5 in November through January, the lowest since May 2016.
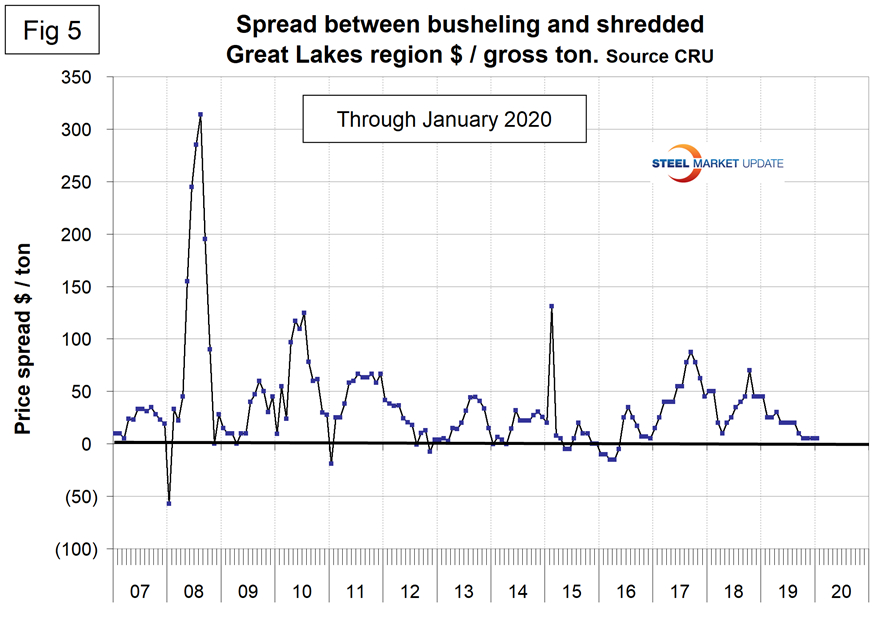
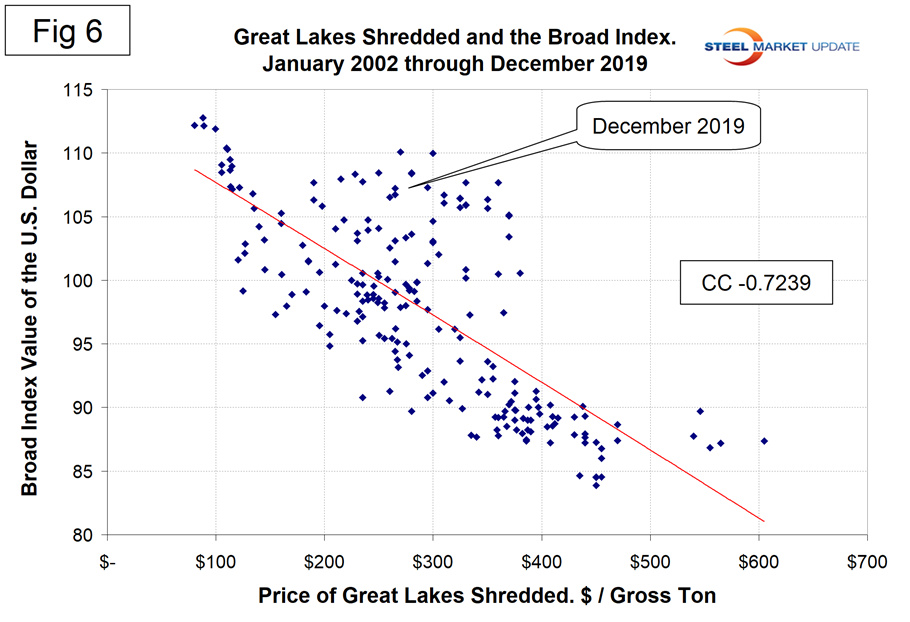
Figure 6 is a scattergram of the price of Chicago shredded and the monthly Broad Index value of the U.S. dollar as reported by the Federal Reserve. The latest data for the monthly Broad Index was December. This is a causal relationship with a negative correlation of over 72 percent.
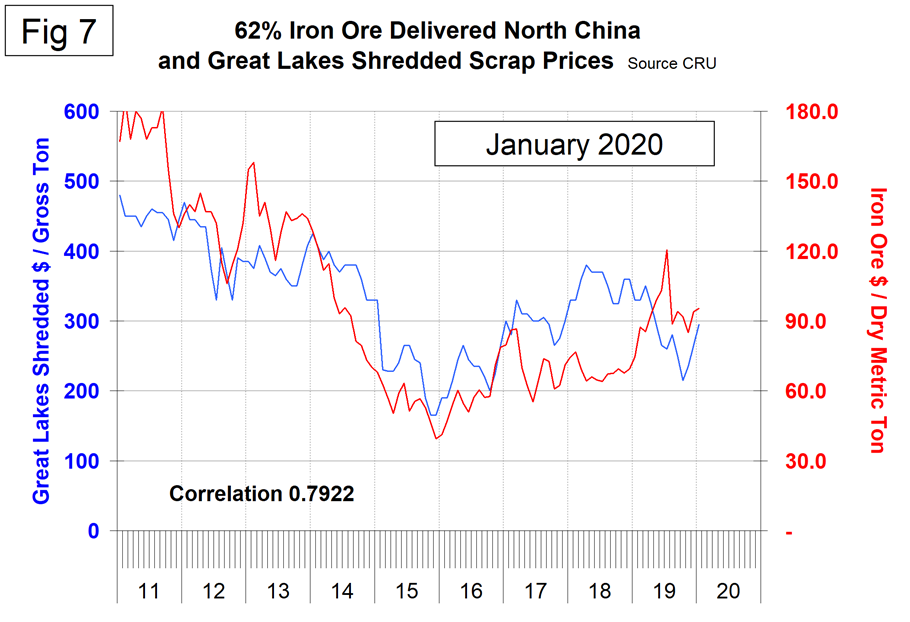
There is a long-term relationship between the prices of iron ore and scrap. Figure 7 shows the prices of 62% iron ore fines delivered North China and the price of shredded scrap in the Great Lakes region through mid-January 2020. The correlation since January 2006 has been over 79 percent. There was a very unusual divergence in these prices in 2018 that benefited the integrated producers, but that situation has now corrected leaving the EAF producers with a small advantage on a historical basis.
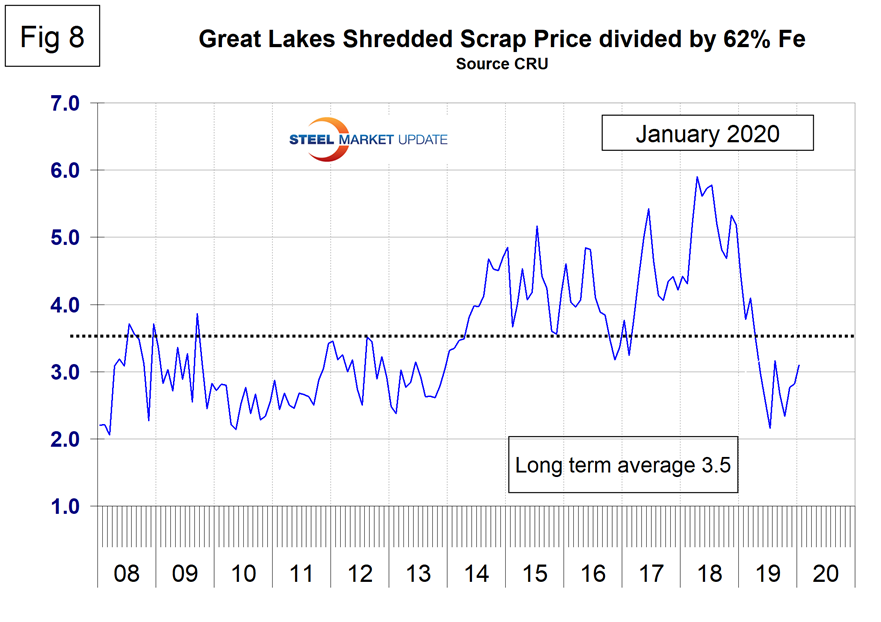
In the last 11 years, scrap in dollars per gross ton has been on average 3.4 times as expensive as iron ore in dollars per dry metric ton (dmt). A high ratio benefits the domestic integrated producers and a low ratio benefits the EAF producers. The ratio has been erratic since mid-2014, but at 3.1 in January is advantageous to the EAF producers (Figure 8).
Zinc
On Jan 21, Bloomberg News reported: “Zinc prices will fall moderately in 2020 as the market turns to a surplus for the first time in five years. Global production of refined zinc will probably surpass demand by 192,000 tons in 2020, reversing from an estimated deficit of 178,000 tons in 2019. The metal used in construction and automobiles will likely average $2,300 a ton in the year starting April 1, according to Kenji Sugawara, general manager of Mitsui Mining & Smelting Co.’s metal sales group. That’s slightly below last year’s average of $2,507 and the recently traded $2,404 on the London Metal Exchange. The surplus is a result of smelters from India to North America ramping up output in response to rising ore supplies. In China, which consumes more than 40% of the world’s metal, output growth will be limited due to strict environmental regulations, halting dramatic declines in prices, Sugawara said Monday in an interview in Tokyo. Mitsui Mining & Smelting cut the premium it charges overseas customers in Asia for the first time in four years in 2020, reflecting higher supplies. The company cut premiums by 5% to 8% this year, compared with 2019, Sugawara said. It has yet to start talks with domestic buyers for annual contracts starting April 1.”
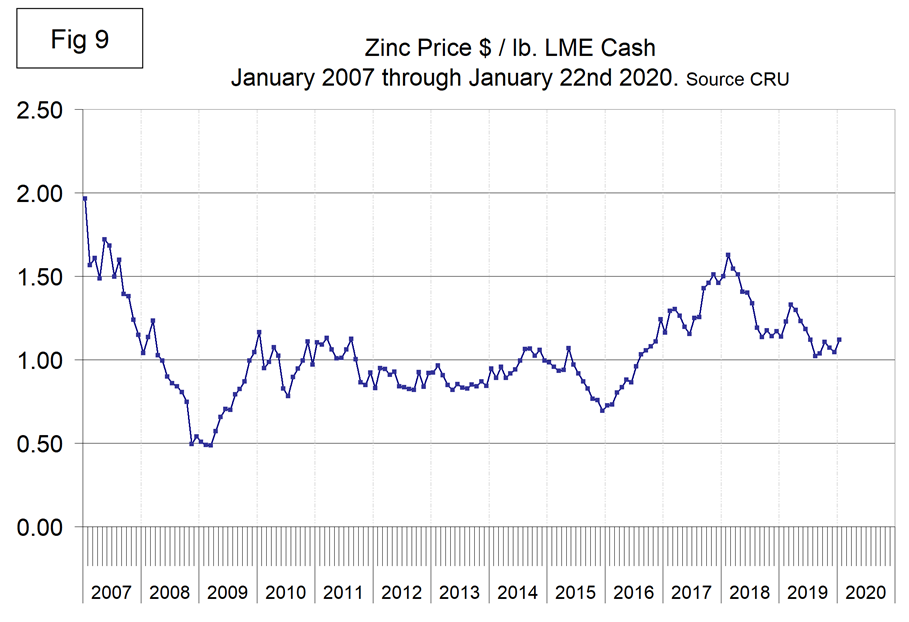
The LME cash price for zinc mid-month is shown in Figure 9. The latest data is for Jan 22 when the price was $1.12 per pound, down every month from March through August with a small rebound since then.
Zinc is the fourth most widely used metal in the world after iron, aluminum and copper. Its primary uses are 60 percent for galvanizing steel, 15 percent for zinc-based die castings and about 14 percent in the production of brass and bronze alloys.

