Market Data

January 30, 2020
U.S. GDP Rate of 2.1 Percent Unchanged in Q4
Written by Peter Wright
Steel Market Update is pleased to share this Premium content with Executive-level subscribers. For more information on upgrading to a Premium-level subscription, email Info@SteelMarketUpdate.com.
The first estimate of U.S. GDP growth in Q4 2019 was 2.1 percent, unchanged from Q3. On a trailing 12-month basis, GDP grew at 2.32 percent in the fourth quarter.
![]()
On Jan. 30, the Bureau of Economic Analysis (BEA) released the first estimate of GDP growth for the fourth quarter of 2019 stating: “Real gross domestic product (GDP) increased at an annual rate of 2.1 percent in the fourth quarter of 2019, according to the ‘advance’ estimate. In the third quarter, real GDP increased 2.1 percent. The GDP estimate released today is based on source data that are incomplete or subject to further revision by the source agency. The increase in real GDP in the fourth quarter reflected positive contributions from personal consumption expenditures, federal government spending, state and local government spending, residential fixed investment, and exports, that were partly offset by negative contributions from private inventory investment and nonresidential fixed investment. Imports, which are a subtraction in the calculation of GDP, decreased.”
GDP is now measured and reported in chained 2012 dollars, and on an annualized basis in the fourth quarter totaled $19.220 trillion. The growth calculation is misleading because it takes the quarter-over-quarter change and multiplies by four to get an annualized rate. This makes the high quarters higher and the low quarters lower. Figure 1 clearly shows this effect. The blue line is the trailing 12-months growth and the black line is the headline quarterly result. On a trailing 12-month basis, GDP was up by 2.32 percent in the fourth quarter, which was down from 3.20 percent in Q2 2018. To put that result into perspective, the average in 40 quarters since Q1 2010 has been 2.29 percent, therefore the latest result is very close to the 10-year average. The blue line in Figure 1 shows the progress of the trailing 12-month result since the first quarter of 1990.
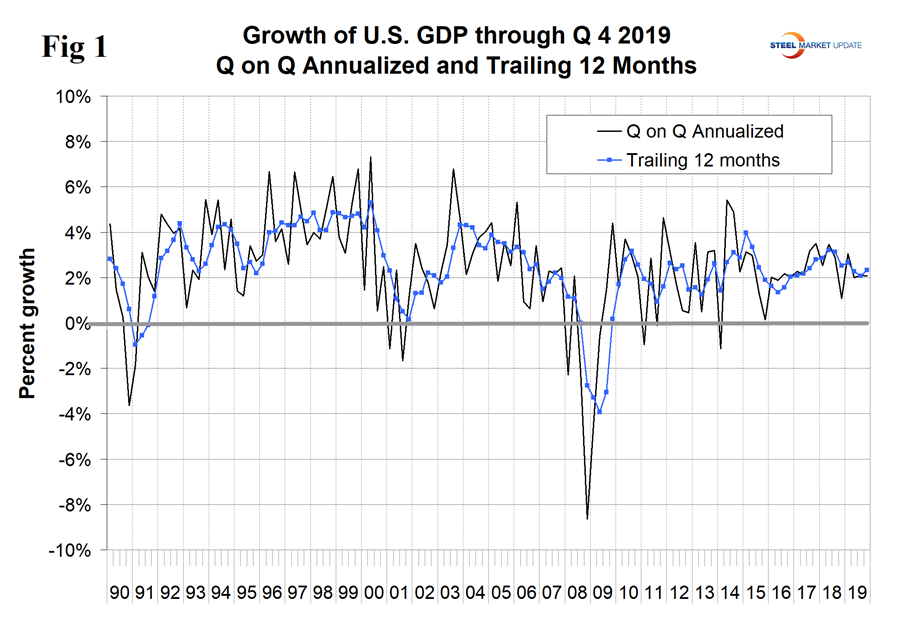
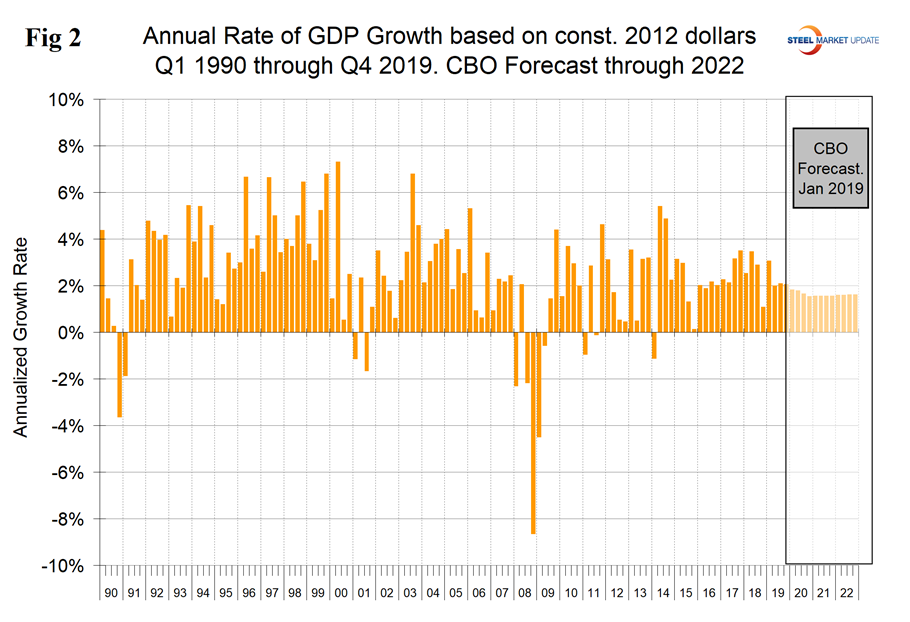
Figure 2 shows the headline quarterly results since 1990 and the January 2019 Congressional Budget Office forecast through 2022. The CBO underestimated the growth rate in the first quarter of 2019, but was close for the second, third and fourth quarters.
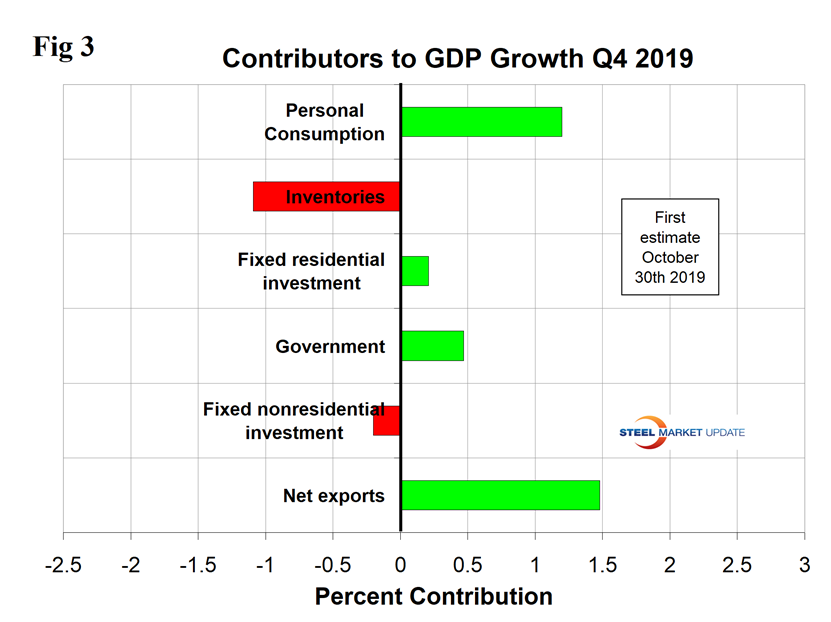
The mix of the six major contributory components in the final GDP growth calculation is shown in Figure 3. Normally, personal consumption is the dominant growth driver, but this was not the case in the latest data when this contribution was 1.20 percent, down from 3.03 percent in Q2 2019. Personal consumption includes goods and services, the goods portion of which includes both durables and non-durables. Fixed nonresidential investment and inventory changes detracted from the overall result. The effect of inventories is always a wild card in the GDP calculation. Declining inventories are entered as a negative in the GDP calculation. Note that in the definitions at the end of this piece, inventories are not mentioned. Over the long run, inventory changes are a wash and simply move the reported growth from one period to another.
On Jan. 30, Economy.com wrote: “U.S. GDP growth is running near potential. The preliminary report from the Bureau of Economic Analysis puts real GDP growth at 2.1%, the third consecutive quarter of near-potential growth. Despite a modest slowing, consumer spending remained a major contributor to growth, posting near average growth. Residential investment was a leader along with intellectual property investment. Trade powerfully supported growth as imports shrank. Inventory investment was a major drag on growth. The government contribution increased. Real disposable income growth slowed to 1.5% from 2.9%. The saving rate slipped to 7.7%.”
Figure 4 shows the contributions of residential and nonresidential investment. After the recession, nonresidential investment bounced back, but residential did not, and has had less than a 1 percent variation since the third quarter of 2010. In quarters 2, 3 and 4 of 2019, nonresidential investment made negative contributions. Residential investment made a positive contribution in Q3 and Q4 for the first time since Q4 2017.
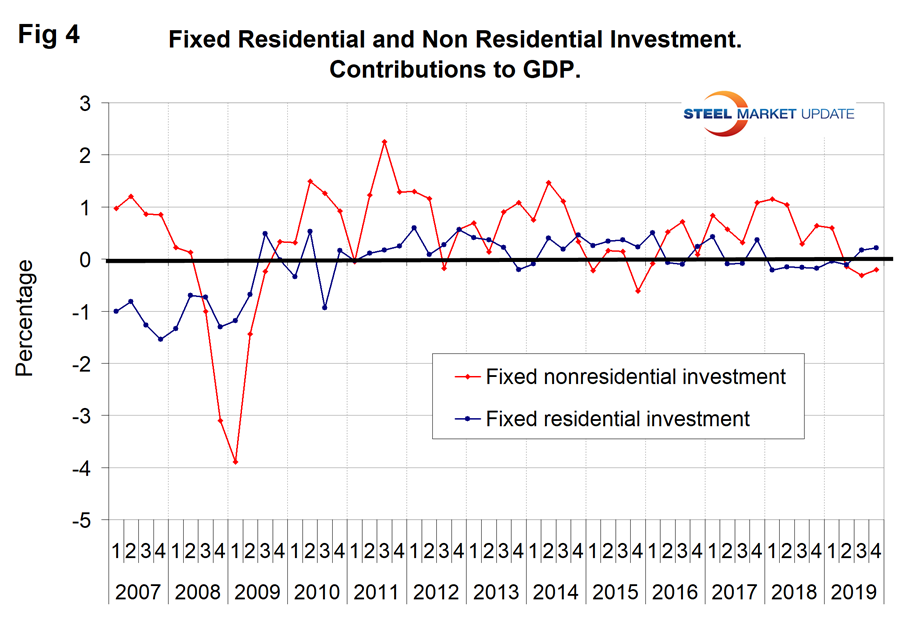
Figure 5 shows the quarterly contributors of the six major subcomponents of GDP since Q1 2007. This chart clearly shows the whipsaw effect of inventory changes, which are coded pale blue. It also shows the unusually high contribution of net exports in Q4 and the decline in personal consumption expenditures in Q4 compared to Q2 and Q3 of 2019. The contribution of personal consumption in Q4 was 1.20 percent. The average since Q1 2017 has been 1.9 percent.
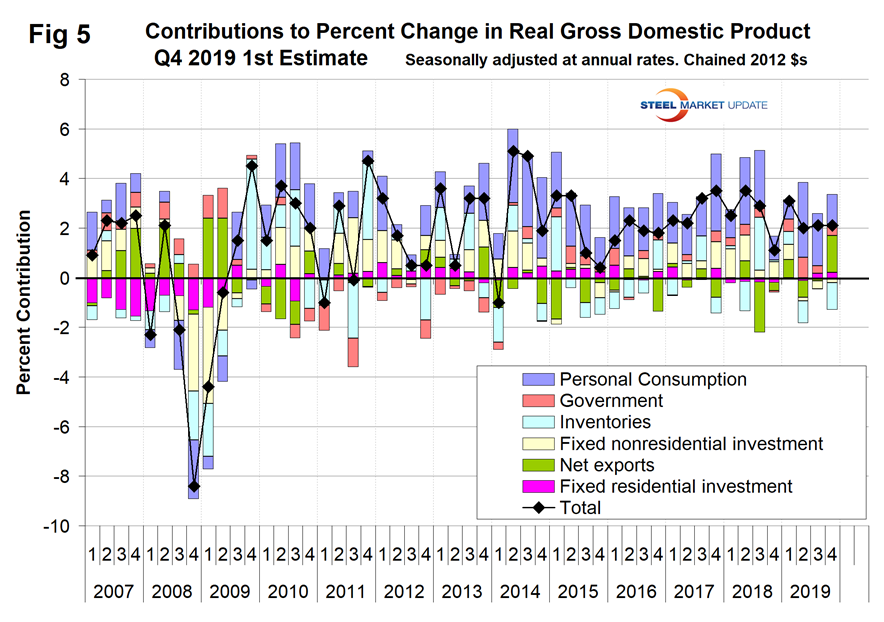
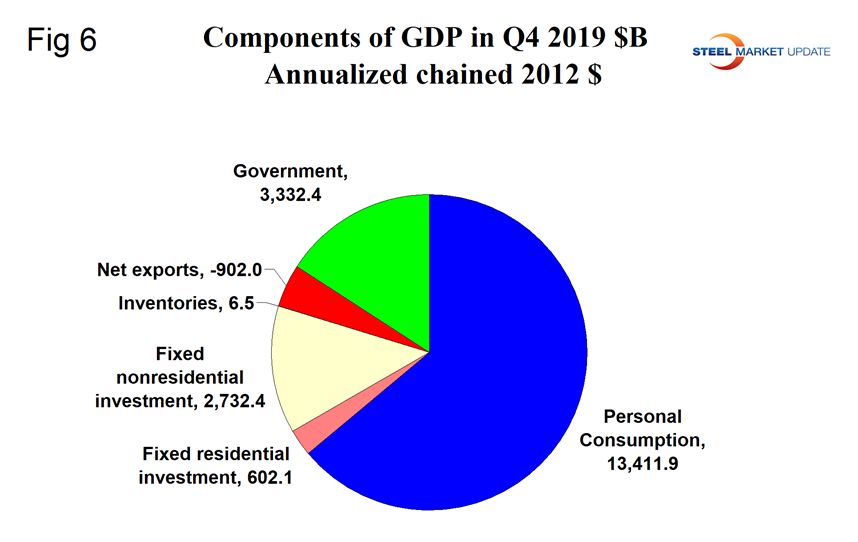
Figure 6 shows the breakdown of the $19.220 trillion economy.
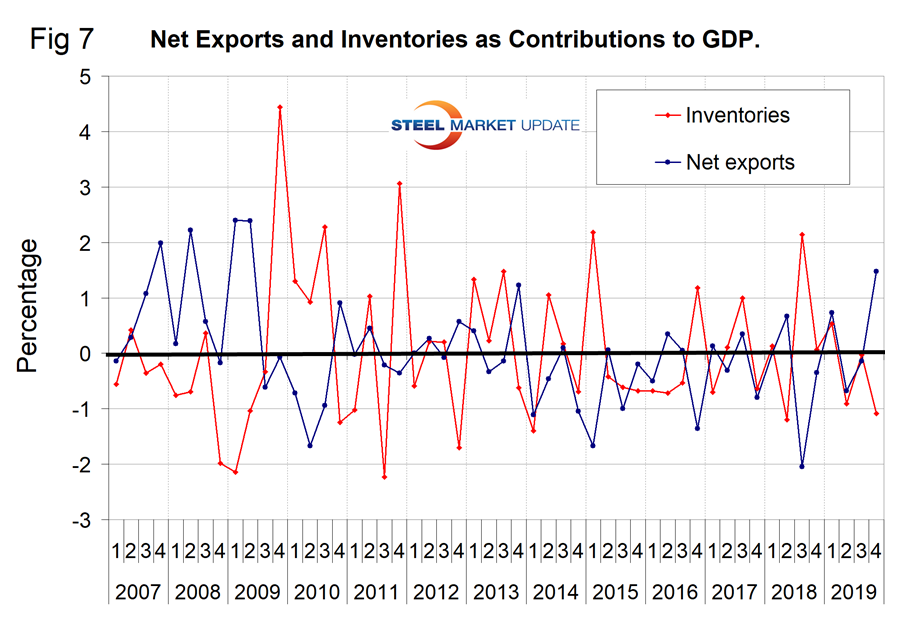
SMU Comment: On a trailing 12-month basis, GDP growth has declined from 3.2 percent in Q2 2018 to 2.32 percent in Q4 2019. We think is the best way to look at this data because the headline quarterly result can be highly volatile. The fourth-quarter result was unusual because the contribution of net exports was the highest since Q2 2009. Figure 7 isolates the contribution of net exports and inventories. There seems to be a strong tendency for these to bail each other out and to make the headline quarterly result more stable than it otherwise would be.