

Market Data
February 10, 2020
Employment by Industry in January
Written by Peter Wright
January’s employment report was a downer for manufacturing, but construction was particularly strong.
The net increase in employed persons was 225,000 in January, of which 108,000 were in health, education and leisure activities. In January, 44,000 jobs were created in construction and 12,000 jobs lost in manufacturing. The private sector gained 206,000 jobs in January and government gained 19,000 positions. Table 1 breaks total employment down into service and goods-producing industries and then into private and government employees. Most of the goods-producing employees work in manufacturing and construction and the components of these two sectors of most relevance to steel people are broken out in Table 1.
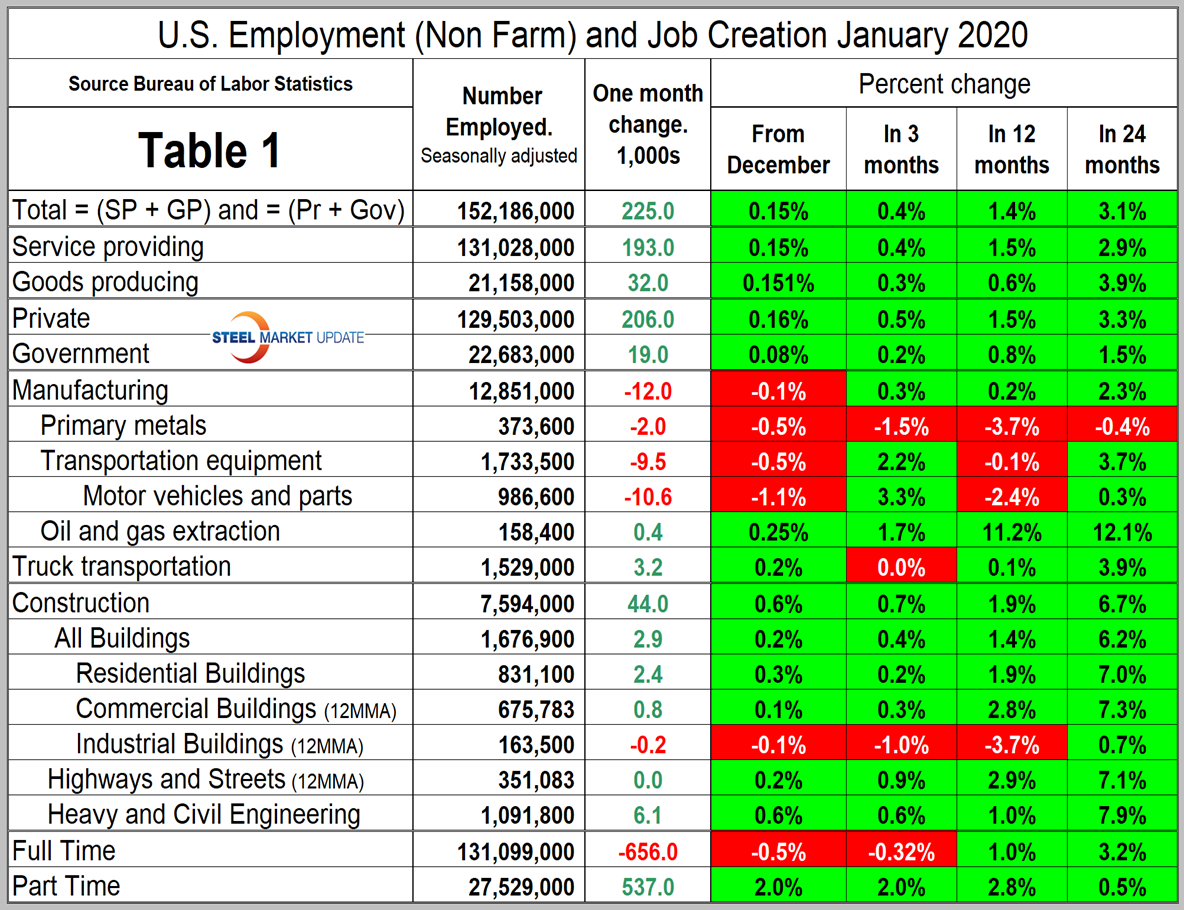
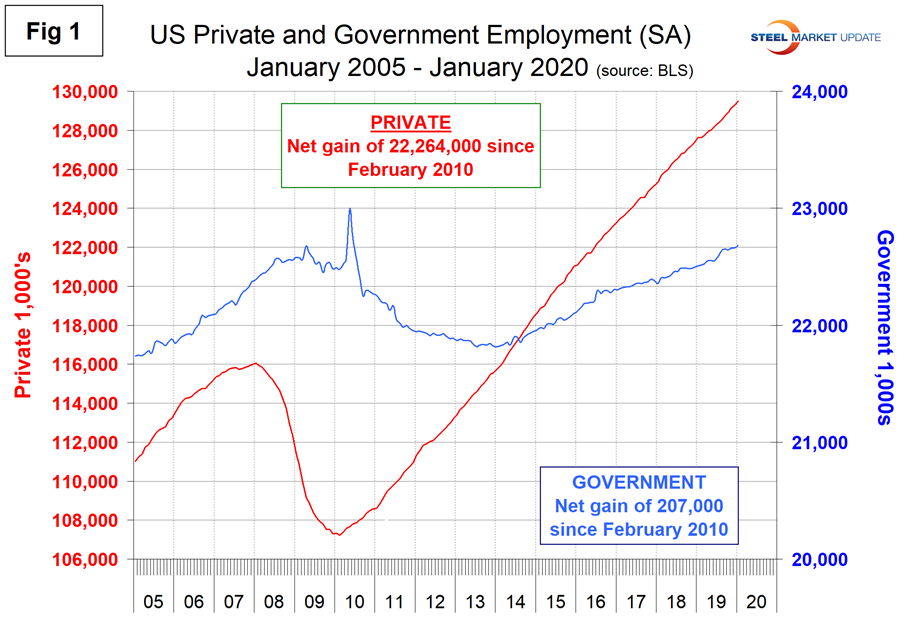
In January, the number employed by the federal government increased by 12,000. State government employment declined by 13,000 and the local level increased by 20,000. Since February 2010, the low point of total non-farm payrolls, private employers have added 22,264,000 jobs as government has gained 207,000 (Figure 1).
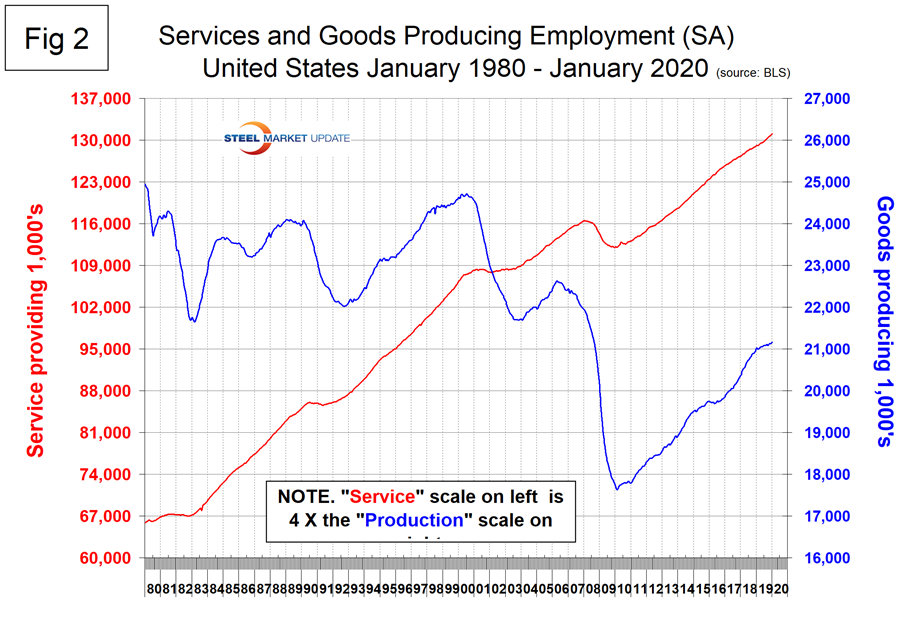
In January, service industries expanded by 193,000 as goods-producing industries, which are mainly involved in construction and manufacturing, gained 32,000 (Figure 2). Since February 2010, service industries have added 18,940,000 and goods-producing 3,531,000 positions. This has been a drag on wage growth since the recession as service industries on average pay less than goods-producing industries such as manufacturing. In the last 12 months on a percentage basis, the rate of job creation in service industries has been more than double that of goods-producing industries.
Construction was reported to have gained 44,000 jobs in January (on a seasonally adjusted basis). Since and including January 2018, construction has added 501,000 jobs and manufacturing 310,000. On Jan. 31 (before this BLS update) the Associated General Contractors of America reported that union membership declined by 170,000 (1.2 percent) in 2019 to 14,574,000 (10.3 percent of employed workers) from 14,744,000 (10.5 percent) in 2018. Construction industry membership inched up by 7,000 (0.7 percent) from 1,048,000 to 1,055,000, but the share slipped from 12.8 percent to 12.6 percent as overall employment grew three times as fast (2.2 percent) as union membership, from 8,169,000 to 8,352,000. Similarly, the number of construction industry employees represented by unions (workers who report no union affiliation but whose jobs are covered by a union contract) edged up by 8,000 (0.7 percent), from 1,125,000 to 1,133,000, while the rate declined from 13.8 percent to 13.6 percent.
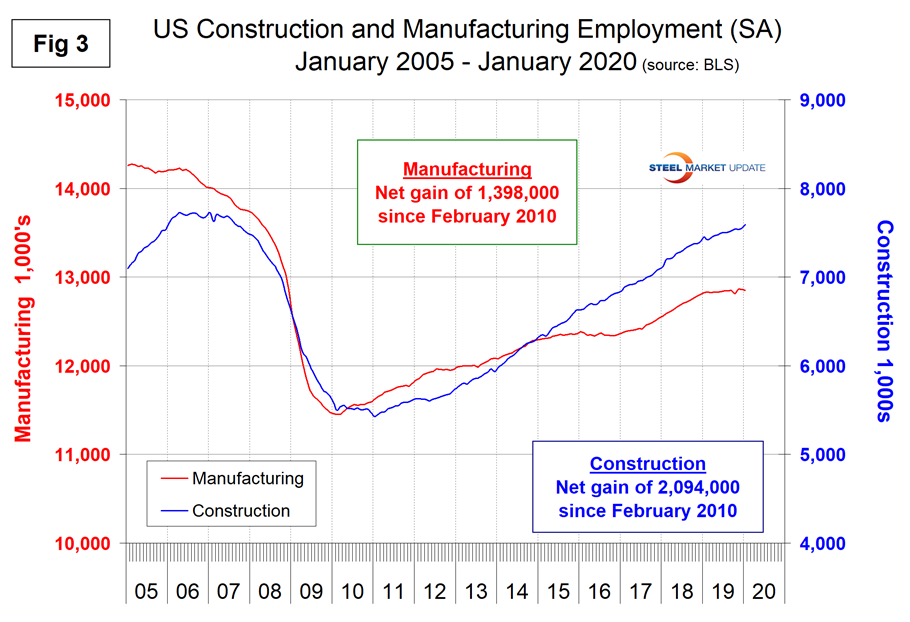
Figure 3 shows the history of construction and manufacturing employment since January 2005. In the last 24 months, construction has added jobs almost three times as fast as manufacturing. Construction has added 2,094,000 jobs and manufacturing 1,398,000 since the recessionary employment low point in February 2010. Manufacturing only gained 46,000 jobs in 2019 compared to 264,000 in 2018. This trend is in alignment with the manufacturing data that we present in a separate monthly report.
Note, the subcomponents of both manufacturing and construction shown in Table 1 don’t add up to the total because we have only included those with the most relevance to the steel industry.
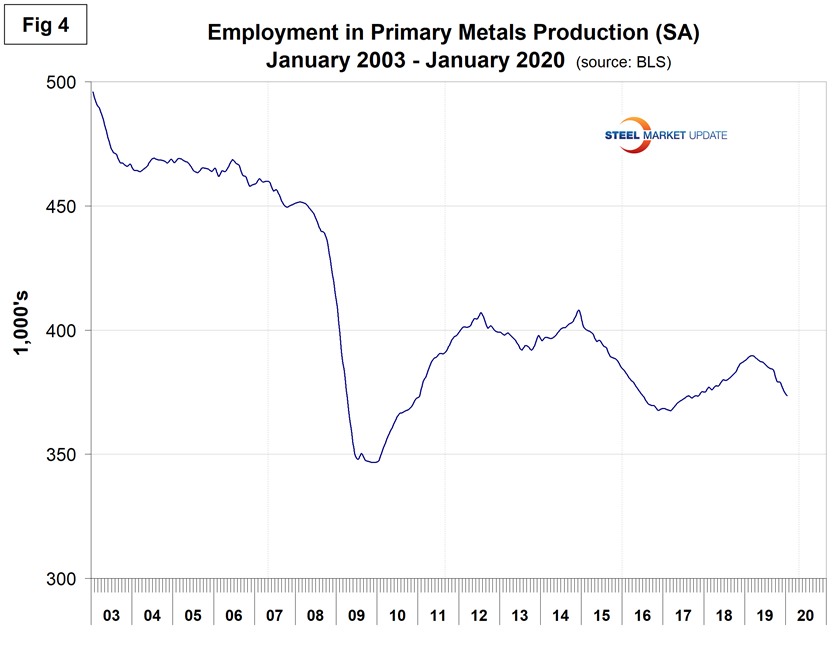
Table 1 shows that primary metals lost 2,000 jobs in January and has seen employment declines in each of the last 10 months. Figure 4 shows the history of primary metals employment since January 2003. The primary metals industries lost 14,000 jobs in 2019.
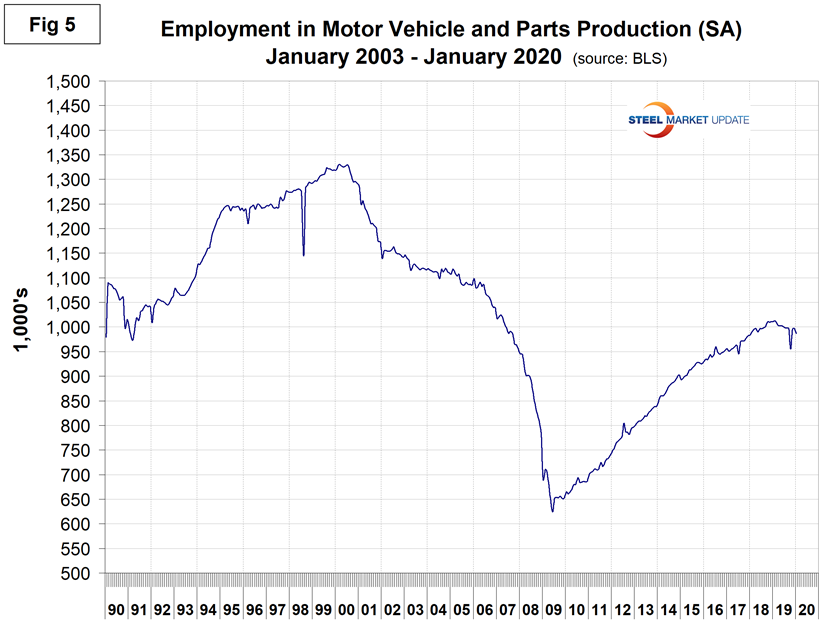
Motor vehicles and parts industries were reported to have lost 10,600 jobs in January and to have lost 14,000 jobs in the 12 months of 2019. Figure 5 shows the history of motor vehicles and parts job creation.
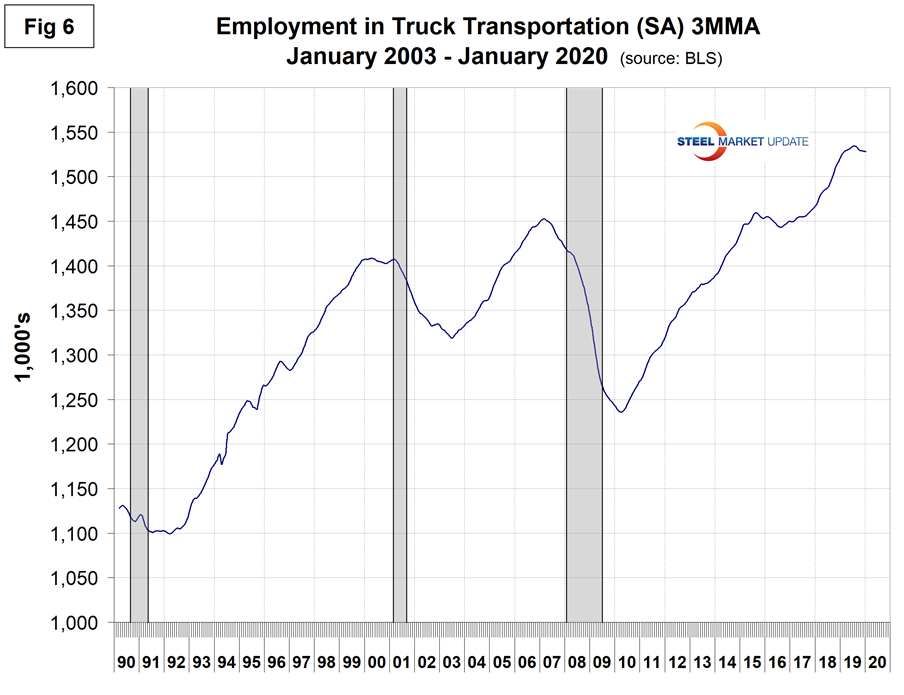
Trucking gained 3,200 jobs in January, but has lost 6,400 jobs in the last six months. We are particularly interested in this sector because employment in truck driving is one of SMU’s recession monitors and is obviously a fundamental measure of activity relevant to heavy industry. On Jan. 18, Wolf Richter, an equities analyst wrote: “Shipment volume in the U.S. by truck, rail, air, and barge plunged 7.9 percent in December 2019 compared to a year earlier, according to the Cass Freight Index for Shipments. It was the 13th month in a row of year-over-year declines, and the steepest year-over-year decline since November 2009, during the Financial Crisis. December was also the month when Celadon Group (OTCPK:CGIP), with about 3,000 drivers and about 2,700 tractors, filed for Chapter 11 bankruptcy and ceased operations – the largest truckload carrier ever to file for bankruptcy in U.S. history. It rounded off a large wave of bankruptcies and shutdowns of trucking companies in 2019, most of them smaller ones, but also some regional carriers and, on Dec. 9, Celadon. Rail traffic in December capped off a miserable year, with carloads down 9.2 percent year-over-year in December, and container and trailer loads (intermodal) down 9.6 percent, according to the Association of American Railroads. For the 52-week period, traffic of carloads and intermodal units fell 5 percent.”
Figure 6 shows that at this time there is beginning to be a noticeable decline.
SMU Comment: Employment in manufacturing continues to disappoint, but construction is surging. Employment in the primary metals industries has fared much worse than overall manufacturing for the last two years. From a future steel consumption in manufacturing point of view, 2019 was a disappointment and there is no sign of a turnaround.
Explanation: On the first or second Friday of each month, the Bureau of Labor Statistics releases the employment data for the previous month. Data is available at www.bls.gov. The BLS employment database is a reality check for other economic data streams such as manufacturing and construction. It is easy to drill down into the BLS database to obtain employment data for many subsectors of the economy. The important point about all these data streams is the direction in which they are headed.


