

Market Data

February 17, 2020
Currency Update for Steel Trading Nations
Written by Peter Wright
In this report we examine the change in currency values of the 16 pre-eminent global steel and iron ore trading nations. The U.S. dollar has strengthened against 10 of the 16 currencies in the last three months. In January we replaced the British pound in this report with the Vietnamese dong in recognition that Vietnam is now a much bigger player in the global steel market than is the UK.
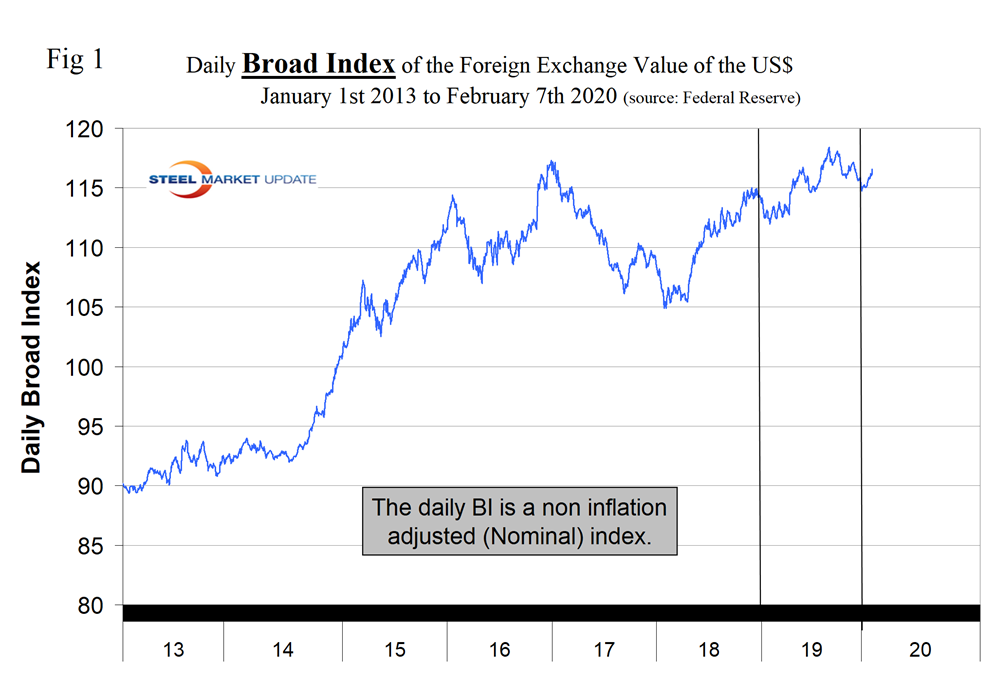
The currencies of these 16 don’t necessarily follow the Broad Index value of the U.S, dollar. In fact, at any given time, some are always moving in the opposite direction. The latest value of the Broad Index as published by the Federal Reserve was Feb. 7. In the three months prior to that date, the dollar had weakened by 0.5 percent; therefore, in this instance, the currencies of the steel trading nations are not coincident with the Broad Index
![]()
Figure 1 plots the daily Broad Index (BI) value of the U.S. dollar since 2013. After declining in January 2019, the dollar appreciated erratically through Sept. 3, and since then has been on an erratic downtrend.
On Feb. 11, Mark Chandler, a currency specialist wrote: “Federal Reserve Chair Powell did not break new ground in yesterday’s testimony, but that alone contained information for investors. The market pulled back from its aggressive Fed view. The implied yield of the December Fed Funds futures contract rose by 3.5 bp, and another 1.5 bp today. That brings the yield rise this month to 12.5 bp to 1.265%. The debate is not about whether the Fed will cut, but whether there will be one or two cuts. The Fed Funds futures strip has a quarter-point cut fully discounted by the end of Q3, after which the hurdle is high to move ahead of the national election. Separately, the Fed’s third 14-day repo operation was oversubscribed. Banks wanted almost twice the $30 billion the Fed had offered ($52.65 billion). While a nuanced understanding of what is happening may be elusive, it is worrisome and raises questions about the Fed’s exit strategy.”
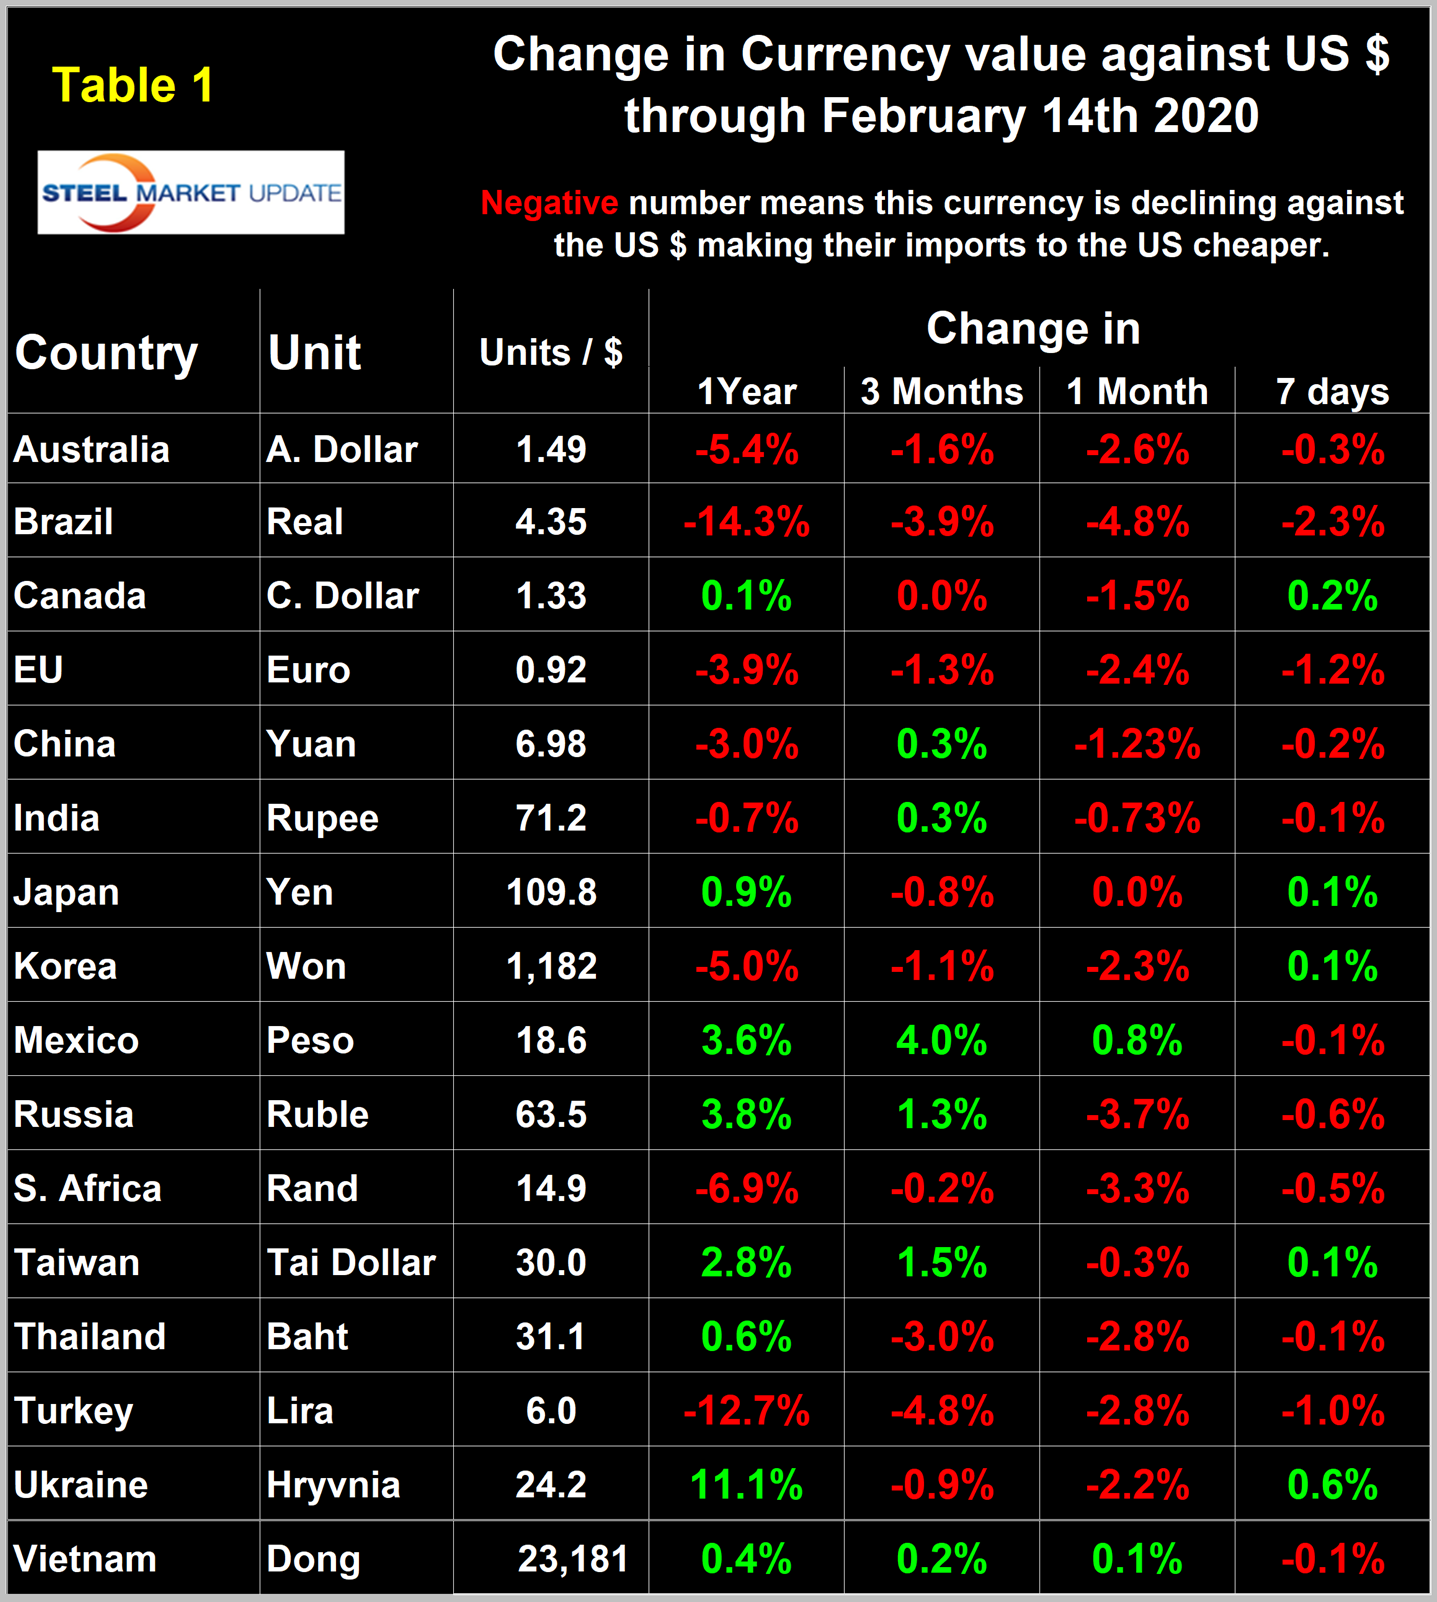
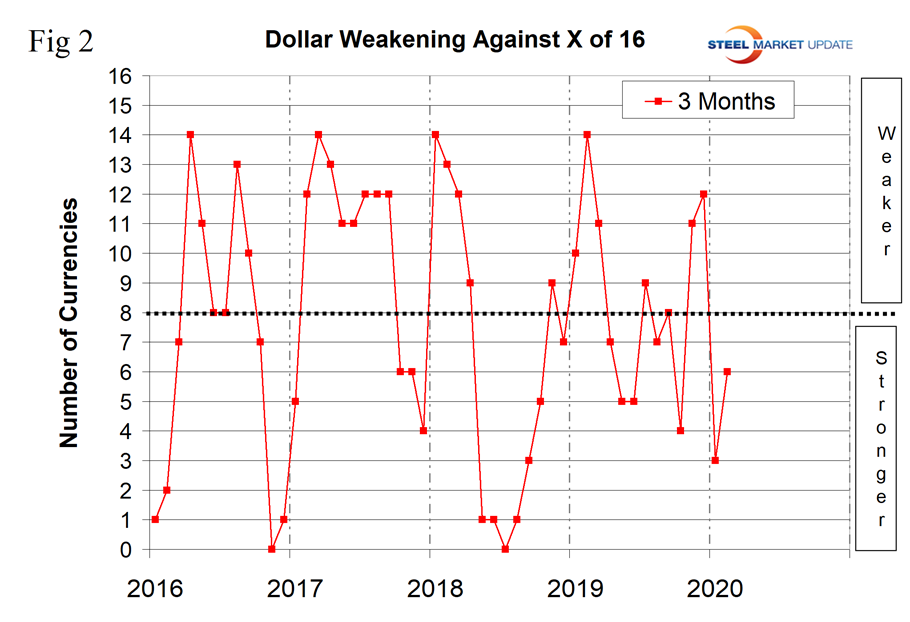
Table 1 shows the number of currency units that it takes to buy one U.S. dollar and the percentage change in the last year, three months, one month and seven days. The overall picture for the steel trading nations is that in the last year the U.S. dollar has weakened against 8 of the 16. In the last three months the dollar has strengthened against 10, in the last month has strengthened against 17, and in the seven days prior to Feb. 7 it strengthened against 11. Table 1 is color coded to indicate weakening of the dollar in green and strengthening in red. We regard strengthening of the U.S. dollar as negative and weakening as positive because of the effect on net imports. Figure 2 shows the extreme gyrations that have occurred at the three-month level in the last four years.
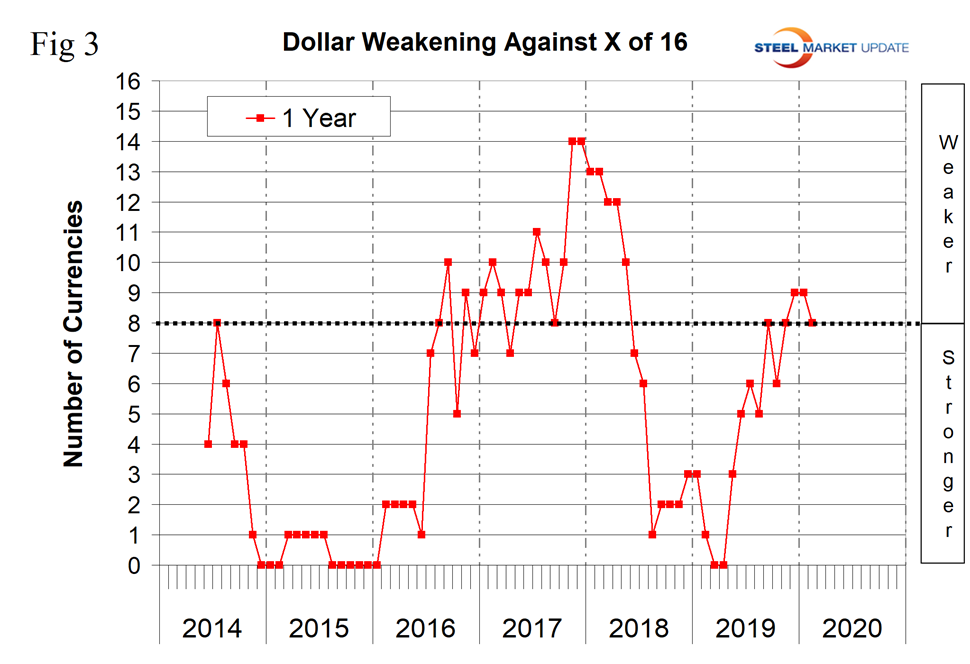
To try to get a less volatile look at the changes in value of the 16 currencies under examination here, we have developed Figure 3. This shows the number of currencies against which the dollar was weakening on a year-over-year basis. In March and April 2019, the dollar was strengthening against all 16, but by mid-February 2020 it was only strengthening against 8.
The biggest changes in the last three months were the Turkish lira, down 4.8 percent, the Brazilian real, down 3.9 percent, and the Mexican peso, up by 4.0 percent. We present long-term charts of the value of these three currencies against the dollar in this update together with external comments on the South African rand and the Japanese yen. (See the end of this report for details on data sources.)
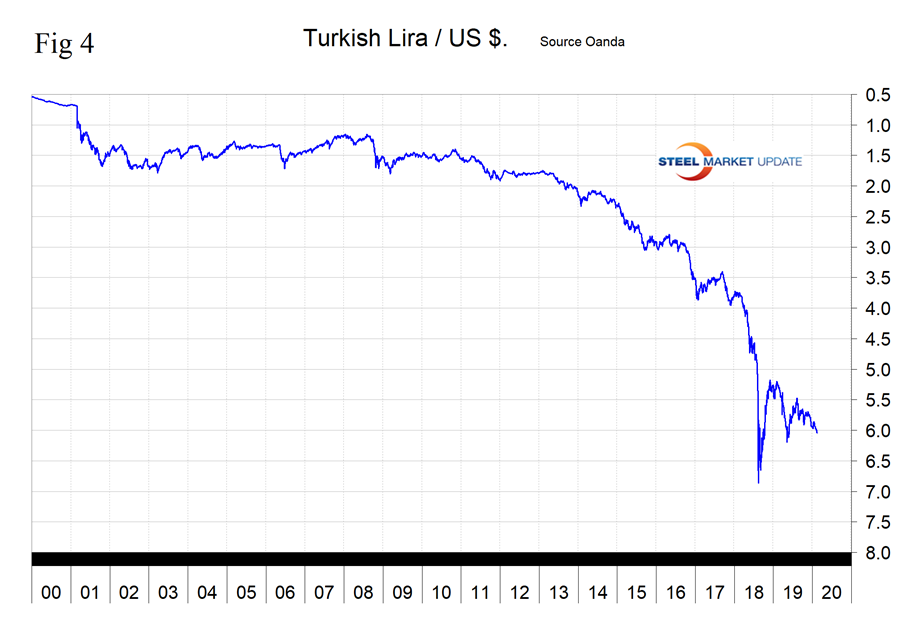
The Turkish Lira
In the last 12 months, Turkey’s lira has declined by 12.7 percent, by 4.8 percent in three months and by 2.8 percent in the last 30 days. Since Jan. 1, 2019, the lira has declined by 14.6 percent (Figure 4).
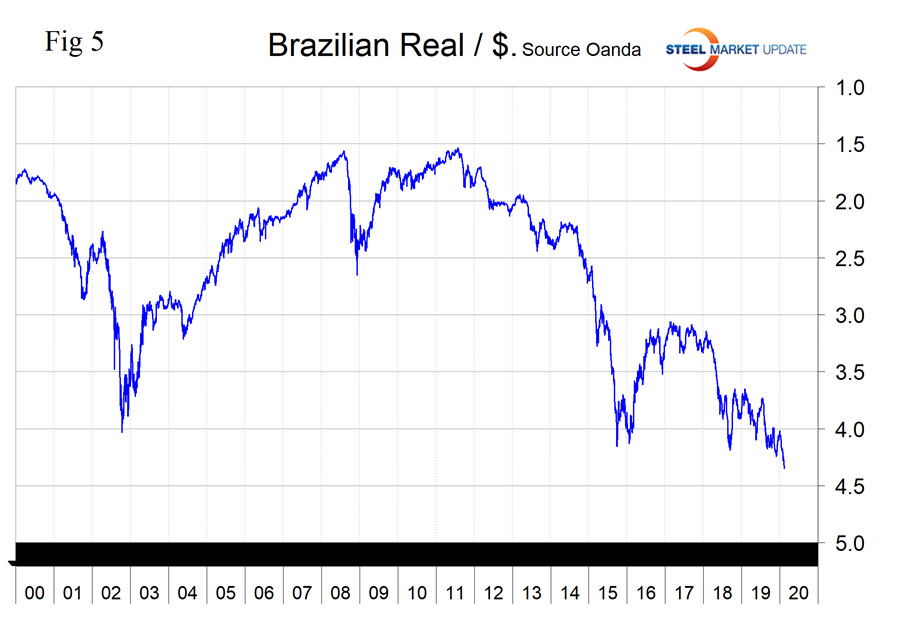
The Brazilian Real
In the last 12 months, Brazil’s real has declined by 14.3 percent, by 3.9 percent in three months, and by 4.8 percent in the last 30 days (these values are not concurrent). Since Jan. 1, 2019, the real is down by 13.0 percent (Figure 5).
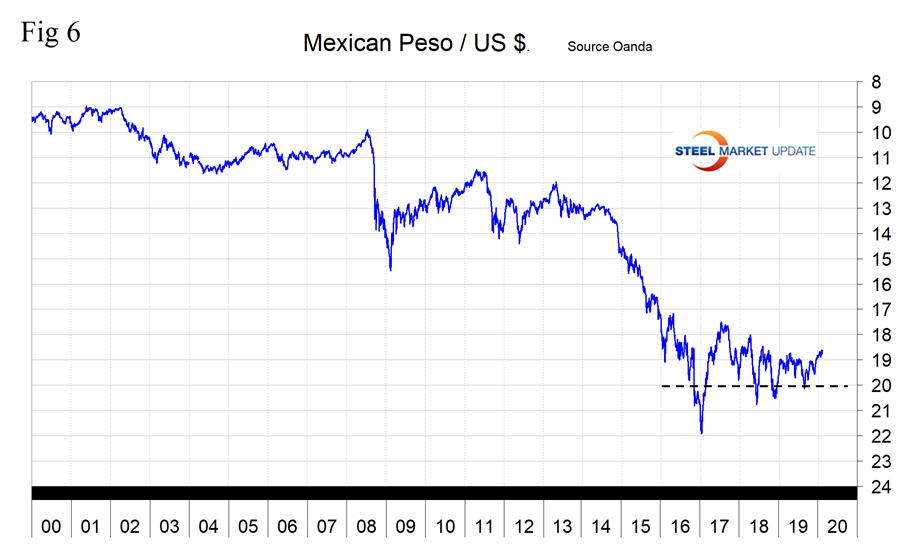
The Mexican Peso
Mexico’s peso was unusually stable for the first seven months of 2019 before declining through 20 to the dollar on Aug. 28. By Feb. 14, 2020, the peso had recovered to 18.64 to the dollar. The peso has appreciated by 4.0 percent in the last three months and by 0.8 percent in the last 30 days (Figure 6).
South African Rand
The South African rand has declined by 6.9 percent in the last year and by 3.3 percent in the last month (Figure 7).
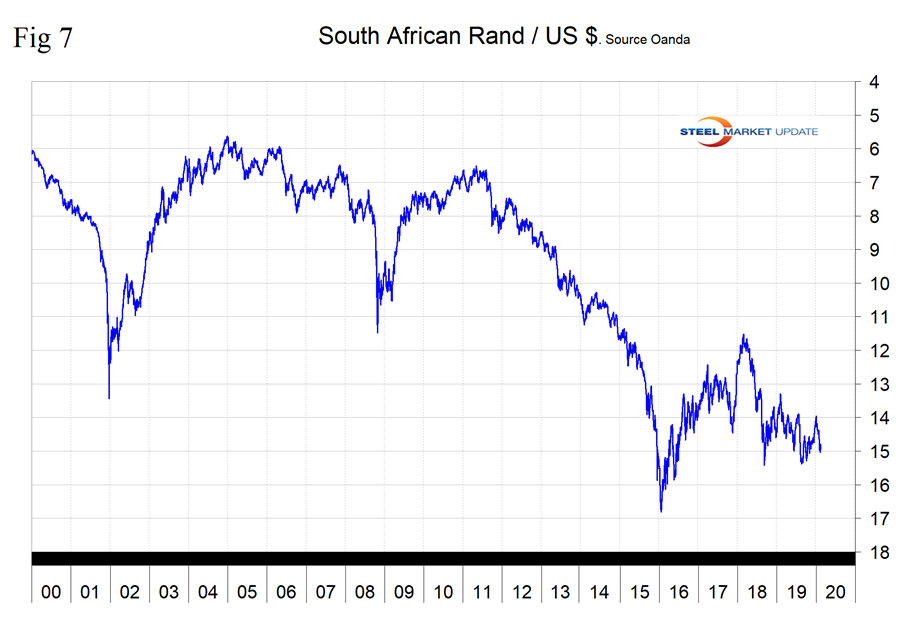
On Jan. 30, the IMF reported that “economic growth in the past decade declined in South Africa and started to undershoot its peers, highlighting the role of unaddressed structural constraints. South Africa’s macroeconomic performance appears to have witnessed an important inflection point between the 2000s and the 2010s, which broadly coincides with the global financial crisis in 2008–09. Real GDP growth (year on year) halved after the Global Financial Crisis, from 4.3 percent during 2000-07 to 2 percent during 2010-17 and eked out just 0.8 percent in 2018. Monetary and fiscal policies have lent significant growth support, but structural rigidities have kept business confidence low, depressing private investment and growth. Demand for credit has weakened, while banks have refrained from expanding loans, in the low-growth environment.”
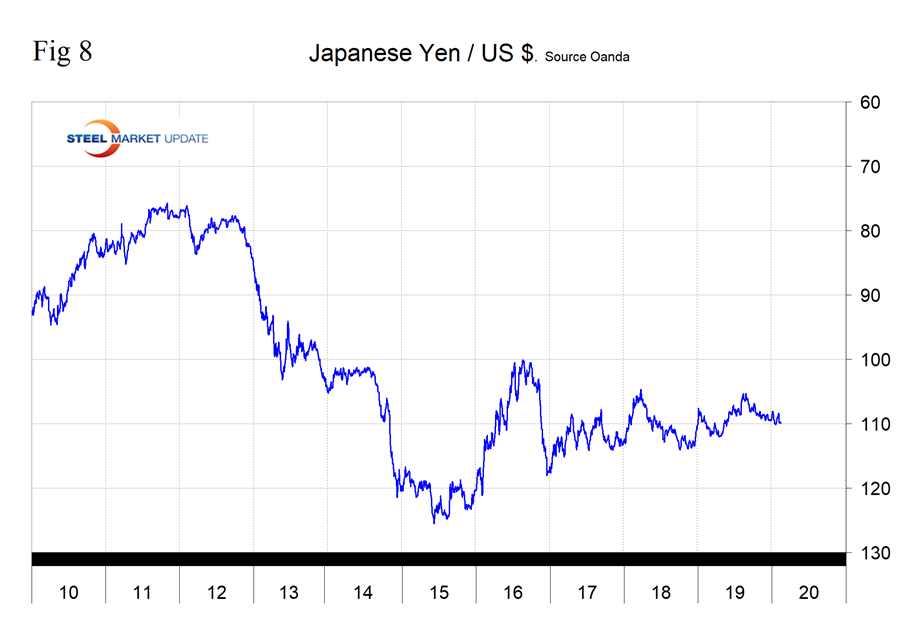
The Japanese Yen
Japan’s yen has been virtually unchanged in the last 30 days and was down by 0.8 percent in the last three months. The Japanese currency has been rangebound for almost three years with a low of 115.2 on March 10, 2017, to a high of 105.94 on March 16, 2018. On Feb. 14, 2020, the U.S. dollar was worth 109.8 yen. On Feb. 8, the IMF published its Article IV Consultation with Japan. In summary, the Japanese economy is growing above its estimated potential, despite a significantly weaker external environment. Private consumption and public spending supported growth in the first three quarters of 2019, while exports and export-driven investment have softened in line with weaker external conditions. The two-percentage-point increase in the consumption tax rate in October 2019 appears to have had less impact than the last rate increase in 2014, due in part to government countermeasures. Real GDP growth is estimated to be above potential in 2019 at 1.0 percent. While the output gap is narrowing and labor markets remain tight, overall wage growth and inflation expectations remain stagnant. CPI headline inflation and the BOJ’s core-core inflation (excluding fresh food and energy) have risen in recent months but remain below the Bank of Japan’s 2 percent inflation target, the IMF said. Figure 8 shows the history of the yen value since 2010.
In this monthly analysis, we show the trends we think have the most immediate significance, but all 16 steel trading nation graphs are available on request.
Explanation of Data Sources: The Broad Index is published by the Federal Reserve on both a daily and monthly basis. It is a weighted average of the foreign exchange values of the U.S. dollar against the currencies of a large group of major U.S. trading partners. The index weights, which change over time, are derived from U.S. export shares and from U.S. and foreign import shares. The data are noon buying rates in New York for cable transfers payable in the listed currencies. At SMU, we use the historical exchange rates published in the Oanda Forex trading platform to track the currency value of the U.S. dollar against that of 16 steel trading nations. Oanda operates within the guidelines of six major regulatory authorities around the world and provides access to over 70 currency pairs. Approximately $4 trillion U.S. dollars are traded every day on foreign exchange markets.


