

Market Data

March 16, 2020
Currency Update for Steel Trading Nations
Written by Peter Wright
The currencies of the commodity dependent nations have crashed in a flight to the safe haven of the U.S. dollar.
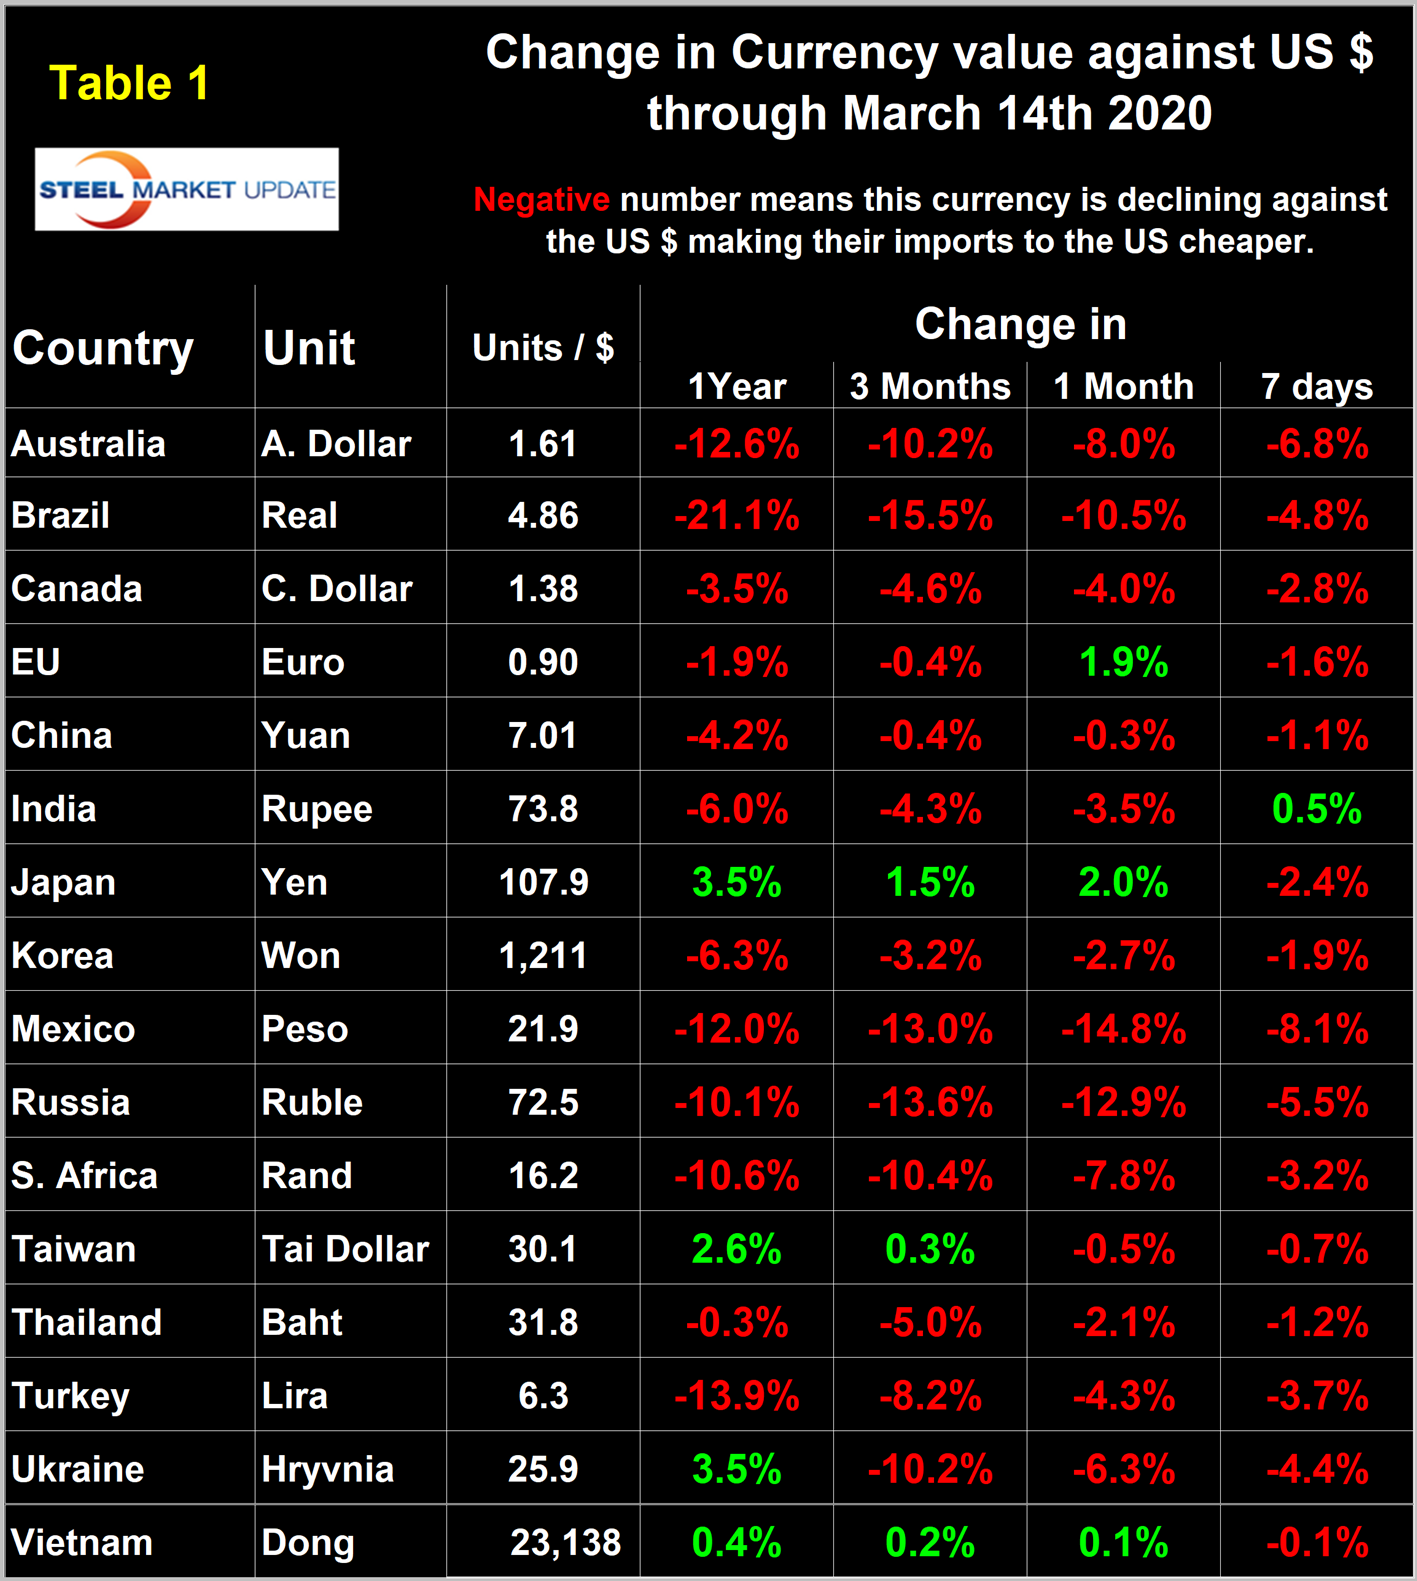
The U.S. dollar strengthened against 13 of the 16 steel and raw materials trading nation currencies in the last three months. In the last 30 days, the currencies of Brazil, Mexico and Russia were down by double digits. Australia was down by 8.0 percent and South Africa by 7.8 percent. The decline accelerated in the last seven days as news of the coronavirus pandemic worsened.
![]()
In this report we examine the change in currency values of the 16 pre-eminent global steel and iron ore trading nations. The currencies of these 16 don’t necessarily follow the Broad Index value of the U.S, dollar. In fact, at any given time, some are always moving in the opposite direction. The latest value of the Broad Index as published by the Federal Reserve was March 6, which was before the worst of declines described above. Our data from Oanda was current as of March 14.
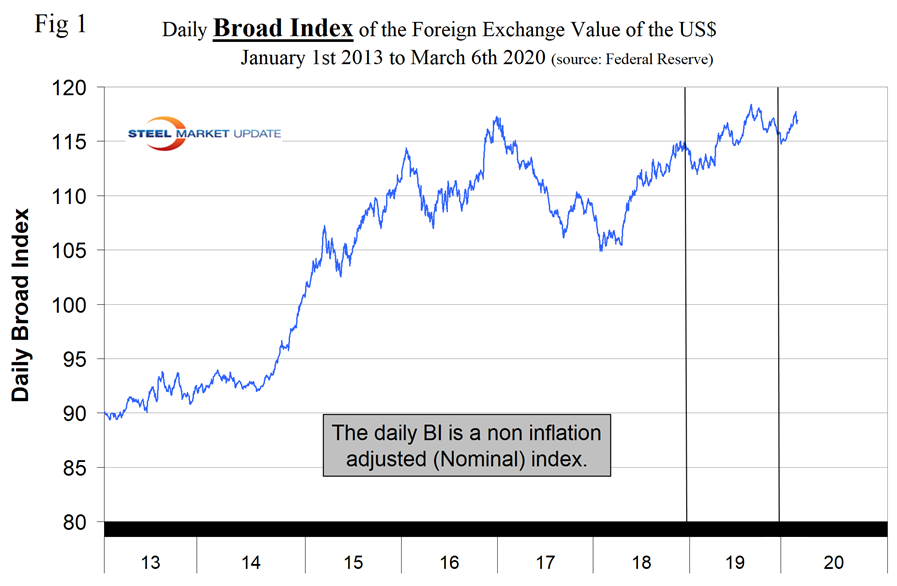
Figure 1 plots the daily Broad Index (BI) value of the U.S. dollar since 2013. By March 6, the dollar had appreciated by 1.9 percent since the end of December.
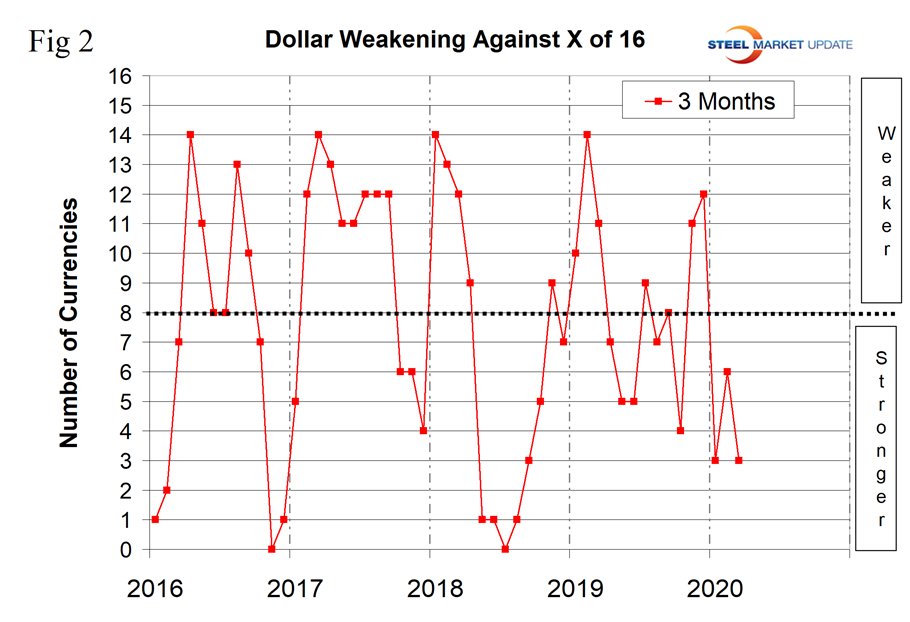
The story of the currencies of the steel and raw materials trading nations has been much more dramatic. Steel Market Update tracks the currencies of these 16 nations on a daily basis and reports monthly. Table 1 shows the number of currency units that it takes to buy one U.S. dollar and the percentage change in the last year, three months, one month and seven days. The overall picture for the steel trading nations is that in the last year the U.S. dollar has strengthened against 12 of the 16. In the last three months and one month the dollar has strengthened against 13 and in the last seven days has strengthened against 15. Table 1 is color coded to indicate weakening of the dollar in green and strengthening in red. We regard strengthening of the U.S. dollar as negative and weakening as positive because of the effect on net imports. Figure 2 shows the extreme gyrations that have occurred at the three-month level in the last four years.
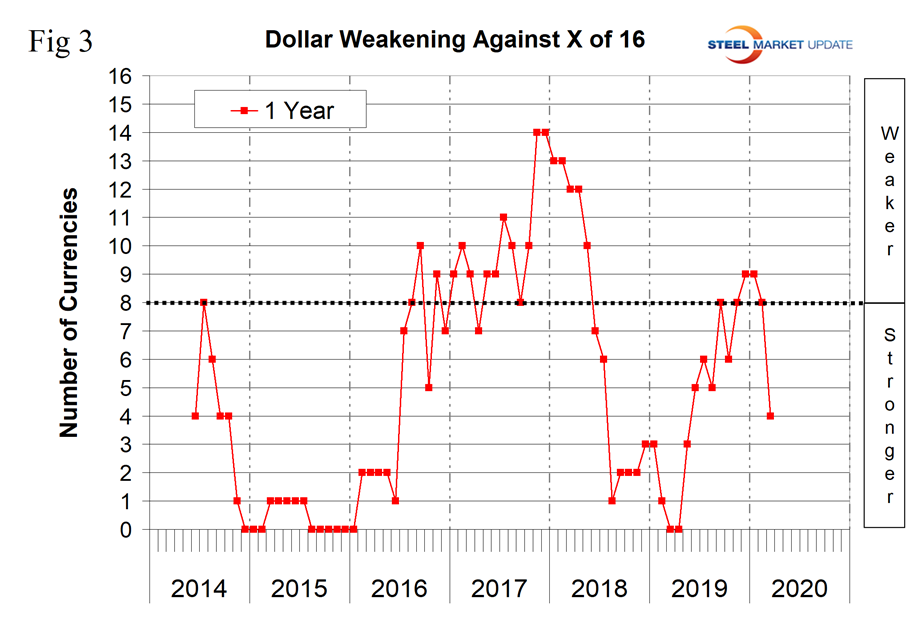
To get a less volatile look at the changes in value of the 16 currencies, we have developed Figure 3. This shows the number of currencies against which the dollar was weakening on a year-over-year basis. In December 2019 and January 2020, the dollar was weakening against nine of the 16; by mid-March 2020 it was weakening against four. A strengthening dollar puts downward pressure on globally traded raw materials prices.
The biggest changes in the last month were the Australian dollar down 8.0 percent, the Brazilian real down 10.5 percent, the Mexican peso down 14.8 percent, the Russian ruble down 12.9 percent and the South African rand down 7.8 percent. About half of these declines occurred in the last seven days, so it probably isn’t over yet. We present charts of the history of these five currencies below, which all show the magnitude of the recent decline. (See the end of this report for details of data sources.)
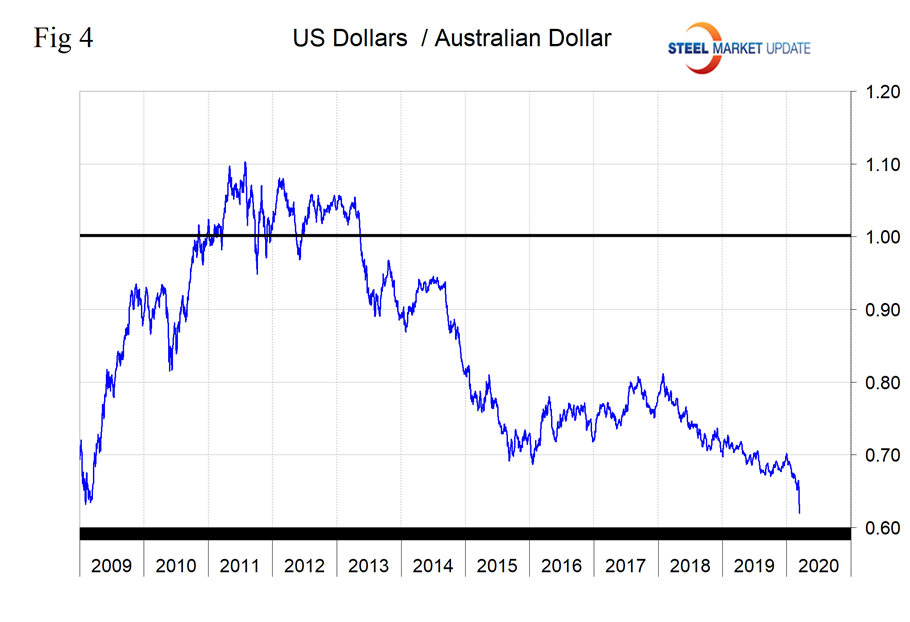
The Australian Dollar
In the last 12 months, Australia’s dollar has declined by 12.6 percent, and by 6.8 percent in the last seven days.
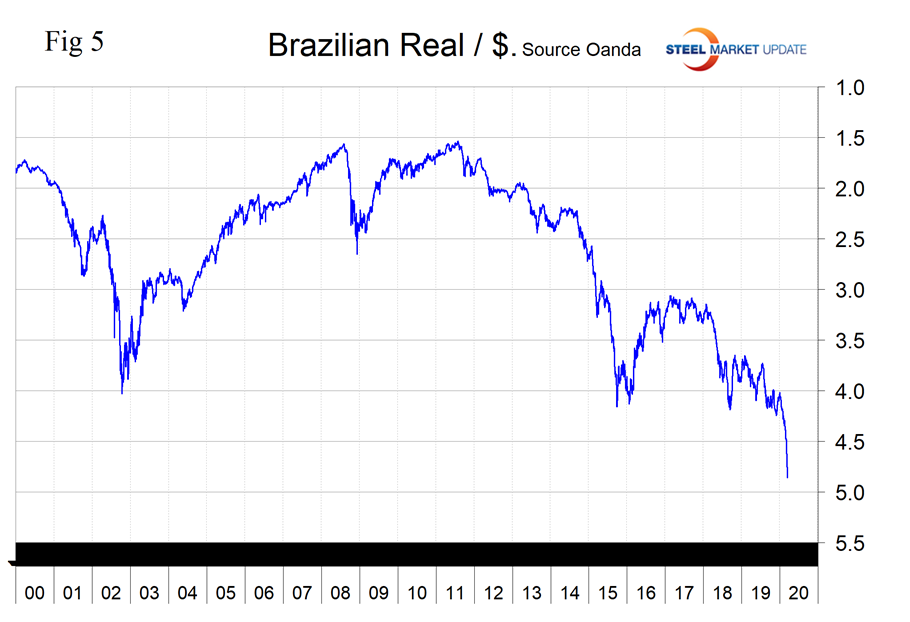
The Brazilian Real
In the last 12 months, Brazil’s real has declined by 21.1 percent, and by 10.5 percent in one month. Since Jan. 9, 2019, the real is down by 23.9 percent.
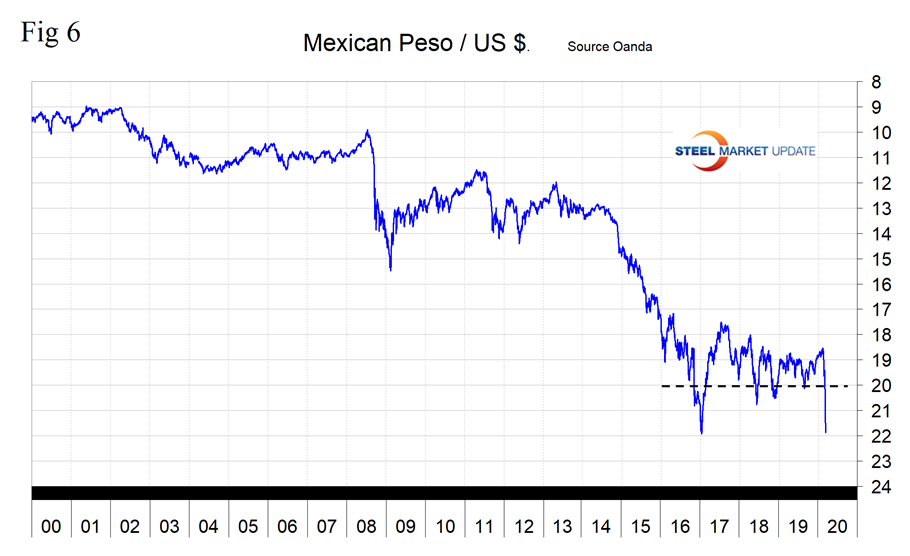
The Mexican Peso
Mexico’s peso was unusually stable for the first seven months of 2019 before declining through 20 to the dollar on Aug. 28. By Feb. 16, 2020, the peso had recovered to 18.53, but by March 14 had crashed to 21.88 to the dollar. The peso has depreciated by 8.1 percent in the last seven days.
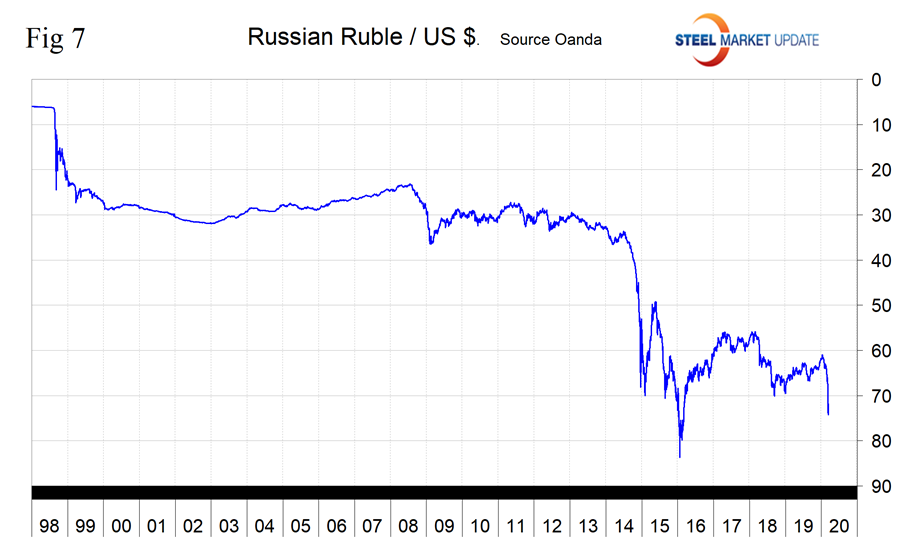
The Russian Ruble
Russia’s ruble has declined by 13.6 percent in the last three months, almost all of which occurred in the last month.
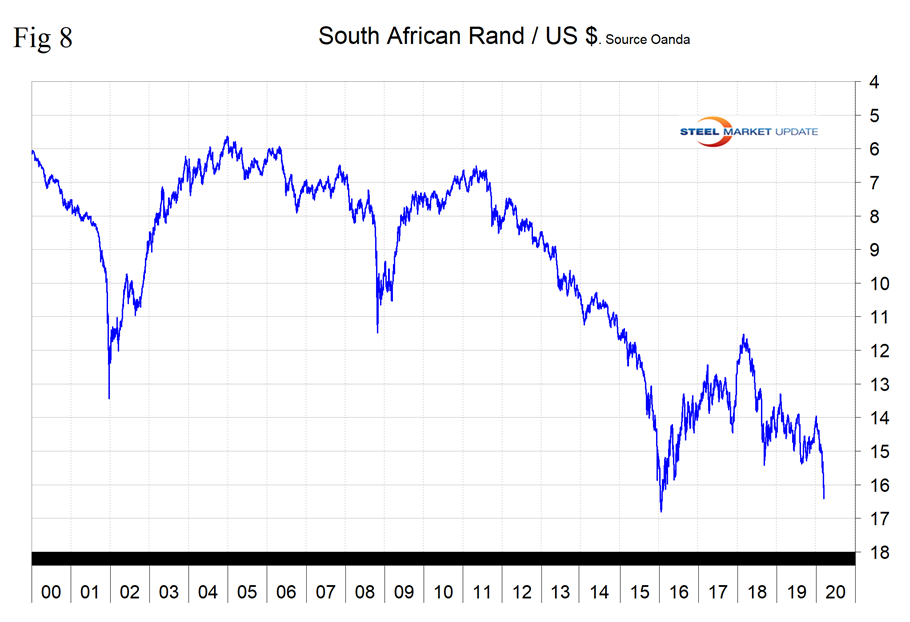
The South African Rand
South Africa’s rand has declined by 10.4 percent in the last three months and by 7.8 percent in one month.
In this monthly analysis we show the trends we think have the most immediate significance, but all 16 steel trading nation graphs are available on request.
Explanation of data sources: The Broad Index is published by the Federal Reserve on both a daily and monthly basis. It is a weighted average of the foreign exchange values of the U.S. dollar against the currencies of a large group of major U.S. trading partners. The index weights, which change over time, are derived from U.S. export shares and from U.S. and foreign import shares. The data are noon buying rates in New York for cable transfers payable in the listed currencies. At SMU we use the historical exchange rates published in the Oanda Forex trading platform to track the currency value of the U.S. dollar against that of 16 steel trading nations. Oanda operates within the guidelines of six major regulatory authorities around the world and provides access to over 70 currency pairs. Approximately $4 trillion U.S. dollars are traded every day on foreign exchange markets.


