

Market Data

March 16, 2020
Long Products Shipments and Supply Through January
Written by Peter Wright
Demand for long products declined by 3.5 percent in the three months through January, but rebar was up by 9.6 percent.
This analysis is based on steel mill shipment data from the American Iron and Steel Institute (AISI) and import-export data from the U.S. Department of Commerce (DoC). It summarizes total steel supply by product from 2008 through January 2019 and year-on-year changes. The supply data is a proxy for market demand, which does not take into consideration inventory changes in the supply chain. Our analysis compares domestic mill shipments with total supply to the market. It quantifies market direction by product and enables a side-by-side comparison of the degree to which imports have absorbed demand.
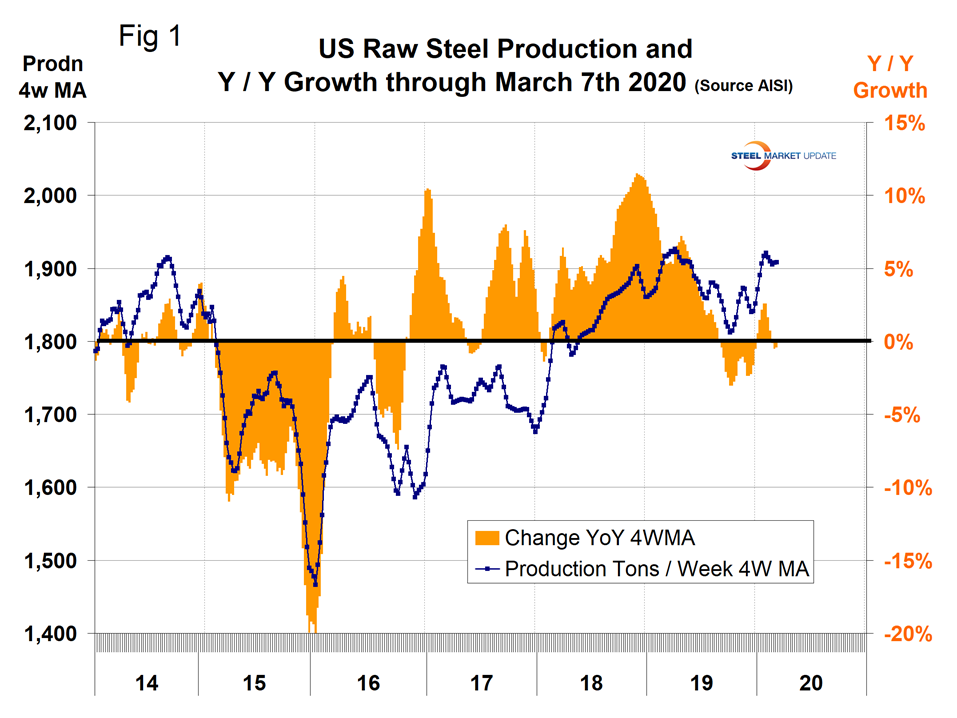
Figure 1 shows that the robust growth of U.S. raw steel production that occurred in 2018 reversed in 2019 until the week ending Oct. 5, when there was a turnaround that lasted until Feb. 8. This is a four-week moving average and is based on weekly data from the AISI.
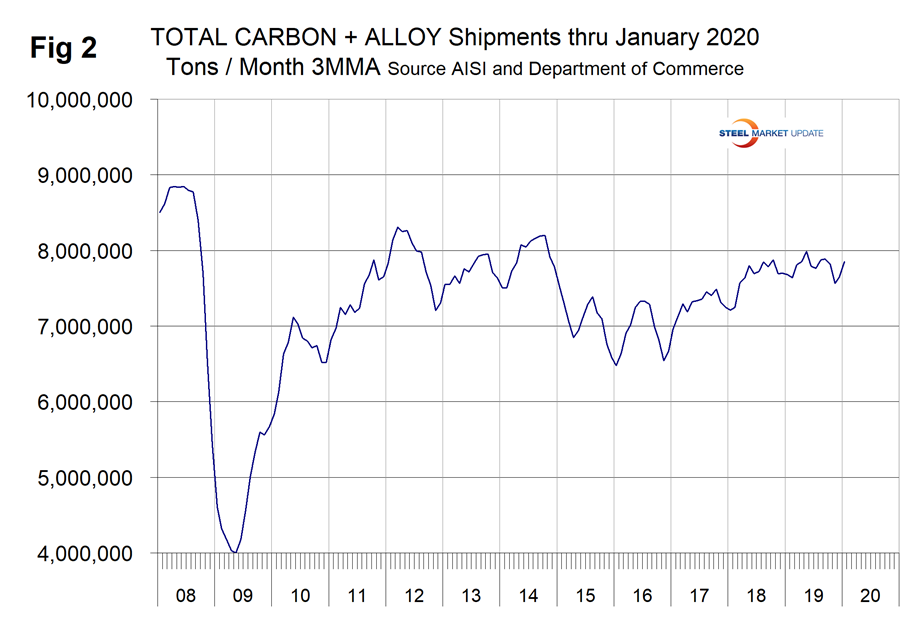
The shipments and supply data in this analysis is based on monthly shipments by product as reported by the AISI, plus import and export data from the DoC. Figure 2 shows the monthly shipment data for all rolled steel products. In the long run the trajectories of growth in Figures 1 and 2 are comparable, but the decline in 2019 is less obvious in the monthly data.
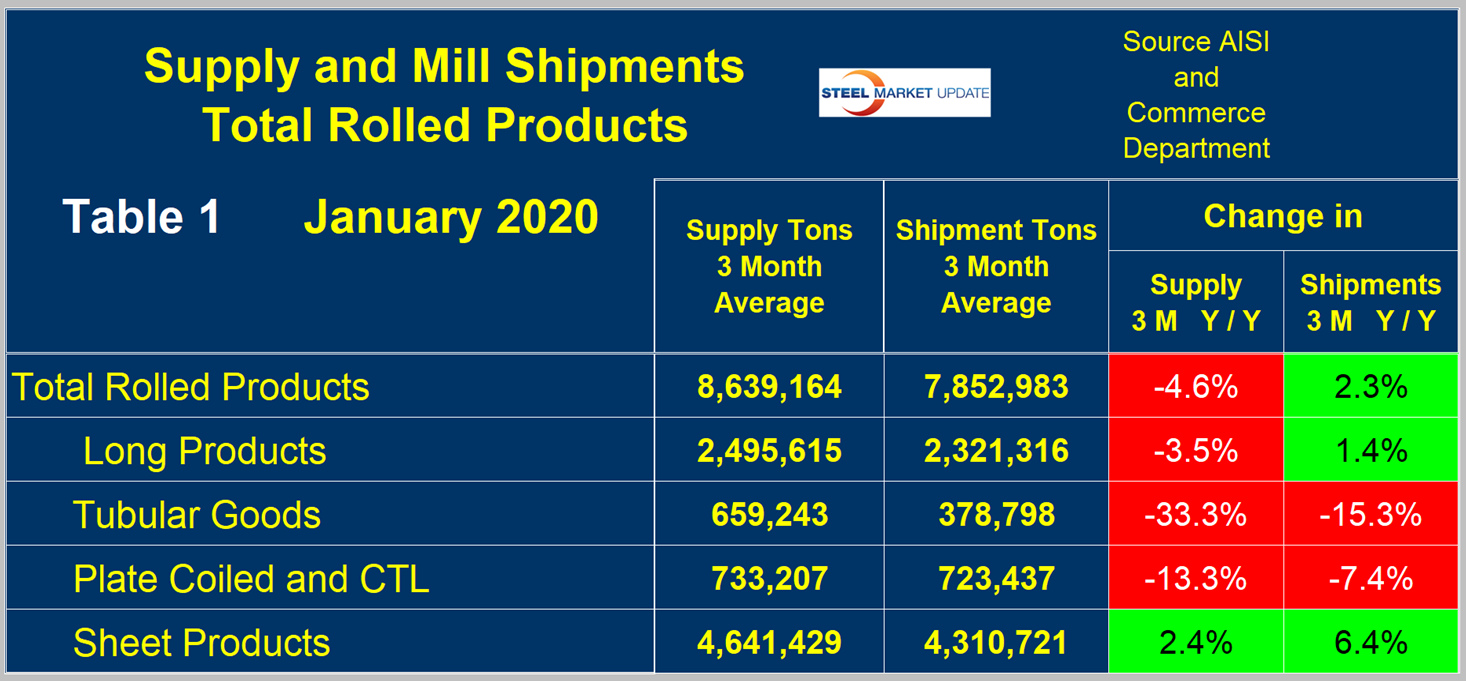
There are major differences between products in the shipment and supply situation as shown in Table 1. Total supply (proxy for market demand) as a three-month moving average (3MMA) was down by 4.6 percent year over year and mill shipments were up by 2.3 percent, meaning that imports took a smaller slice of the pie in the three months through January year over year. Sheet products were the only group to have positive growth in both shipments and supply in the same period. The supply of long products was down by 3.5 percent, but shipments were up by 1.4 percent. The worst performers were tubulars and plate.
As we examine the monthly results, seasonality of the demand for long products is significant with an 11-year historical average that varies by 11.4 percent between the high month of August and the low month of February. Over this 11-year period, March through July have been fairly consistent as shown in Figure 3. November and December are always depressed by inventory adjustments, which are corrected in January. On average since and including 2010, January has been up by 8.9 percent from December and this year was up by 8.0 percent.
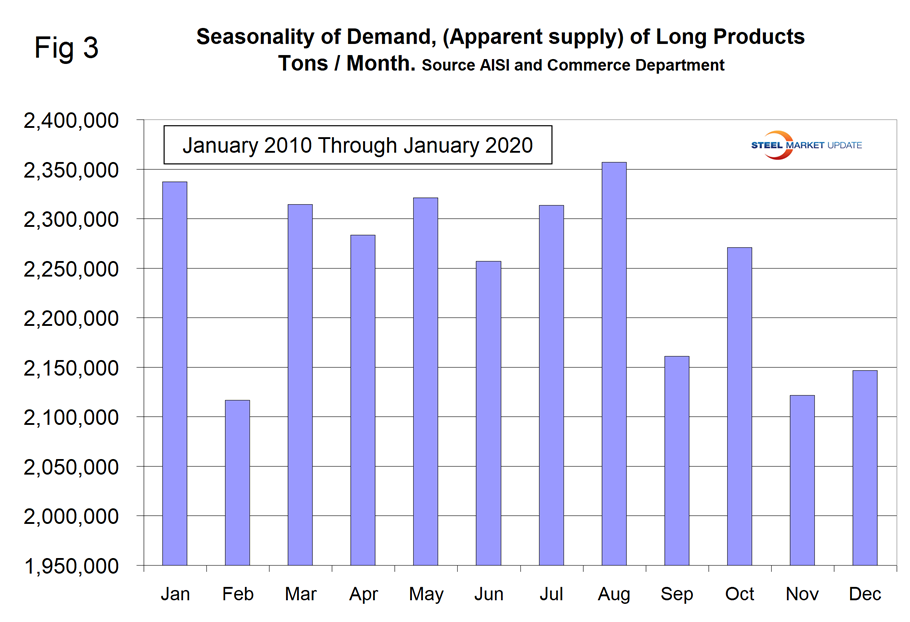
Table 2 describes both apparent supply and mill shipments of long products (shipments includes exports) side by side as three-month averages through January with year-over-year growth rates for each. Comparing the year-over-year time periods, total supply of long products to the market decreased by 3.5 percent on a 3MMA basis and mill shipments increased by 1.4 percent. Table 2 breaks down the total into product detail and shows that rebar driven by all-time high infrastructure expenditures was the only long product with a good performance. The supply of all other long products was down, and only bar-sized shapes and cold finished bar had positive year-over-year growth of shipments. In the three months through January 2019, the average monthly supply of long products was 2.5 million tons. There is no seasonal manipulation of any of these numbers. By definition, year-over-year comparisons have seasonality removed.
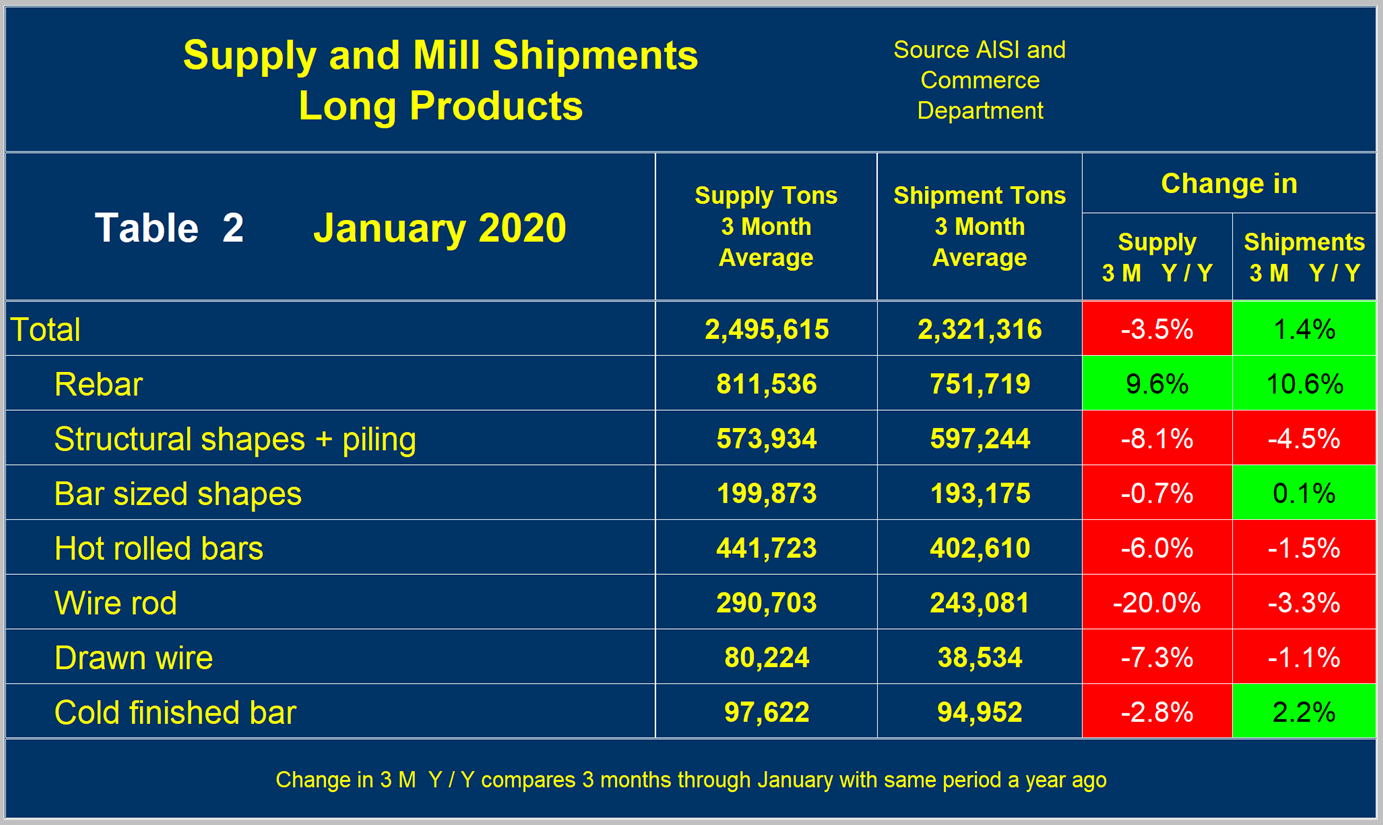
Table 3 shows the change in supply in 3, 12 and 24 months. The 12-month column is the same as in Table 2. There was a small improvement of 1.0 percent in the 3M/3M comparison led by rebar and small shapes. All other products declined on this basis. Table 3 shows the detail of the individual long products.
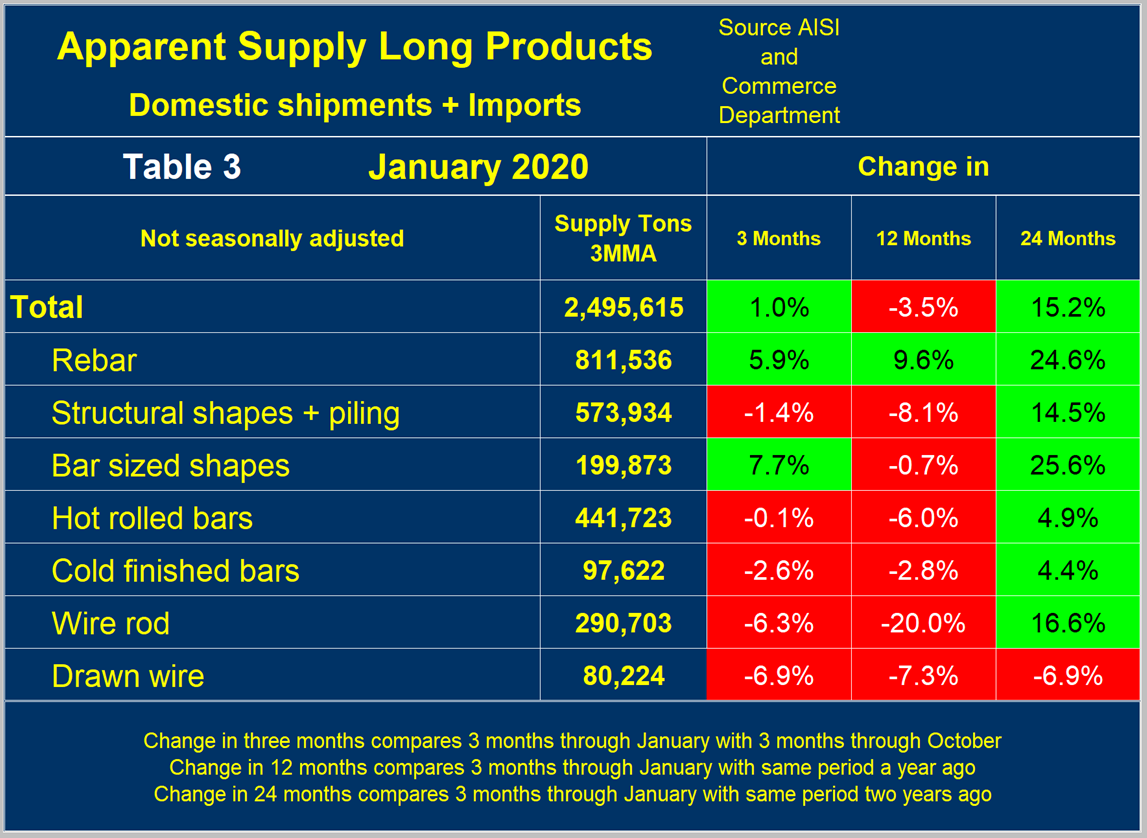
Figure 4 shows the long-term supply picture for the five major long products since January 2006 as three-month moving averages. Rebar has been trending up for two years, structural shapes have been trending down since October 2018, hot rolled bars and wire rod have been trending down since April 2019, and light shapes have been flat for over a year.
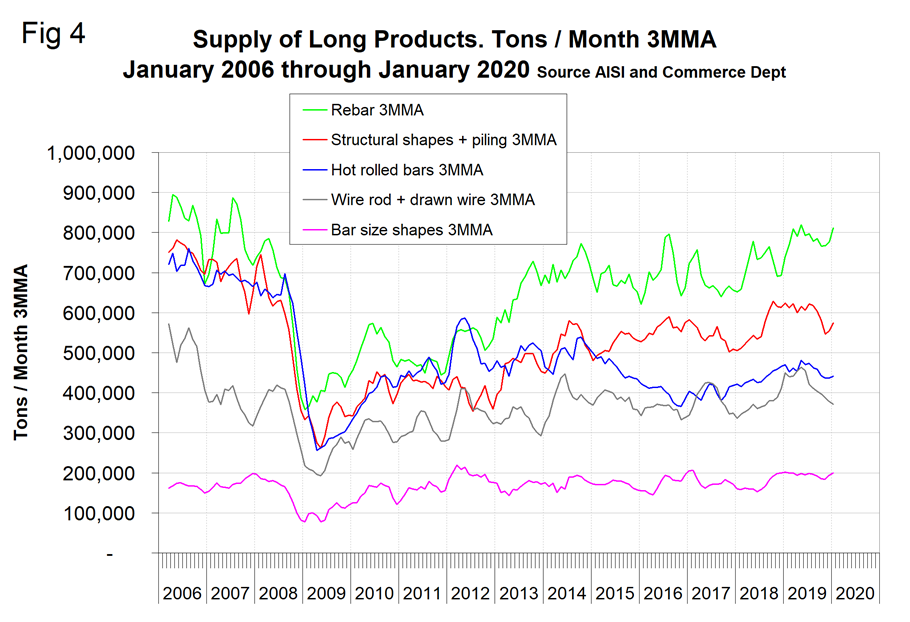
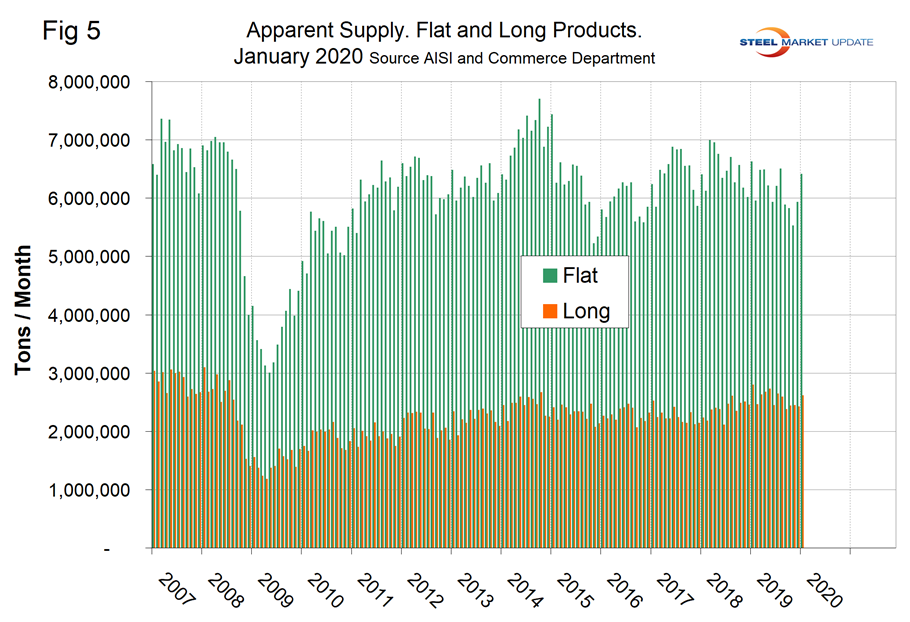
Figure 5 shows the long-term comparison between long and flat products. These are monthly numbers (not 3MMA), and clearly show the trend difference between longs and flat products, including plate. Flat rolled peaked in March 2018. Longs peaked in January 2019 and have been trending down since then with the normal inventory build jump in January 2020.
SMU Comment: The major driver of long product demand is construction, which had an excellent performance in January with positive growth in all the sectors that we identify in our Construction Put in Place Analysis. This was reflected in the demand for rebar identified in this long product report. Nonresidential building expenditures became increasingly positive in November, December and January, and this will be reflected in structural steel demand in the next few months.


