

Market Data
March 16, 2020
PPI Data: Cold Rolled Steel, Aluminum Prices Trend in the Same Direction
Written by Peter Wright
In the last 12 months, the price declines of cold rolled carbon steel and aluminum sheet have been similar.
This report is an analysis of Bureau of Labor Statistics data and is intended to provide subscribers with a view of the competitive position of sheet steel, aluminum, plastic and wood. The analysis includes some downstream products and a comparison of truck and rail transportation.
![]()
On March 10, the BLS released its series of PPIs for more than 10,000 goods and services through February. For an explanation of this program, see the end of this piece. The PPI data are helpful in monitoring price direction, though there may be a lag between the BLS reports and spot prices for steel products. The actual index values of the PPIs of different products cannot be compared with one another because they are developed by different committees within the BLS. We believe this data is useful in comparing the direction of price changes in the short and medium term but tell us nothing about the absolute value.
Figure 1 shows the composite PPI of all commodities since January 2008. The index rose steadily for two and a half years through October 2018 before declining by 4.0 percent through February 2020, with an acceleration in the month of February. Overall, the composite was up by 2.9 percent in the 12 months of 2018 and broke even in 2019.
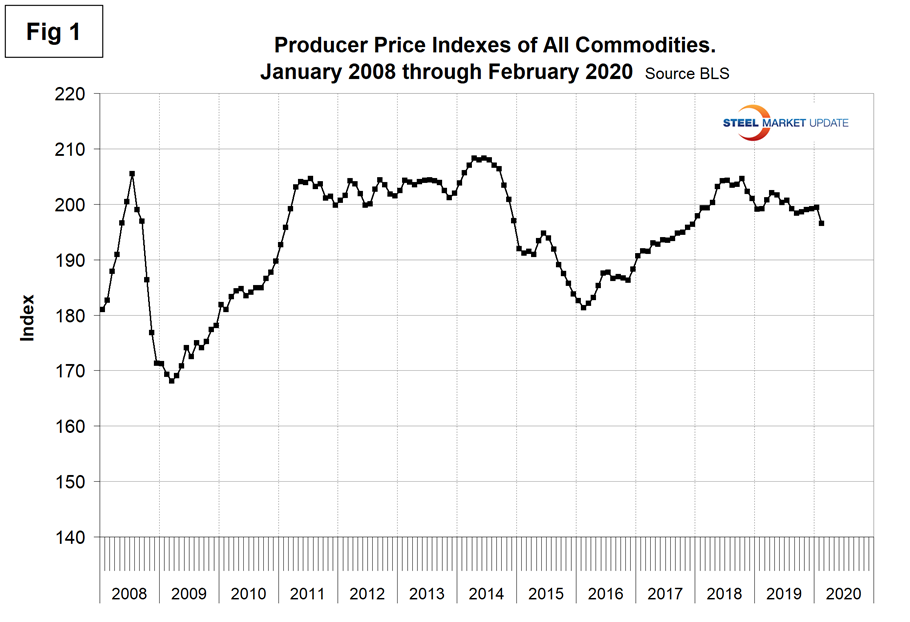
Table 1 is a summary of each segment that we examine on a year over one-, two- and three-year basis. The gain-loss pattern is shown by the color codes; we interpret rising prices as positive. We began this bimonthly analysis in January 2016 and the table was predominantly green at the 24-month and 36-month level through September last year. In December, eight of the 16 sectors were declining at the 12-month level, a decrease from 10 in our September analysis. The table includes direct comparisons where possible between steel and competing products, also some other plastic products for which there is no direct steel comparison, and a measure of price changes for transportation, warehousing and storage. Some specific comparisons of steel and steel products with their competition are as follows. Please note the Y axes on Figures 3 through 7 are not to the same scale.
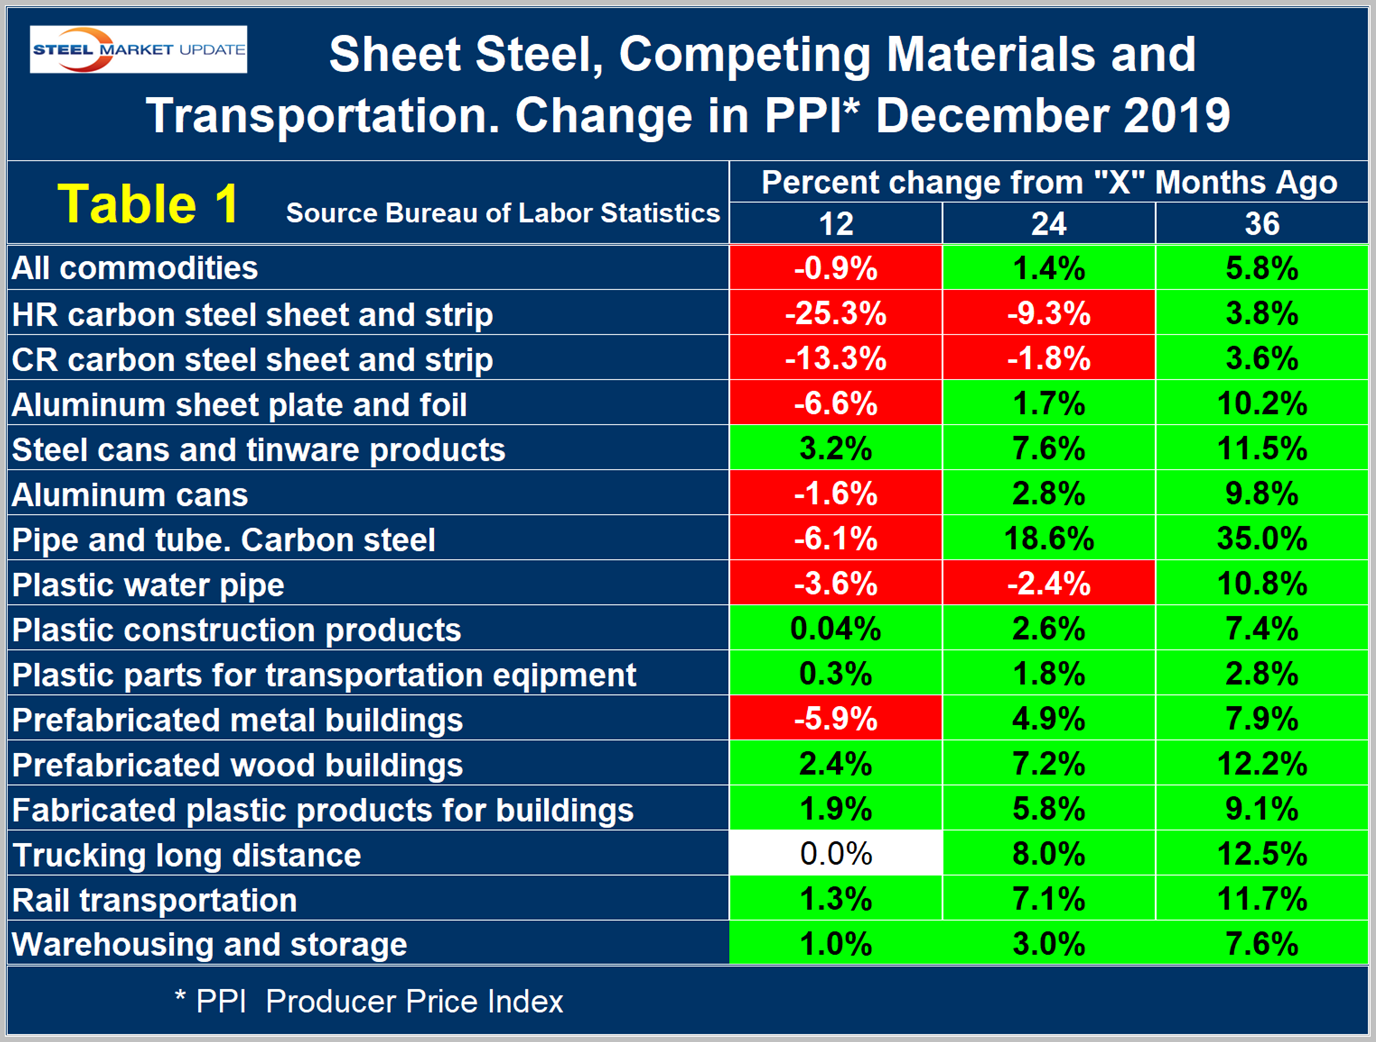
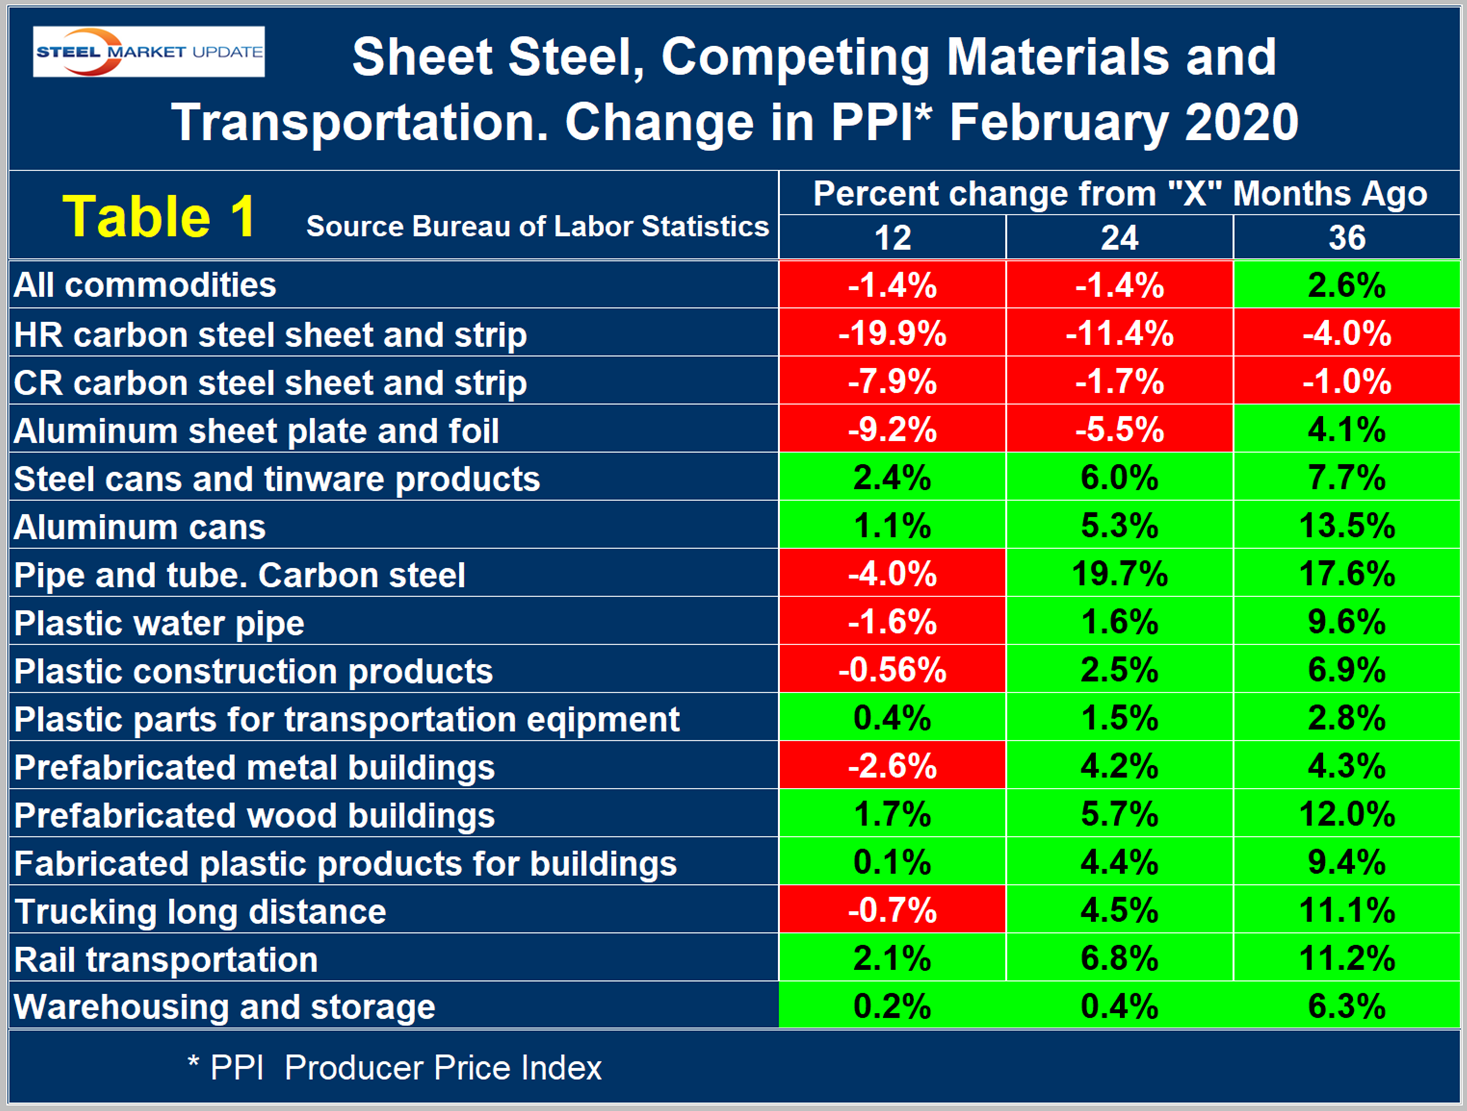
Figure 2 shows the year-over-year comparison of the price change of cold rolled steel sheet and flat rolled aluminum. The lines crossed in August 2018 when steel prices began to escalate faster than aluminum. This relationship reversed in July 2019 and for six months the price of cold rolled declined faster than that of aluminum sheet. By February 2020, the rates of price escalation had equalized.
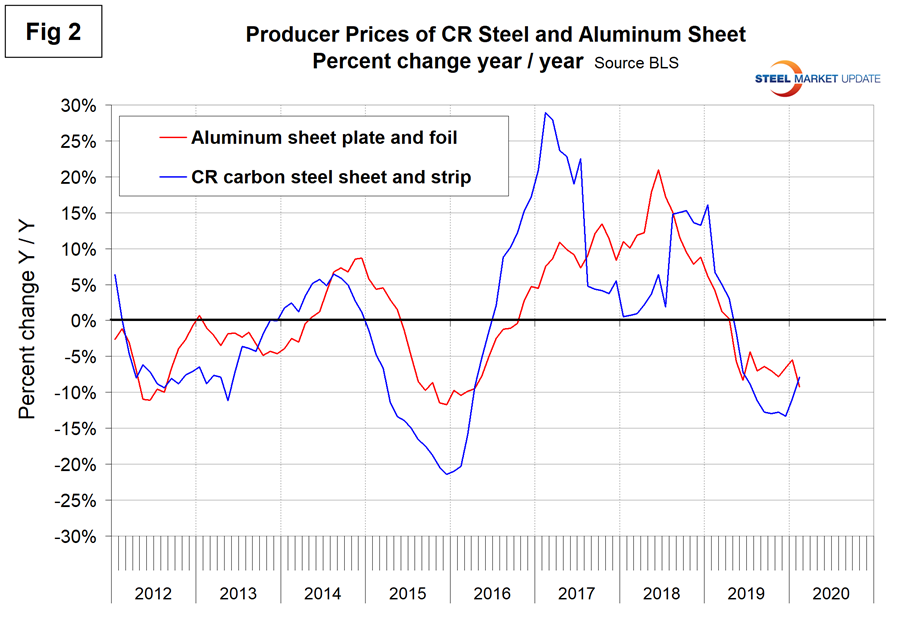
Figure 3 shows the same comparison for steel tinware products and aluminum cans. Since 2016 there has been no relationship between the price change of either type of can with their raw materials prices. Since January 2019 the price changes of steel and aluminum cans have been identical at negative 2.01 percent, but by very different routes in those 14 months.
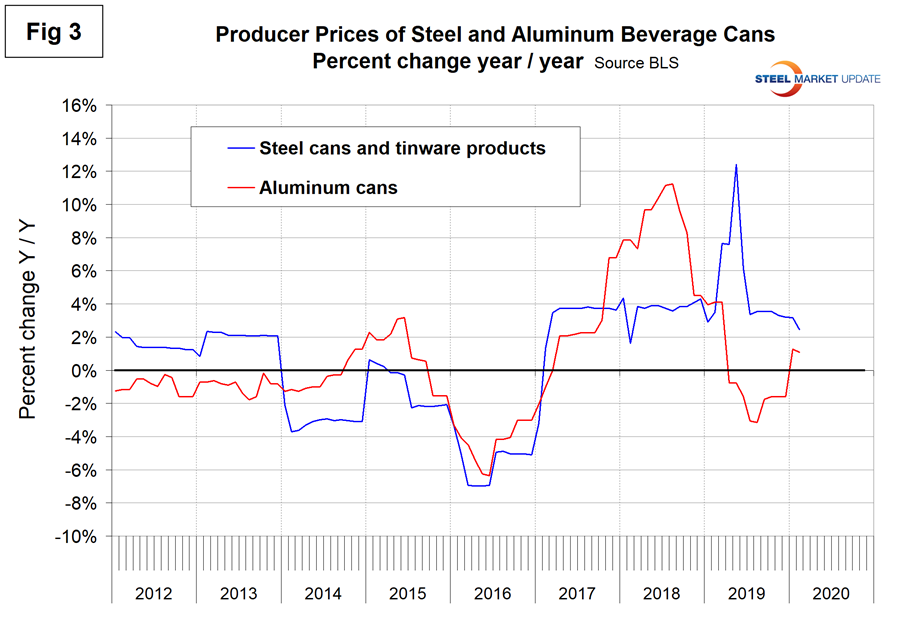
Figure 4 compares prefabricated metal with prefabricated wood buildings. In this analysis, steel lost ground from a competitive point of view in 2018 and made it up in 2019. The price of steel buildings is still declining and the price of wood buildings continues to escalate.
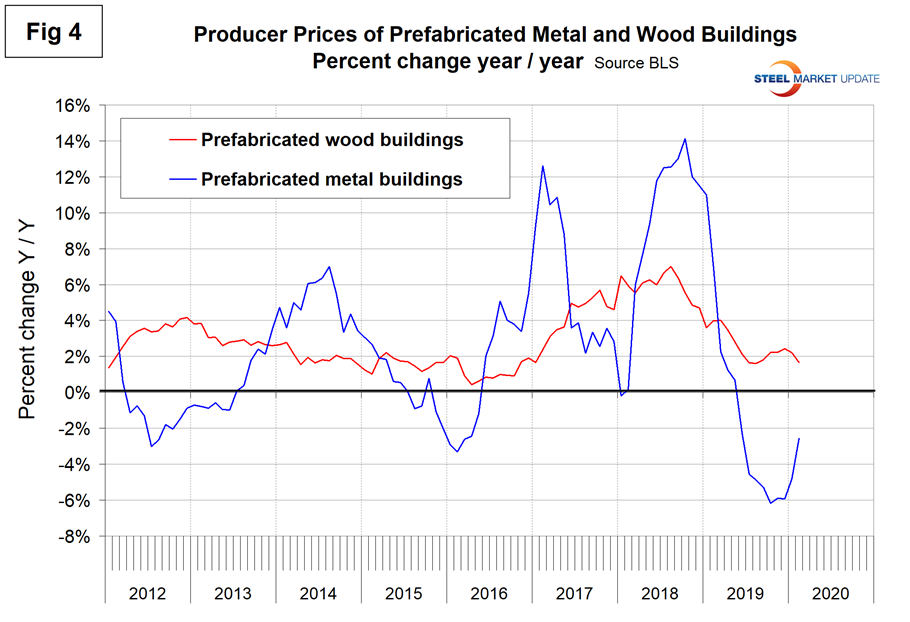
Figure 5 compares the price changes of steel and plastic pipe, which moved in opposite directions to the detriment of steel in 2018. In 2019, the rates of price escalation had come back in line by July where they have stayed through February 2020.
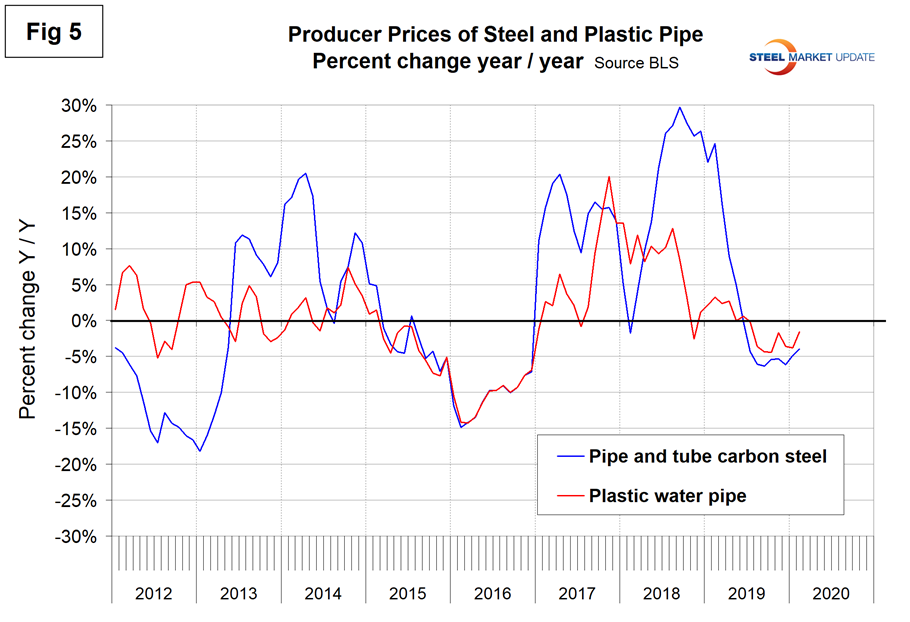
Figure 6 compares the changes in the price of truck and rail transportation. The escalation of truck transportation prices exceeded those of rail almost every month from January 2015 through April 2019 when the lines crossed. Trucking had negative price escalation since August last year as rail prices have continued to increase.
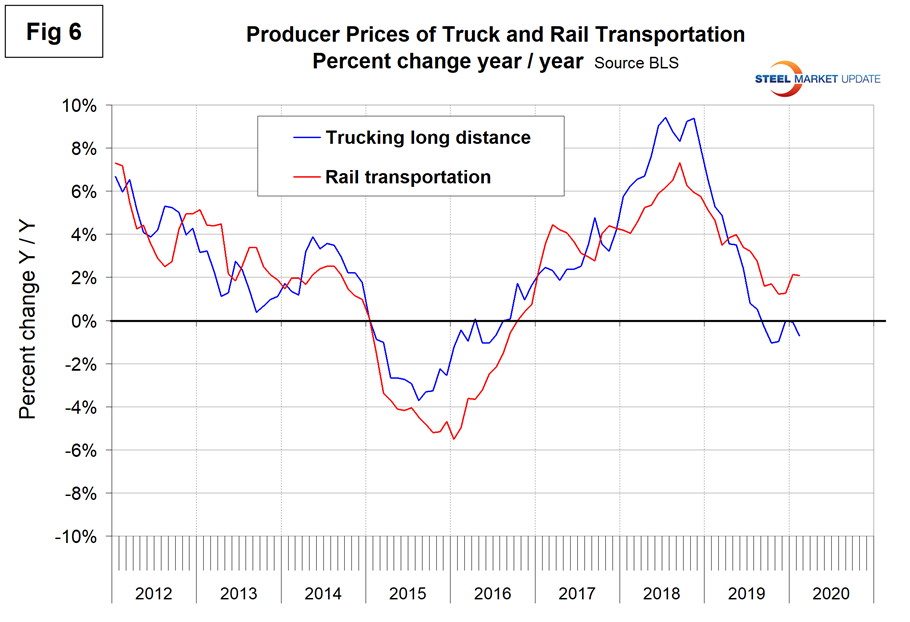
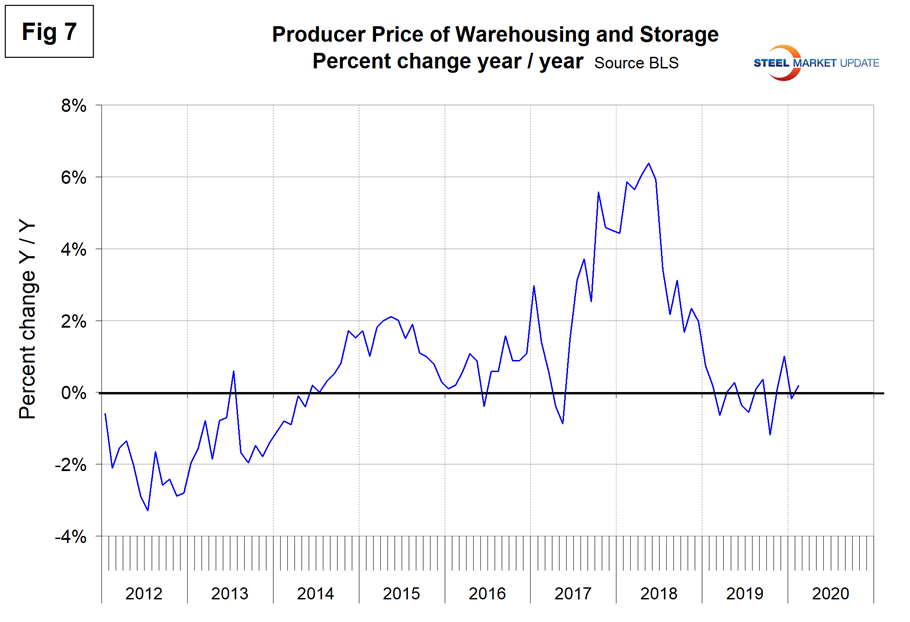
Figure 7 shows that the rate of change of the price of warehousing and storage declined steadily from April 2018 through March 2019 and since then has been relatively stable though erratic.
The official description of this program from the BLS reads as follows: “The Producer Price Index (PPI) is a family of indexes that measure the average change over time in the prices received by domestic producers of goods and services. PPIs measure price change from the perspective of the seller. This contrasts with other measures, such as the Consumer Price Index (CPI). CPIs measure price change from the purchaser’s perspective. Sellers’ and purchasers’ prices can differ due to government subsidies, sales and excise taxes, and distribution costs. More than 10,000 PPIs for individual products and groups of products are released each month. PPIs are available for the products of virtually every industry in the mining and manufacturing sectors of the U.S. economy. New PPIs are gradually being introduced for the products of industries in the construction, trade, finance, and services sectors of the economy. More than 100,000 price quotations per month are organized into three sets of PPIs: (1) Stage-of-processing indexes, (2) commodity indexes, and (3) indexes for the net output of industries and their products. The stage-of processing structure organizes products by class of buyer and degree of fabrication. The commodity structure organizes products by similarity of end use or material composition. The entire output of various industries is sampled to derive price indexes for the net output of industries and their products.”


