Market Data

March 16, 2020
Service Center Shipments and Inventories Report for March
Written by Estelle Tran
We had to change the way we calculate the adjusted data, which will also change how we derive our analysis. Previously, we adjusted the data to mirror the exact mix of service centers that responded to the previous month’s survey. We saw a decrease in participation in the March survey, which we can understand given the business uncertainty created by Covid-19. To continue to provide analytically valuable data, we are going to normalize data for 100% participation in the survey. We rely on the consistent participation of our survey partners to help us create robust data to track industry trends. Going forward, we will compare adjusted figures to the previous month’s adjusted figures, and we encourage readers to pay more attention to the calculations, such as shipping days of supply. More consistency in our data collection and this calculation change also will allow us to begin tracking a new indicator – intake. Thanks to our data providers for making this possible.
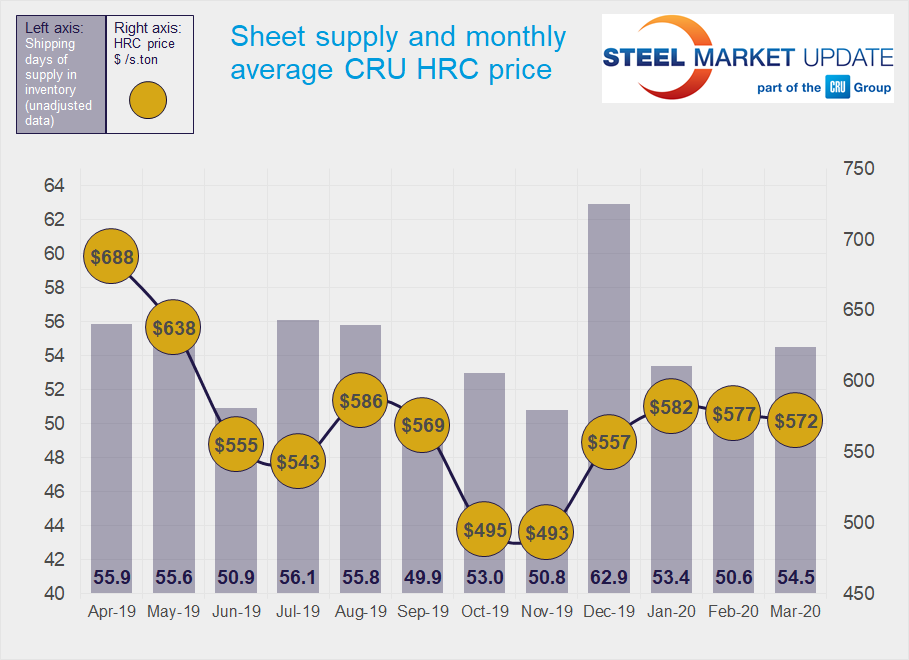
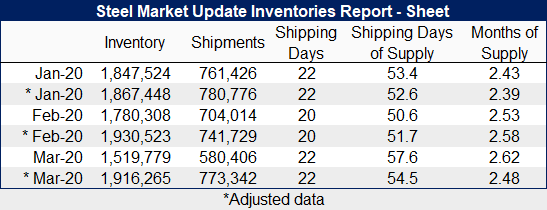
Flat Rolled = 54.5 Shipping Days of Supply
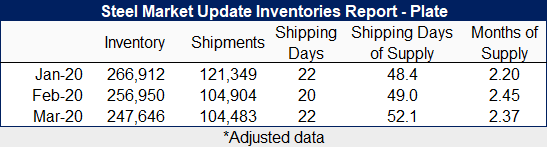
Plate = 52.1 Shipping Days of Supply
Flat Rolled
Service centers supply of flat rolled steel increased in March but not as much as expected, as shipments increased slightly. At the end of March, service centers carried 54.5 days of supply, up from 51.7 in February. March had 22 shipping days to February’s 20. In terms of months, this represented 2.48 months on hand, down from 2.58 in February.
Service centers surprised with a 3.5 percent month-on-month increase in shipments in March. Part of this can be attributed to two extra shipping days. The saying that March comes “in like a lion, out like a lamb” could also describe the story for shipments. Many service centers started the month with strong business levels. With the rapid spread of Covid-19, service centers started seeing the impact on their businesses in the second half of the month, more so for companies that serve the auto and energy industries. Some businesses with high inventories, anticipating the imminent decrease in prices and demand, could have pulled orders forward.
The percentage of inventory on order dropped significantly, reflecting negative sentiments.
Looking ahead, we expect service center supply to look even higher as Covid-19-related closures further drag on shipments. Service centers are avoiding placing new orders, seeing prices and demand dropping each week. Even with the idling of multiple integrated mills, lead times continue to move in. SMU reported on April 1st that lead times shrank to 3.81 weeks for HRC from 4.5 weeks in the March 15th survey.
Plate
Plate supply at US service centers similarly increased in March, as inventories decreased 3.6 percent month on month but shipments were flat. Service centers carried 52.1 shipping days of supply at the end of March, up from 49 in February. This translates to 2.37 months of supply in March, versus 2.45 in February.
Though prices for plate have not been as volatile as sheet and construction has been relatively steady despite the Covid-19 market disruptions, the outlook remains negative, particularly for companies with exposure to the energy sector.
Service centers cut their volumes of plate on order in March, and mill lead times have moved in. SMU reported on April 1st that lead times edged in to 4.33 weeks from 4.64 weeks in the previous survey.