Market Data

March 22, 2020
Service Center Spot: Prices Taking a Turn?
Written by Tim Triplett
Spot prices appear to have turned a corner as a growing percentage of both service centers and their manufacturing customers report steel prices on the decrease.
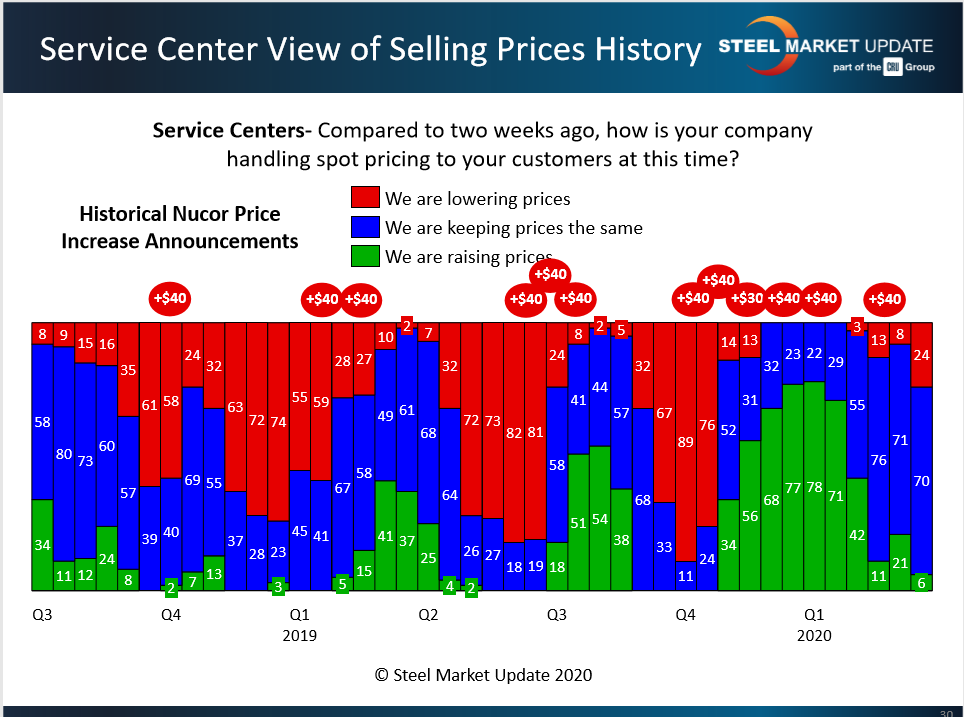
As the chart below shows, 24 percent of the service centers responding to Steel Market Update’s questionnaire this past week now say they are lowering prices to their customers. That is three times the 8 percent who were lowering prices a few weeks ago. Early in March, 21 percent said they were increasing prices following the late February price increase of $40 announced by the mills. It appears the coronavirus may have derailed the mills’ hopes for higher prices anytime soon.
Still, the vast majority (70 percent) said they were keeping prices the same, while 6 percent were still raising prices, so the degree to which steel prices will be impacted by the market’s reaction to the virus remains far from clear.
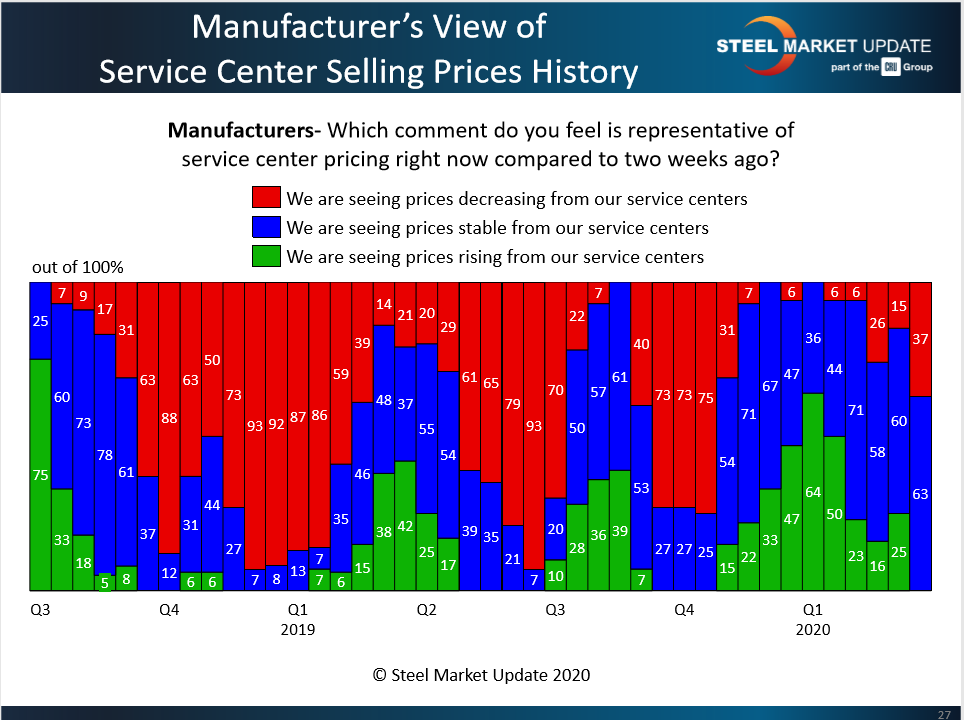
Manufacturers, the service centers’ customers, confirmed the downturn in spot prices. Thirty-seven percent reported they were seeing decreasing prices from their service center suppliers, and none reported seeing rising prices. The last time a higher percentage of manufacturers reported declining prices was back in October prior to the series of price increases announced by the mills. Those increases took the benchmark price for hot rolled from a 2019 low of $470 a ton to $610 per ton in mid-January. Since then, even before the virus, the price had struggled to sustain any traction. Steel Market Update data places the current average price for hot rolled at $565 per ton, down $15 from the prior week and down $45 from the January peak.
Given the coronavirus crisis, where prices go from here is anyone’s guess.